
How to Find What's Slowing Your Pages Down
A slow page is a symptom, not a diagnosis. "The page is slow" is roughly as useful to act on as "the car makes a noise" — true, frustrating, and a starting point at best. Yet a great deal of page-speed work begins and ends right there: someone notices a sluggish page, declares it slow, and either panics or hands a vague complaint to a developer who now has to do the actual diagnostic work the complainer skipped.
This article is about doing that diagnostic work properly. The aim is not to fix anything yet — it is to find, specifically and confidently, what is making a given page slow, so that when a fix is applied it is the right fix aimed at the right cause. Slowness has a small number of recurring causes, they leave distinct fingerprints, and a methodical look will almost always tell you which one you are dealing with. We will go cause by cause.
First, decide which "slow" you are diagnosing
Before opening any tool, get precise about what is slow, because "slow" is actually three different complaints wearing the same word.
There is slow to appear — the page sits blank or half-formed for an uncomfortable stretch before the main content shows up. There is slow to respond — the page looks loaded, but when the visitor clicks or taps, there is a lag before anything happens. And there is slow to settle — the page appears quickly but then jumps and reflows as late-arriving elements push everything around. These three map almost exactly onto the three Core Web Vitals, and they have completely different causes. Diagnosing the wrong one wastes the whole investigation.
So the first move is observation, not measurement. Load the page yourself, ideally on a mid-range phone on a normal connection rather than your fast office laptop. Watch what actually happens. Does it stall blank? Does it ignore your first tap? Does it lurch as you read? Whatever you observed is the "slow" you are now going to diagnose. Everything below assumes you have done this and know which of the three you are chasing.
Cause one: the server is slow to answer
The earliest possible cause sits before the browser has done anything at all. When a visitor requests your page, your server has to receive that request, do whatever work it does — query a database, render a template, assemble the page — and send the first byte of response back. If that takes a long time, every other part of the load is delayed behind it, and no amount of front-end optimisation can rescue a page whose server is slow to start talking.
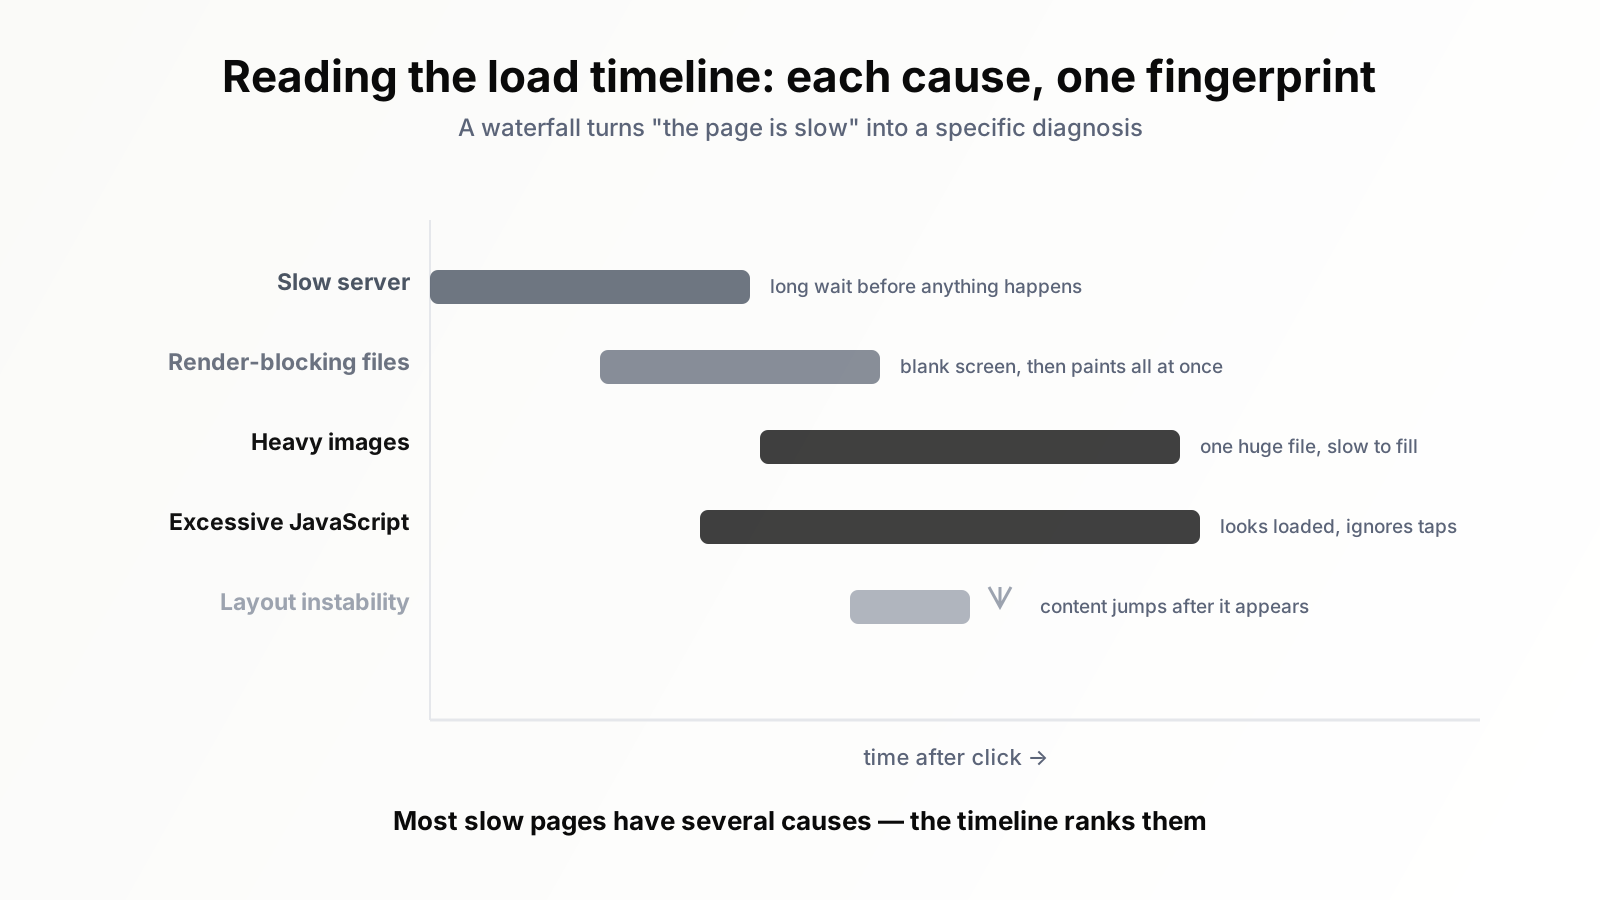
The fingerprint of this cause is a long delay before anything happens, followed by a relatively normal load once things get going. In diagnostic tools this shows up as a high "time to first byte." If you see the browser waiting, idle, with nothing to do because the server has not responded yet, you are looking at a server-side cause: slow database queries, an overloaded host, heavy server-side rendering work, or a missing layer of caching that forces every visit to rebuild the page from scratch. This is worth checking early precisely because it is upstream of everything else — a slow server makes every other measurement look worse than it is.
Cause two: render-blocking resources
Once the server responds, the browser starts building the page. But certain files — typically stylesheets and some scripts — are treated as render-blocking: the browser will not paint anything to the screen until it has downloaded and processed them. The intent is sensible (you do not want a flash of unstyled content), but it means a few badly-placed files can hold the entire page hostage.
The fingerprint here is a page that stays blank well after the server has responded, then appears all at once. In a diagnostic tool's waterfall view — the chart showing every file and when it loaded — you will see a cluster of CSS or JavaScript files loading early, with the first visual paint stubbornly waiting for them to finish. The slower those blocking files are, or the more of them there are, or the more they themselves depend on still further files, the longer the blank stretch. This is one of the most common causes of "slow to appear," and the waterfall makes it unmistakable: a wall of blocking resources, then, only afterward, the page.
Cause three: heavy images and media
Images are the most common reason the largest visible element of a page is slow to load — and on most pages, that largest element is an image. A hero image exported at full resolution, in an outdated format, with no compression, can easily be several times larger than it needs to be, and the browser has to download every byte before it can show it.
The fingerprint of an image problem is specific and easy to confirm: the page's structure appears reasonably fast, but a large image area stays blank or low-quality for a noticeable beat before snapping into place. In the waterfall, you will see one or more image files that are conspicuously large and slow compared to everything else. Confirming this cause takes seconds — find the biggest visible image, check its file size, and ask whether that size is remotely justified by its display dimensions. Very often it is many times larger than it should be. Media that loads but was never visible — images far down the page downloading immediately instead of waiting until the visitor scrolls near them — is a related, common variant of the same cause.
Cause four: too much JavaScript
JavaScript causes slowness in two distinct ways, and it is worth separating them. The first is download weight: a large bundle of JavaScript takes time to arrive, like any large file. The second, and more insidious, is execution cost: once the JavaScript arrives, the browser has to actually run it, and running JavaScript happens on the same single main thread the browser uses to respond to the visitor. While that thread is busy executing scripts, it cannot react to taps and clicks.
This is why JavaScript is the usual culprit behind "slow to respond." The fingerprint: the page looks completely loaded and ready, but interactions lag — the visitor taps and there is a pause before anything happens. In diagnostic tools this appears as long stretches of main-thread activity, often labelled as long tasks, blocking the browser from doing anything else. The more third-party scripts a page carries — analytics, chat widgets, ad tags, tracking pixels, A/B testing tools — the worse this tends to get, because each one adds both download weight and execution time, and they accumulate quietly. A page can pass every other check and still feel sluggish purely because it is carrying too much script.
Cause five: layout instability
The last common cause is the one behind "slow to settle." The page appears quickly enough, but then visibly reshuffles — an image loads and shoves the text down, a font swaps and the headline resizes, a banner appears and everything jumps. Strictly this is not slowness in the stopwatch sense; the page may have a fine load time. But it feels slow and broken to the visitor, and it is measured as a Core Web Vital, so it belongs in any honest speed diagnosis.
The fingerprint is purely visual and you will have caught it in your opening observation: things moving after the page has apparently loaded. The causes are specific and finite. Images and ad slots without their dimensions declared, so the browser does not reserve space and has to push content aside when they arrive. Web fonts that load late and resize the text they replace. Content injected near the top of the page after the rest has already laid out. Each leaves the same signature — a jump — and identifying which element jumped points you straight at the cause.
Putting the diagnosis together
With the five causes in hand, the investigation has a clear shape. Start with observation to identify which kind of slow you are facing. Then run a proper diagnostic tool on the page and read it in roughly upstream-to-downstream order: check the server response time first, because it sits beneath everything; then look at the waterfall for render-blocking resources; then for oversized images; then at the main-thread timeline for excessive JavaScript; and confirm any layout instability you observed against the elements that moved.
What you are building is not a single answer but a ranked list. Most slow pages have more than one cause, and the diagnostic tells you which is doing the most damage. A page might have a mildly slow server, a moderately heavy image, and an enormous JavaScript problem — and knowing the JavaScript is the dominant cause means that is where the first fix goes. The point of a methodical diagnosis is exactly this prioritisation: you finish with specific, ranked causes instead of a vague "make it faster," and the fix work that follows is aimed rather than scattered. For where this fits in the larger picture of which speed work is worth doing at all, our piece on site speed as a ranking factor is the companion to this one.
Diagnose in the field, not just the lab
One discipline keeps a speed diagnosis honest: remember that a single diagnostic run on your own machine is one data point under one set of conditions. It is excellent for identifying causes — the fingerprints described above all show up clearly in a lab run — but it does not tell you how the page behaves for your actual audience, on their actual devices and networks.
So pair the two. Use lab diagnosis to find the causes, because it is clean, repeatable, and detailed. Use field data — the real-world measurements collected from genuine visitors — to confirm whether the problem is widespread enough to be worth fixing and, later, whether your fix actually moved the experience for real people. A page can look mildly slow in one lab run and be perfectly fine for most visitors, or look fine in the lab and be genuinely painful on the older devices much of your audience actually uses. The lab finds the cause; the field tells you whether it matters and whether you fixed it.
Where an SEO AI agent fits
Doing this diagnosis well, once, on one page, is entirely achievable. Doing it across an entire site, and then doing it again every time something changes, is where it falls apart. Pages slow down gradually and invisibly — a new script here, a heavier image there — and nobody is running a methodical five-cause diagnosis on every page every week. Slowness is found late, usually after it has already cost you.
That continuous, methodical monitoring is what an SEO AI agent is built to do. Orova watches your site's pages for performance regressions, runs the kind of structured diagnosis described here at scale rather than one page at a time, and surfaces not just "this page got slow" but which cause is responsible — pointing you at the server, the blocking resources, the heavy image, or the script bloat. The diagnostic logic in this article does not change; the agent simply applies it tirelessly, to every page, so a regression becomes something you are told about with a cause attached, rather than something you stumble onto months later.
"The page is slow" is where a diagnosis starts, not where it ends. Identify which kind of slow, read the load timeline upstream to downstream, match the fingerprints to the five causes, rank them, and confirm against real-world data. Do that, and you will never again hand a developer a vague complaint — you will hand them a specific, prioritised problem, which is the only kind that gets fixed properly.
Run your business with AI Agents
Orova is the always-on Biz AI Agent — it plans, runs, and optimizes the work for you. Save time, unlock productivity.
Try it free