
SEO Dashboard for Leadership: Which KPIs the Boss Reads
The boss doesn't fly the plane — the boss reads the instrument panel
Imagine an airplane cockpit: hundreds of buttons, switches, dials. The pilot needs them all to fly. But if you drag that whole cockpit in front of a passenger and ask "is the flight okay?", they'll be overwhelmed — too much information, no idea where to look. What they need is just a few of the most important dials: altitude, speed, fuel. A glance at those three and they know the flight is fine, without understanding all 200 switches.
Reporting SEO to leadership is the same. The SEO person (pilot) needs dozens of metrics to operate. But the boss (the important passenger) isn't flying — they just need a few dials answering what they care about: is SEO producing business value, and is the trend good or bad. Dumping the whole "forest of numbers" on the boss is the fastest way to confuse them, lose their trust, and get the budget cut. Choosing the right few KPIs and presenting them on a clean dashboard is how you speak the boss's language.
This guide shows how to build that instrument panel: what a KPI is and why choose few-but-right, how KPIs differ from metrics, leading vs lagging indicators, the SEO KPIs to report to leadership, what a dashboard is and its layout, how to report in business language, and the build process.
What is a KPI? "Key Performance Indicator". A small set of the most important metrics reflecting whether you're hitting your goal. Unlike "measure everything", a KPI is choosing the few dials most worth watching — like altitude/speed/fuel in a cockpit.
Choose few, choose right: a few KPIs instead of a forest of numbers
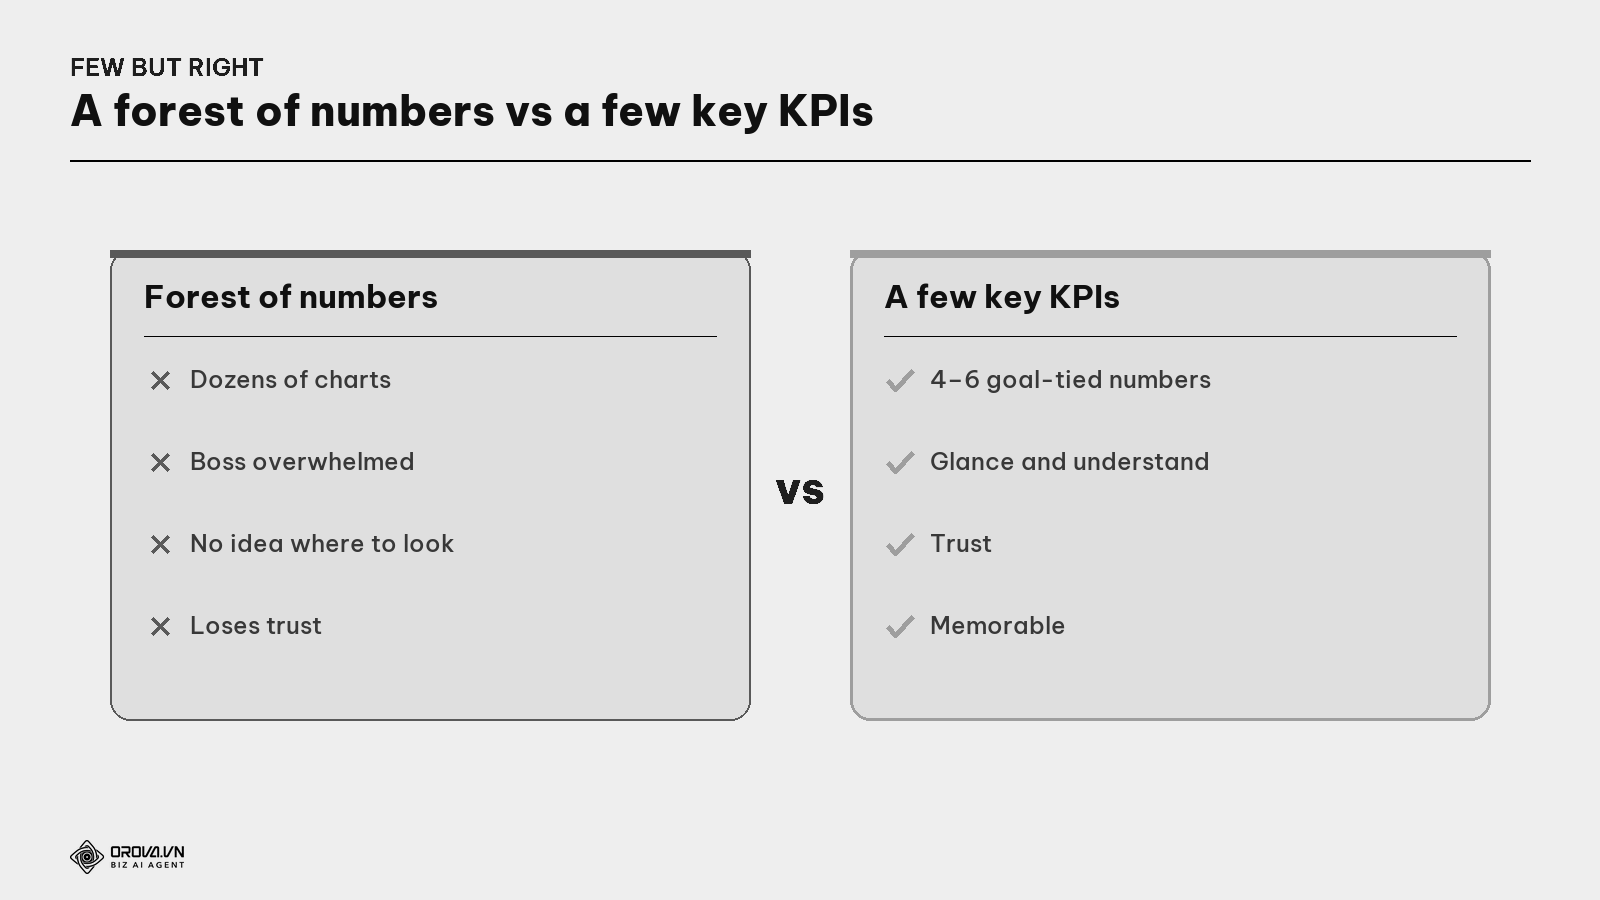
How do KPIs differ from metrics? A metric is any measurable number (views, CTR, time on site...). A KPI is the most important subset of metrics — those tied directly to a business goal. Every KPI is a metric, but not every metric deserves to be a KPI. The mistake is turning every metric into a "KPI" — then none is "key" anymore.
The rule: 4–6 KPIs are enough for a leadership report. More dilutes, and the boss can't remember them. Each KPI must answer "how does it relate to a business goal?".
Leading indicators vs lagging indicators
A good KPI set balances both — to see results already achieved and what's coming.
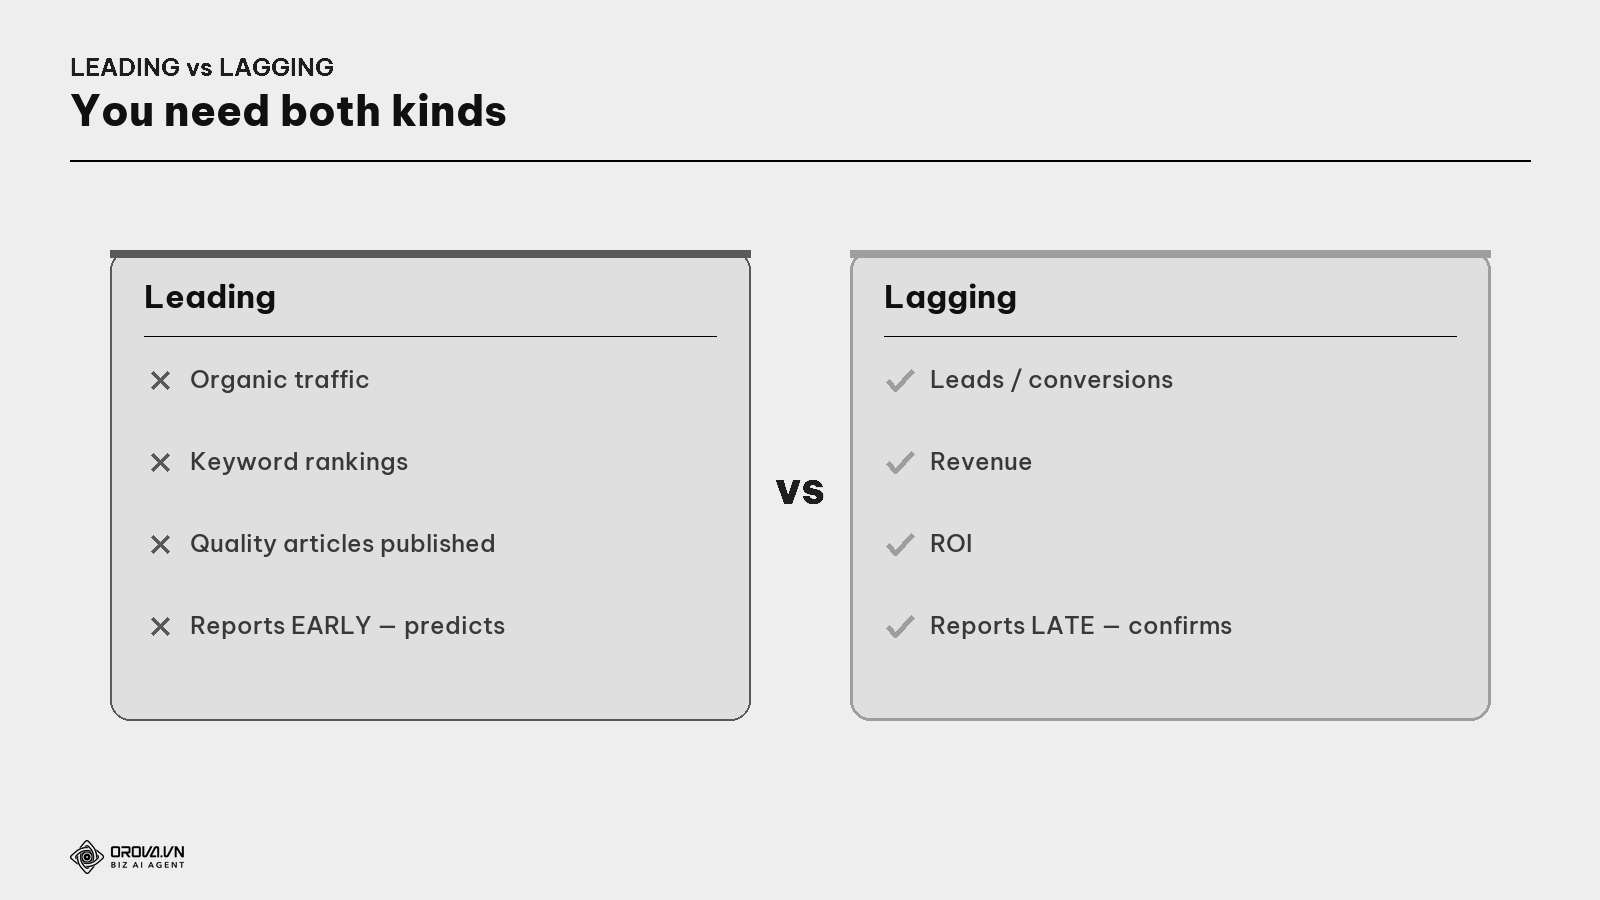
What are leading & lagging indicators? A leading indicator reports early, predicting what's coming (e.g., traffic up → leads soon up). A lagging indicator reports late, confirming what happened (e.g., revenue). Watching only lagging is always driving by the rearview mirror; watching only leading lacks proof of results. You need both.
Balance: use leading indicators to know if the direction is right (steer early), and lagging indicators to prove value (report to the boss). A dashboard of only revenue won't help you adjust in time; one of only traffic won't convince the boss.
The SEO KPIs to report to leadership
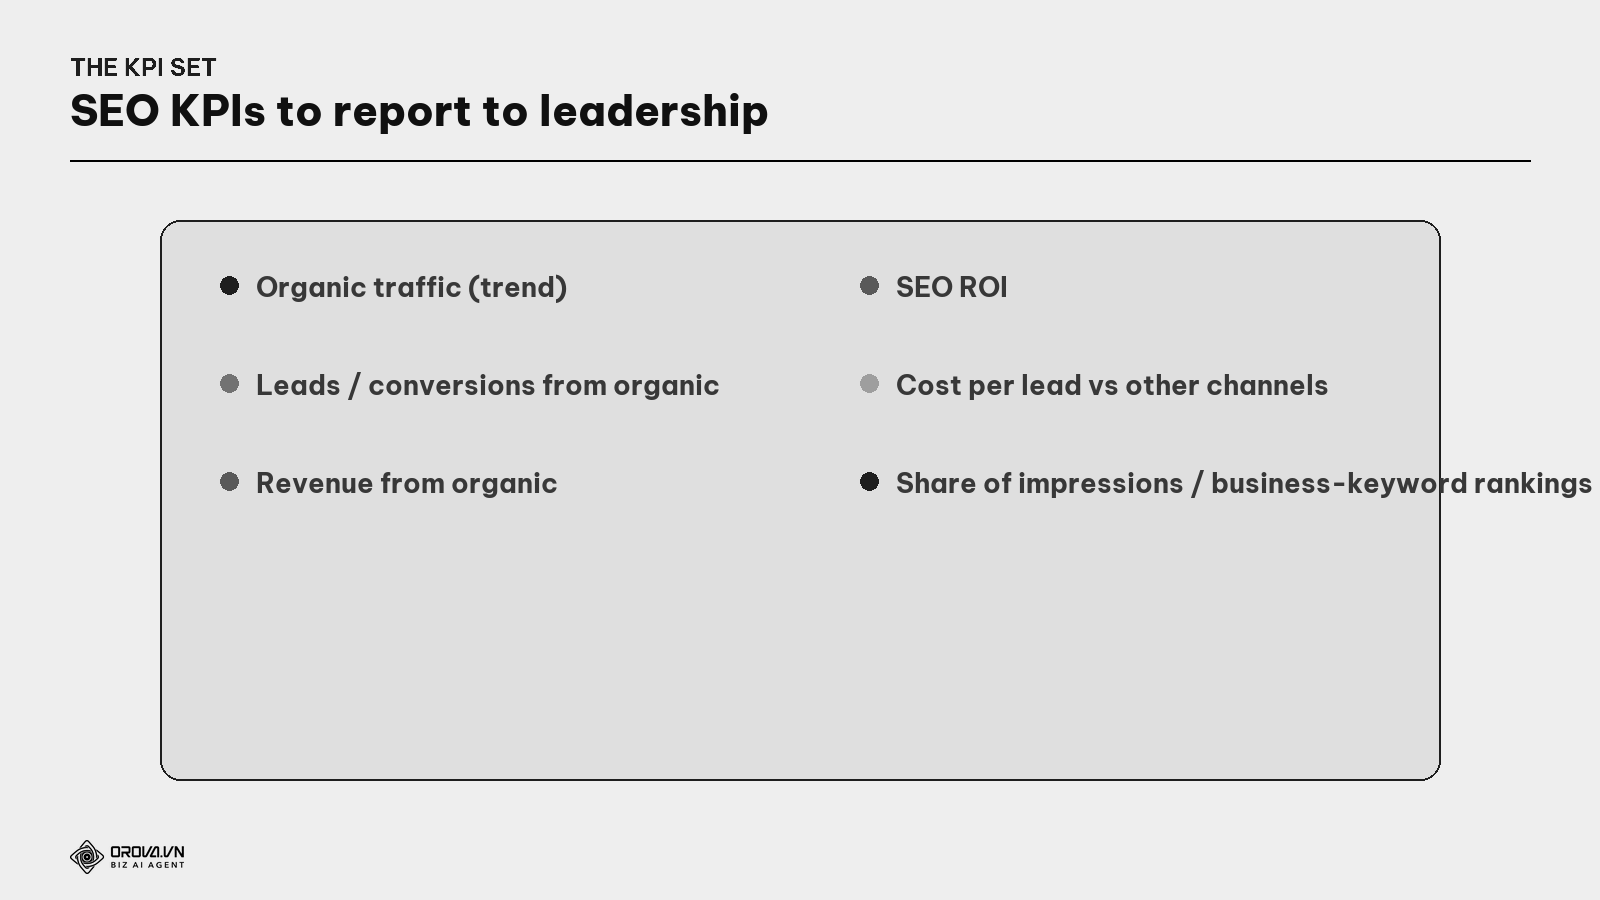
- Organic traffic by trend (leading) — overall SEO health.
- Leads/conversions from organic (near-result) — whether SEO drives valuable actions.
- Revenue from organic (lagging) — real money, the boss's language.
- SEO ROI (lagging) — for every $1 in, how much out (see the Measuring SEO & ROI guide).
- Cost per lead vs other channels — to show the boss SEO is cheaper/dearer than ads.
- Share of impressions / business-keyword rankings (leading) — position vs competitors.
Pick 4–6 of these fitting your goals, don't dump them all.
Dashboard: the one-screen instrument panel
What is a dashboard? One screen gathering the most important KPIs, presented visually (big numbers, trend charts, green/red colors) so you glance and understand. It's SEO's "instrument panel" — not making the boss read a dense table, but showing the situation at once.
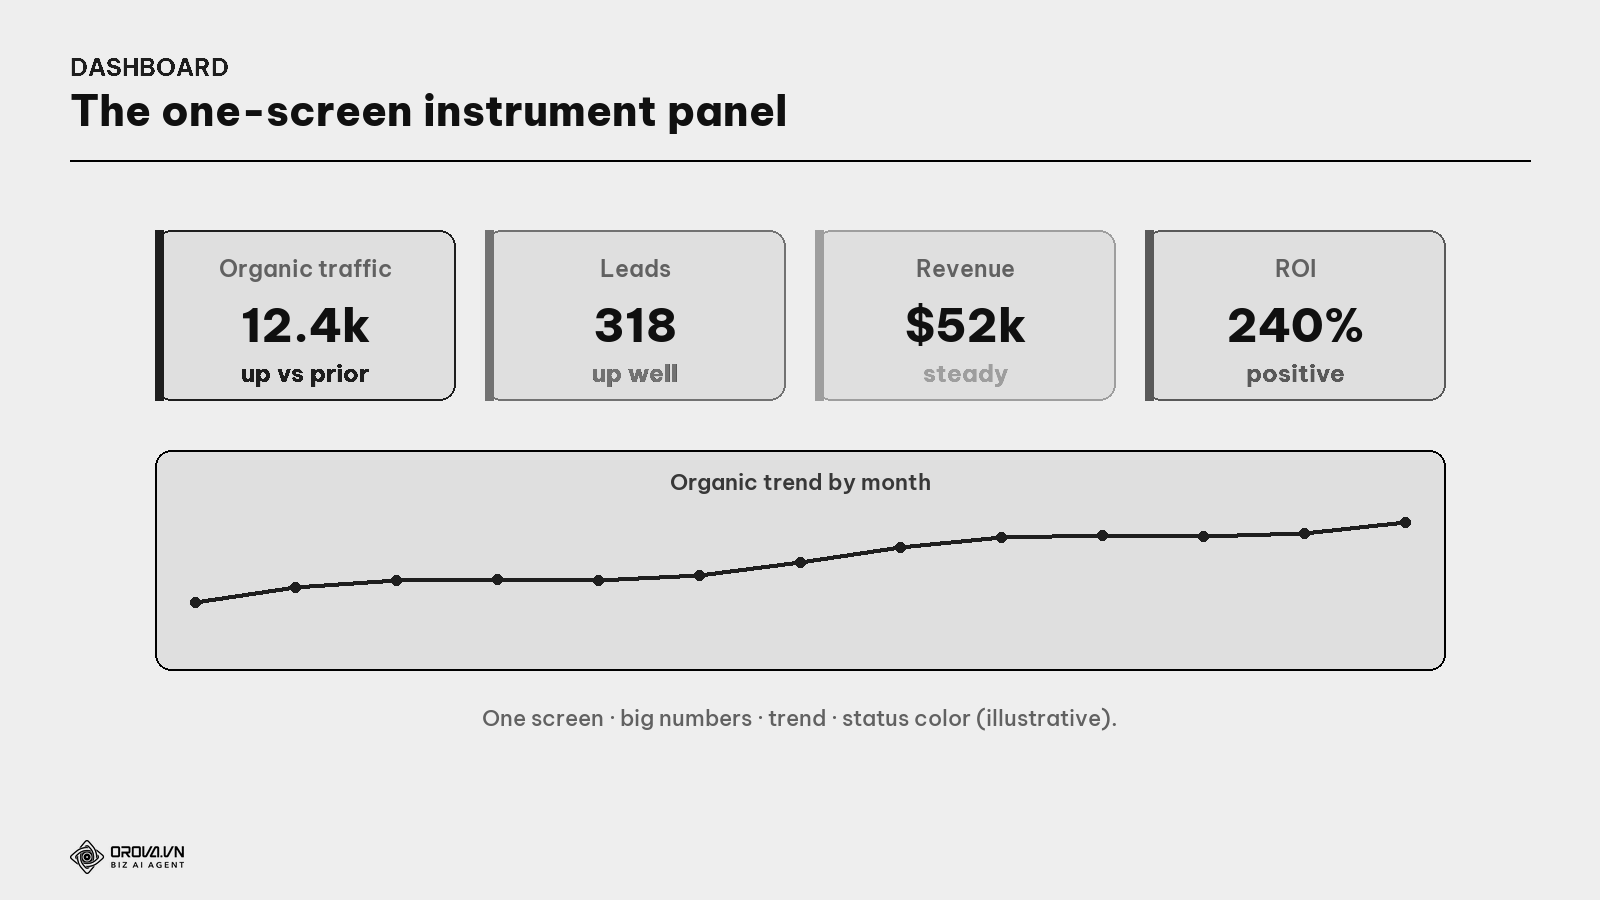
Good dashboard principles: big readable numbers; show trends (vs prior period, not just one day); use color to flag status (good/warning); and one screen — don't make them scroll forever. Common tools: Looker Studio (free, connects GA4 + GSC), or a built-in dashboard in a platform like Orova.
Reporting to leadership: speak business language
The right KPIs presented in the wrong language still fail.
Why avoid technical jargon? The boss doesn't need to know "CTR", "crawl budget", "INP". They need to know what it means for the business: more customers, cheaper, more revenue. Translate every KPI into results language — "SEO brought X leads this month, Y% cheaper than ads" — not terms. This is the spirit running through this whole guide: explain in plain language.
Reporting tips: open with results & trends (not methods), tie each KPI to a business goal, raise one decision to make (request more resources? change direction?), and keep technical detail in an appendix for those who want to dig.
The process to build a KPI dashboard
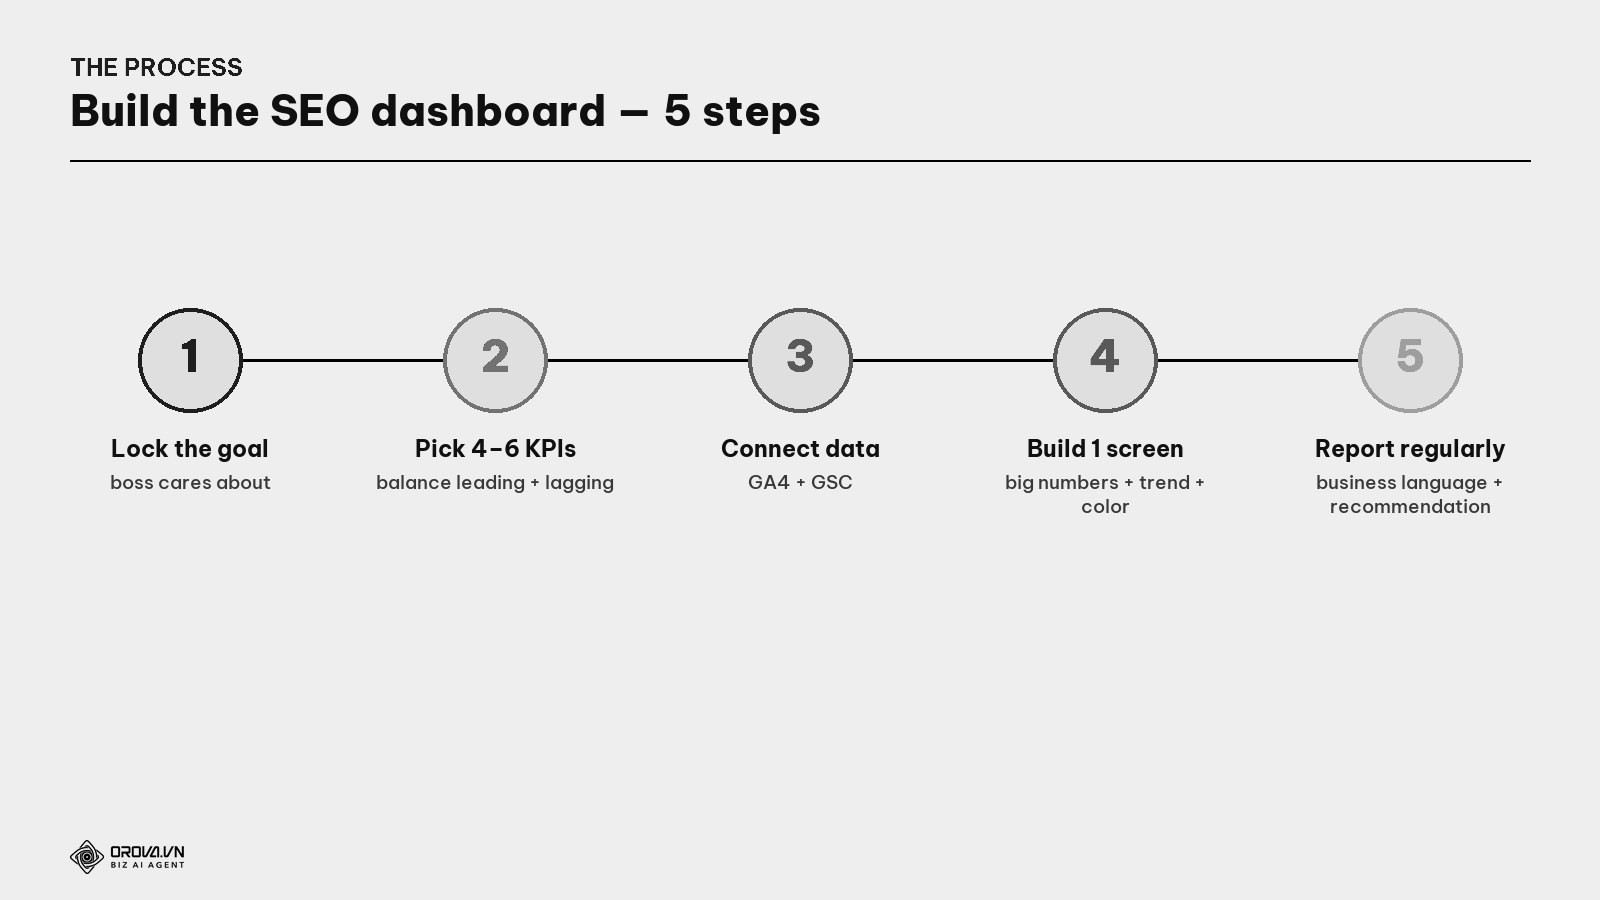
- Lock the business goal the boss truly cares about (leads? revenue? market share?).
- Pick 4–6 KPIs tied directly to the goal, balancing leading and lagging.
- Connect data sources — GA4 + Search Console (see the GA4 + GSC guide).
- Build a one-screen dashboard — big numbers, period-vs-period trends, status colors.
- Report regularly (e.g., monthly) in business language + one decision recommendation.
"Pass" standard
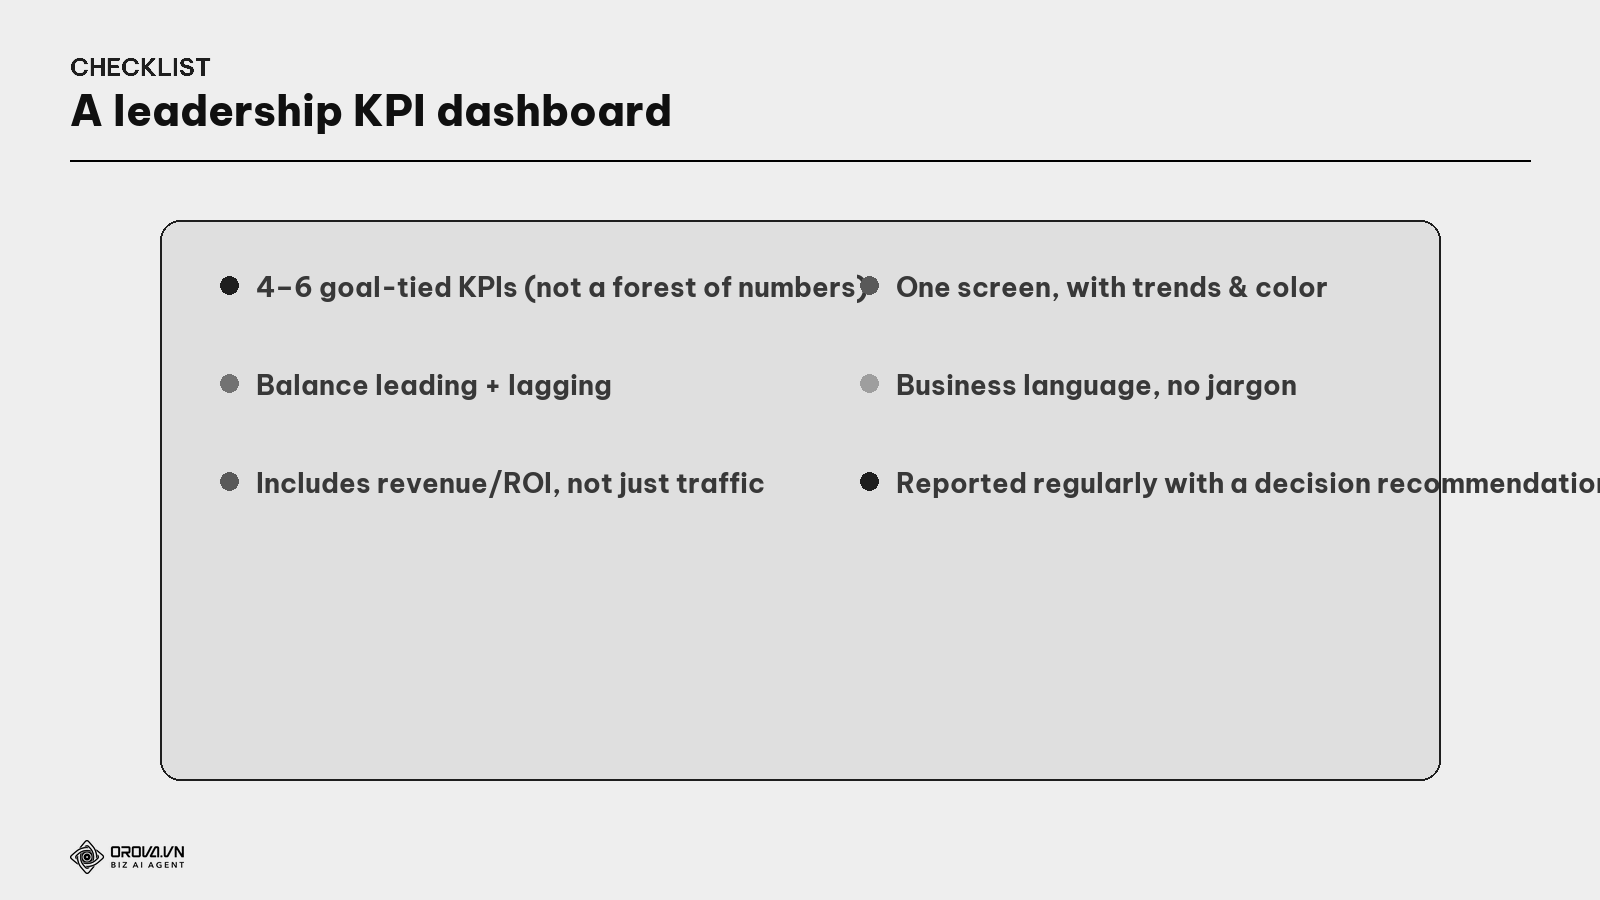
"Pass" standard: the report fits in 4–6 KPIs tied to business goals (not a forest of numbers); balances leading and lagging indicators; includes revenue/ROI, not just traffic; is presented on a one-screen dashboard with trends and status colors; uses business language without jargon; and is reported regularly with a clear decision recommendation. At this level, the boss glances and understands how SEO is producing value — and you keep both their trust and the budget.
Benefit: a good KPI dashboard does two vital things: helps you steer (the right few dials to know healthy or weak, not lost in a forest of numbers) and keeps leadership's support (the boss sees value in their language, so keeps investing). SEO is a long-term investment, easily cut when the boss can't see it "making money" — a clear instrument panel is how you both fly well and protect the resources.
FAQ
How many KPIs should an SEO report have? 4–6 goal-tied KPIs are enough for leadership. More dilutes and the boss can't remember. The SEO person can track more metrics to operate, but for reporting up, choose few-but-right.
How do KPIs differ from metrics? A metric is any measurable number; a KPI is the most important subset tied to a goal. Every KPI is a metric, but not every metric deserves to be a KPI — making everything a "KPI" leaves none key.
Should I report leading or lagging indicators? Both. Lagging indicators (revenue, ROI) prove value to the boss; leading indicators (traffic, rankings) help you steer early and predict. Only lagging is driving by the rearview mirror; only leading lacks proof.
What tool do I use to build a dashboard? Most common is Looker Studio (free, connects directly to GA4 + Search Console). Many SEO platforms also have built-in dashboards. What matters isn't the tool but choosing the right KPIs and an easy one-screen presentation.
How often should I report to leadership? Usually monthly — enough to see trends without getting lost in daily swings. The dashboard can auto-update continuously, but the report with interpretation + recommendation should follow a monthly (or quarterly for higher levels) rhythm.
How do I report when SEO has no revenue yet? Emphasize improving leading indicators (right-audience traffic, business-keyword rankings, rising leads) + trend projection + cost-per-lead vs paid channels. Show the boss "the dial is moving the right way" and the path to revenue.
The boss asks for a metric not on the dashboard — what now? Good — note it and answer in an appendix/next session. But don't cram more KPIs into the main dashboard; keep it lean at 4–6 key numbers. Save detail for those who want to dig, don't bury the big picture.
Back to the instrument panel
Remember the passenger overwhelmed by a 200-switch cockpit? All they needed was a few dials — altitude, speed, fuel — to know the flight was fine. The pilot needs them all; the passenger needs few-but-right.
Reporting SEO to leadership is the same. Don't dump the operational "forest of numbers" on the boss — they'll be overwhelmed, lose trust, then cut the budget. Choose a few key KPIs tied straight to business goals, put them on a glance-and-understand instrument panel, and speak the boss's language: leads, revenue, ROI. Then the boss looks at three dials and is reassured SEO is flying the right way — and you both steer better and keep the resources to fly on. The cockpit is yours; the instrument panel is the boss's.
This article is part of Orova's complete SEO guide series. It's a deep-dive within the cluster — see "Measuring SEO & ROI", "GA4 + Google Search Console", and "SEO Attribution" for the full picture. Get started with Orova at orova.vn/en/seo.
Sources
Looker Studio Help (building dashboards, connecting GA4 + GSC) · common marketing KPI frameworks (leading/lagging, KPI vs metric) · Search Engine Journal & CMI (reporting SEO to leadership).
Read next: Vanity Metrics in SEO: Which Ones to Stop Reporting
Build your reporting with Orova Insight
Pull data from every platform into one dashboard. Ask in plain language and let the AI draw the chart.
Explore Orova Insight