
Google Core Web Vitals Test: Check Your LCP, INP & CLS Score

You have probably run a Google Core Web Vitals test on your site and stared at a screen full of letters and numbers that mean almost nothing to you. LCP, INP, CLS, red bars, green bars — and no clear answer to the one question you actually care about: is my website driving customers away? You just know that sometimes your site feels slow, and you suspect it might be costing you sales, but the report itself reads like it was written for someone else.
The usual approach is to hand the report to a developer and hope they explain it in plain terms, or to ignore it entirely and hope for the best. Both are risky: developers often explain the fix, not the business impact, and ignoring the problem means slow pages keep quietly pushing visitors away before they even see what you sell. With SparkToro reporting that 68% of US Google searches in early 2026 already ended without a click, the visitors who do land on your site are increasingly precious, and a slow, clunky experience is the fastest way to lose them for good. Either way, you end up guessing instead of knowing what is actually wrong.
This article walks you through what those three numbers really mean, using a simple restaurant story instead of technical jargon, so you can look at your own test results and immediately understand whether your site is fine, borderline, or in trouble. By the end, you will know what "good," "needs improvement," and "poor" actually look like, and what kind of fixes move a score from one category to the next.
The restaurant that makes you wait an hour for your food
Imagine you walk into a restaurant. You sit, order — then wait. Ten minutes, twenty, still no main course. You ring for a waiter, no one comes. When the food finally arrives, the table gets bumped and the dipping sauce spills on your sleeve. However good the food, you're already annoyed and swear never to return. The problem isn't the food — it's the service experience.
A slow website gives users exactly that feeling: waiting forever for content to appear, tapping a button that doesn't respond, the layout jumping around mid-read so you tap the wrong thing. Google measures these three annoyances precisely with three numbers called Core Web Vitals — and uses them as a ranking factor. "Smooth" pages are rewarded; "annoying" pages suffer, and lose customers too.
This guide decodes those three numbers in plain language: what Core Web Vitals are, what LCP–INP–CLS measure (told through the restaurant story), which thresholds pass, how to measure with lab data and real-user data, and how to improve each metric.
What are Core Web Vitals? Google's three metrics measuring a page's real speed experience for users: does the main content load fast, do taps respond fast, and is the layout stable. It's the measurable part of "Page Experience", and a ranking factor.
Three numbers — told through the restaurant
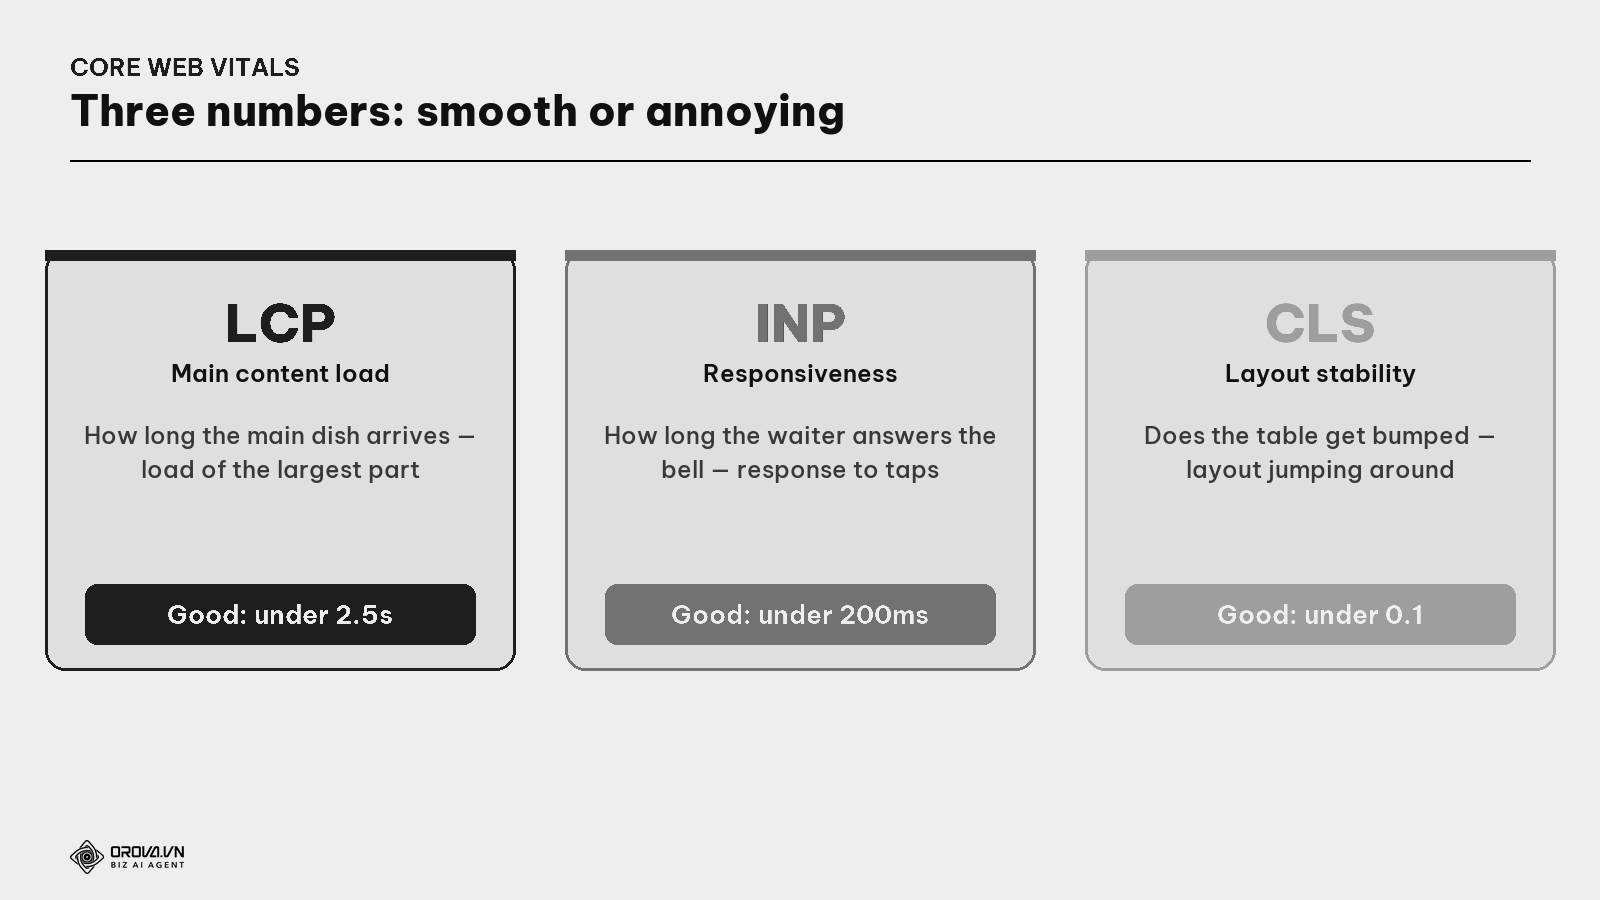
LCP — Largest Contentful Paint (main content load).
What is LCP? Measures how long until the largest content (usually the cover image or heading) appears. Like "how long until the main dish reaches the table". Good threshold: under 2.5 seconds.
INP — Interaction to Next Paint (responsiveness).
What is INP? Measures how fast the page responds when a user taps/clicks — how long until you see a result. Like "how long after ringing the bell the waiter answers". Good threshold: under 200 milliseconds. (INP replaced the old FID metric in 2024.)
CLS — Cumulative Layout Shift (layout stability).
What is CLS? Measures whether the layout jumps around as the page loads — when you go to tap a button and it shifts so you tap the wrong thing. Like "the table getting bumped while you eat". Good threshold: under 0.1.
Three numbers, three different annoyances: waiting long (LCP), taps not snappy (INP), jumping around (CLS). Passing all three means the page is fast, responsive, and stable.
Why these three numbers are worth your attention
Not just because Google grades them. Speed affects money directly.
What is Page Experience? How Google evaluates the overall feel of using a page — Core Web Vitals + HTTPS + mobile-friendliness. Google uses it as a ranking factor, especially as a tiebreaker when two pages are equal on content.
- A ranking factor. With equal content, Google favors the better-experience page.
- Affects bounce. Users abandon slow pages fast — every extra second of waiting loses more people.
- Affects conversion. Fast pages keep people longer and sell more; slow pages drop orders right before the finish line.
- Most critical on mobile. Most users arrive on phones, where weaker networks make heavy pages crawl.
In other words: optimizing Core Web Vitals both lifts rankings and retains customers — one arrow, two targets.
How to measure: lab data and real-user data
There are two ways to measure, and you need to know the difference to read them right.
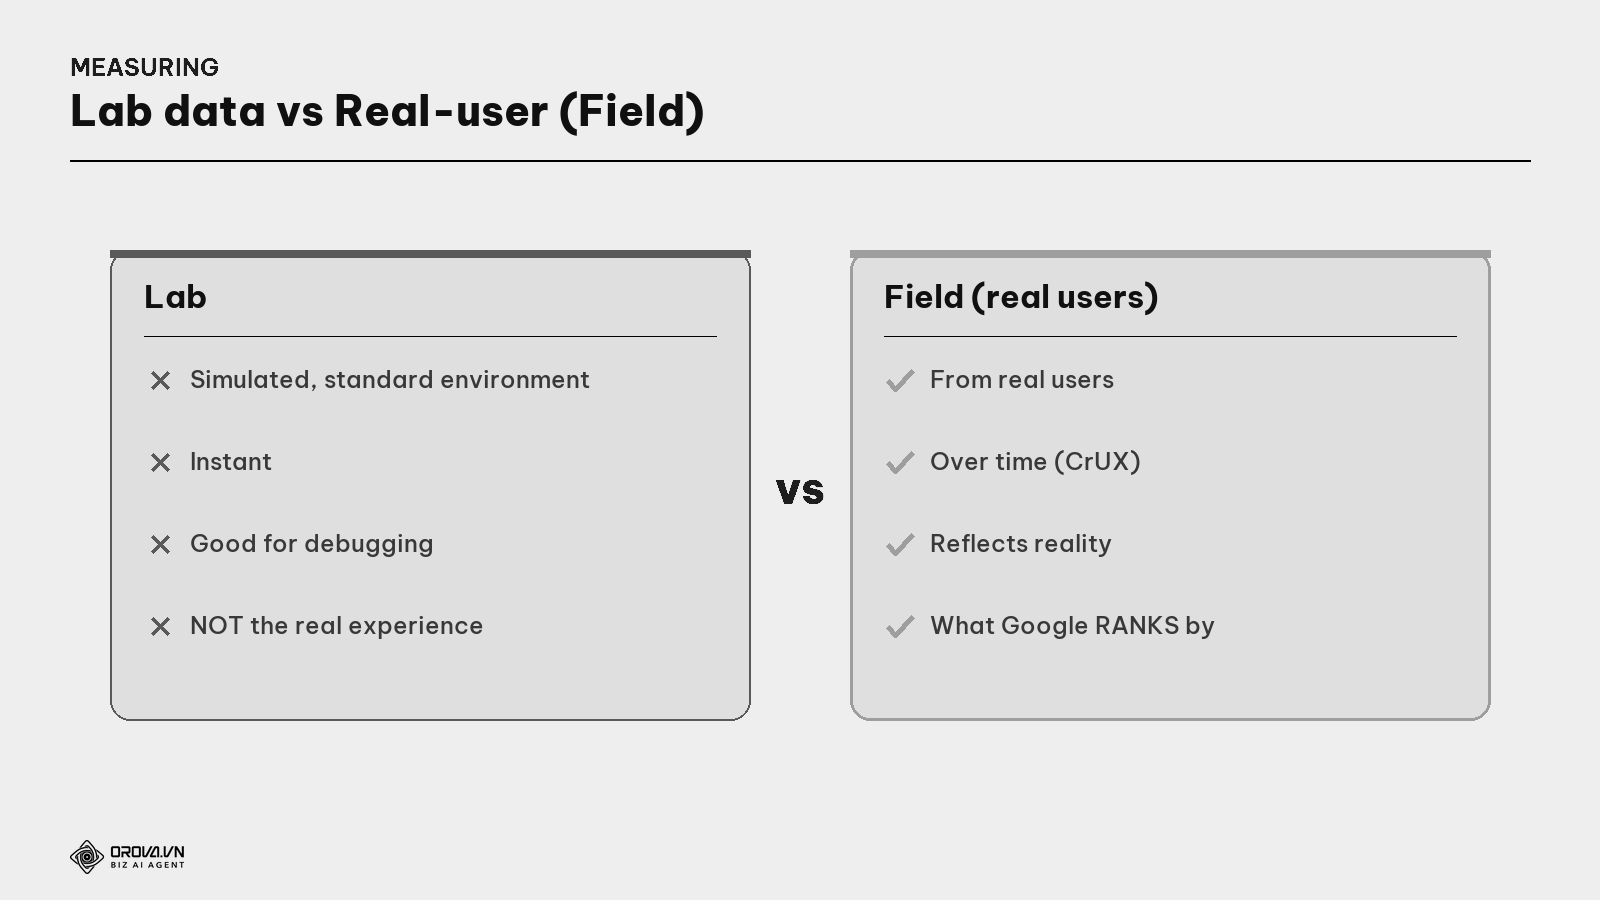
What is lab data? A simulated measurement of a page in a standard environment (e.g., Lighthouse/PageSpeed tools). Instant, good for debugging — but a lab condition, not real users.
What is field data (CrUX)? Measurement from real users visiting your page (Google collects it via the Chrome User Experience Report). This is the number Google uses to rank, because it reflects real experience across all devices and networks.
The most practical tools: PageSpeed Insights (free) gives both kinds, and Google Search Console has a Core Web Vitals report aggregated from your whole site's real-user data.
Thresholds: Good / Needs improvement / Poor
Google splits each metric into three bands. The goal is "Good" on all three.
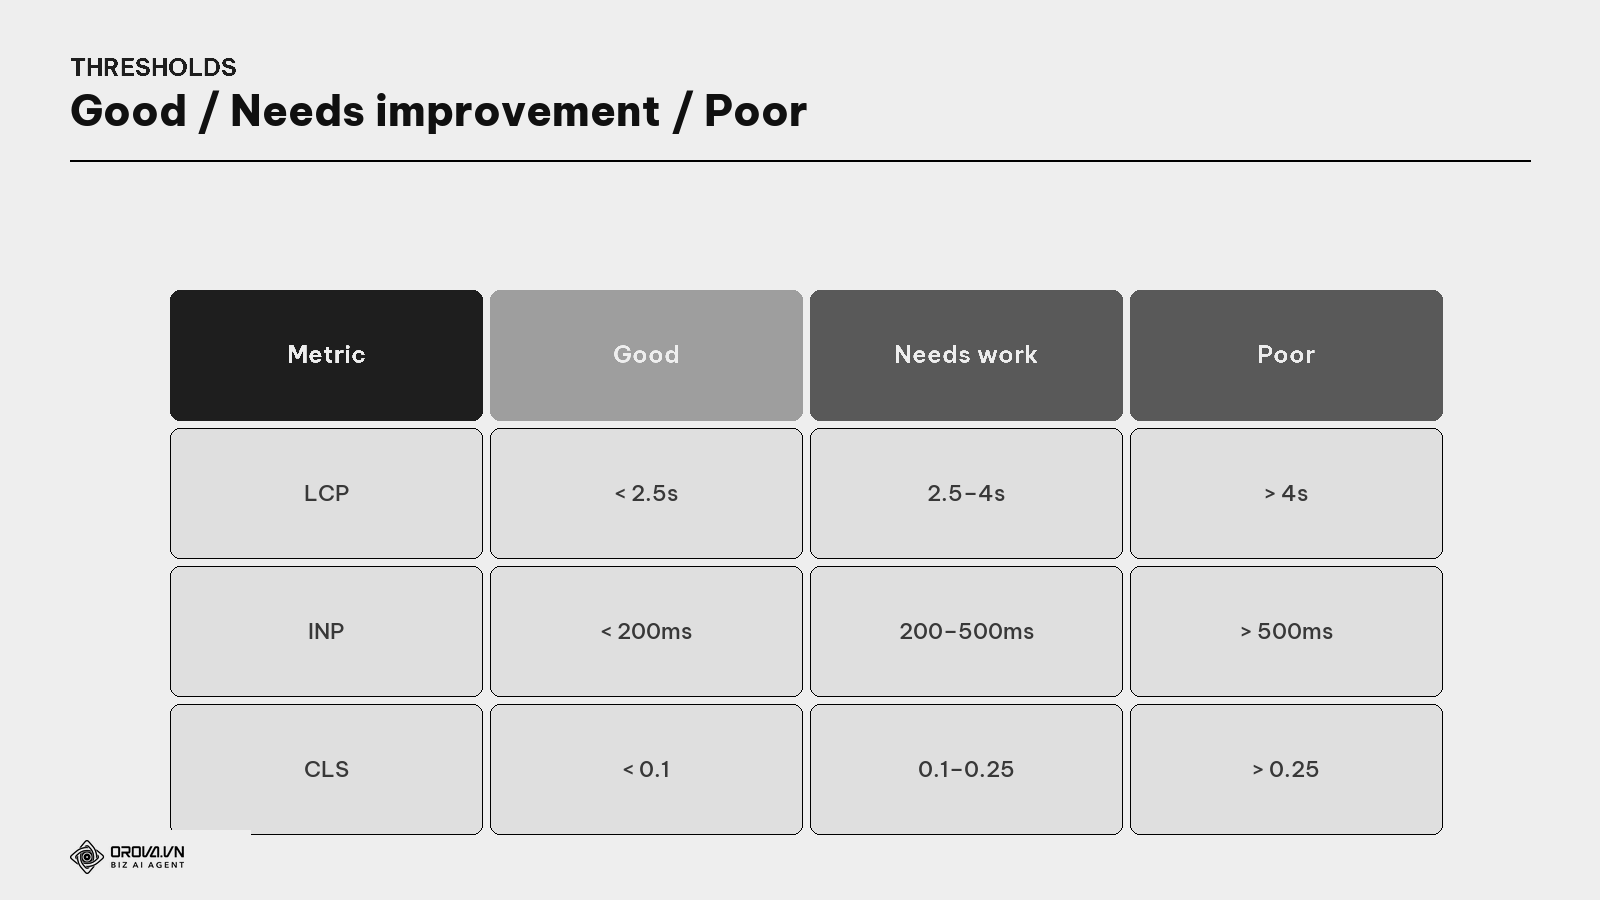
A page is counted as "passing Core Web Vitals" when all three metrics are Good (measured on real-user data). Just one metric falling to "Poor" is enough for the experience to lose customers.
How to improve each metric
Each weak metric has its own causes and fixes.
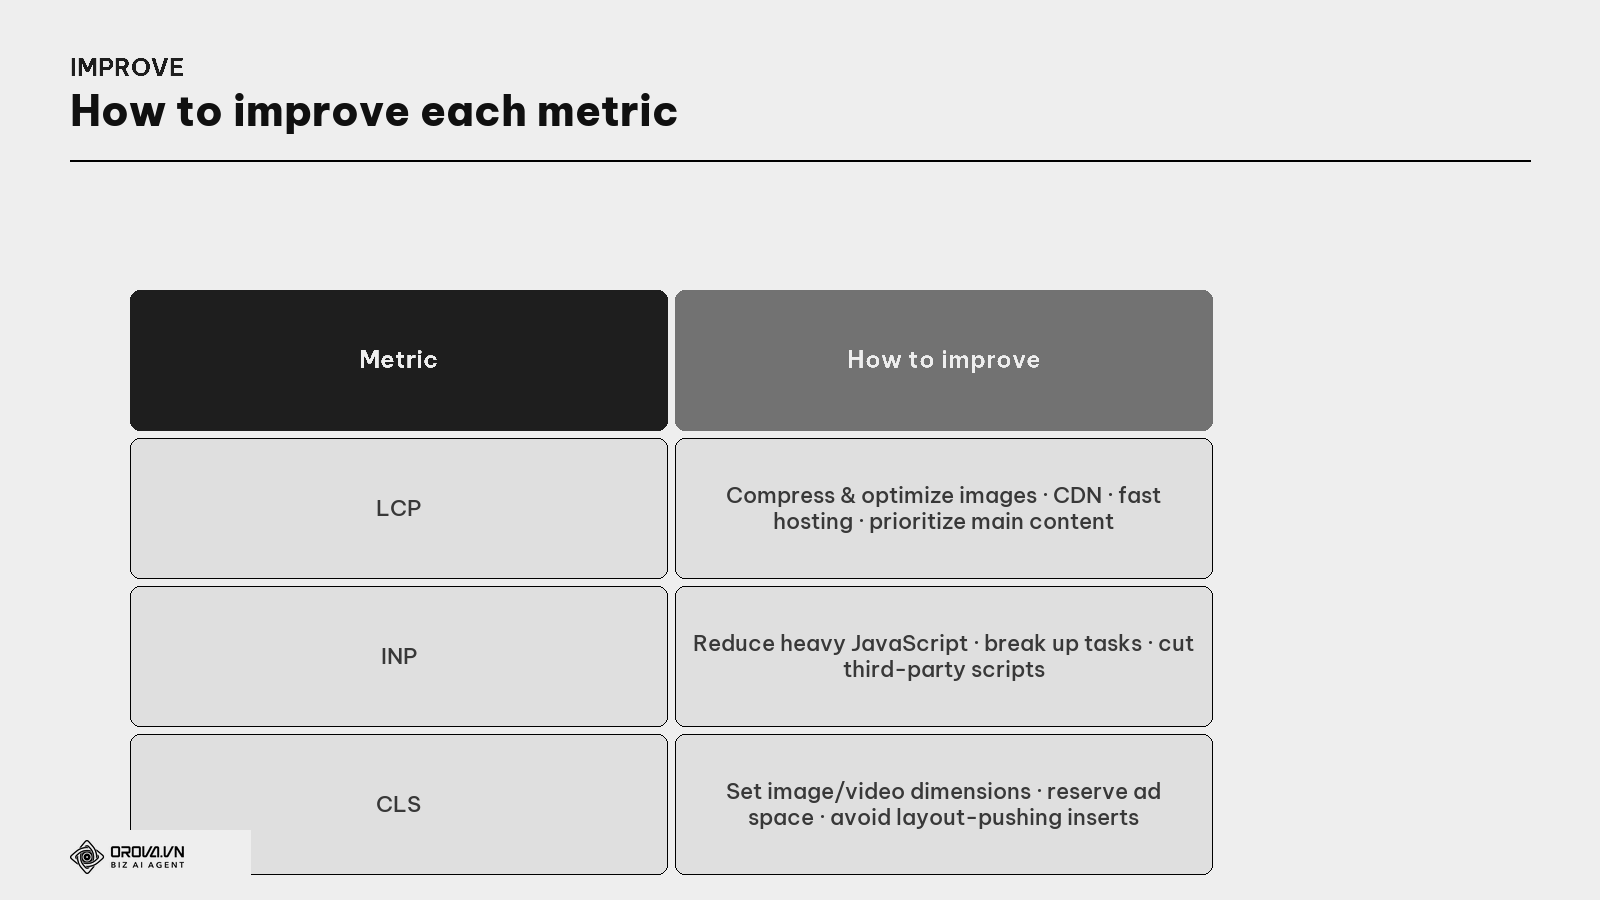
- Improve LCP (load faster): compress & optimize images (light formats like WebP), use a CDN, choose fast hosting, prioritize loading the main content first.
What is a CDN? A "content delivery network" — servers placed worldwide that serve the page from the one closest to the user, so it loads faster. Like opening many branches so customers don't travel far.
- Improve INP (snappier taps): reduce heavy JavaScript, break up tasks so the page doesn't "freeze", cut third-party scripts (widgets, ads).
What is JavaScript? The code that makes a page "dynamic" (buttons, effects, content loaded on demand). Too much heavy JavaScript keeps the browser busy, making the page slow to respond to taps — the most common cause of poor INP.
- Improve CLS (stable layout): set dimensions for images/videos (so the browser reserves space), reserve space for ads, don't inject content that pushes what's being read.
The speed-optimization process
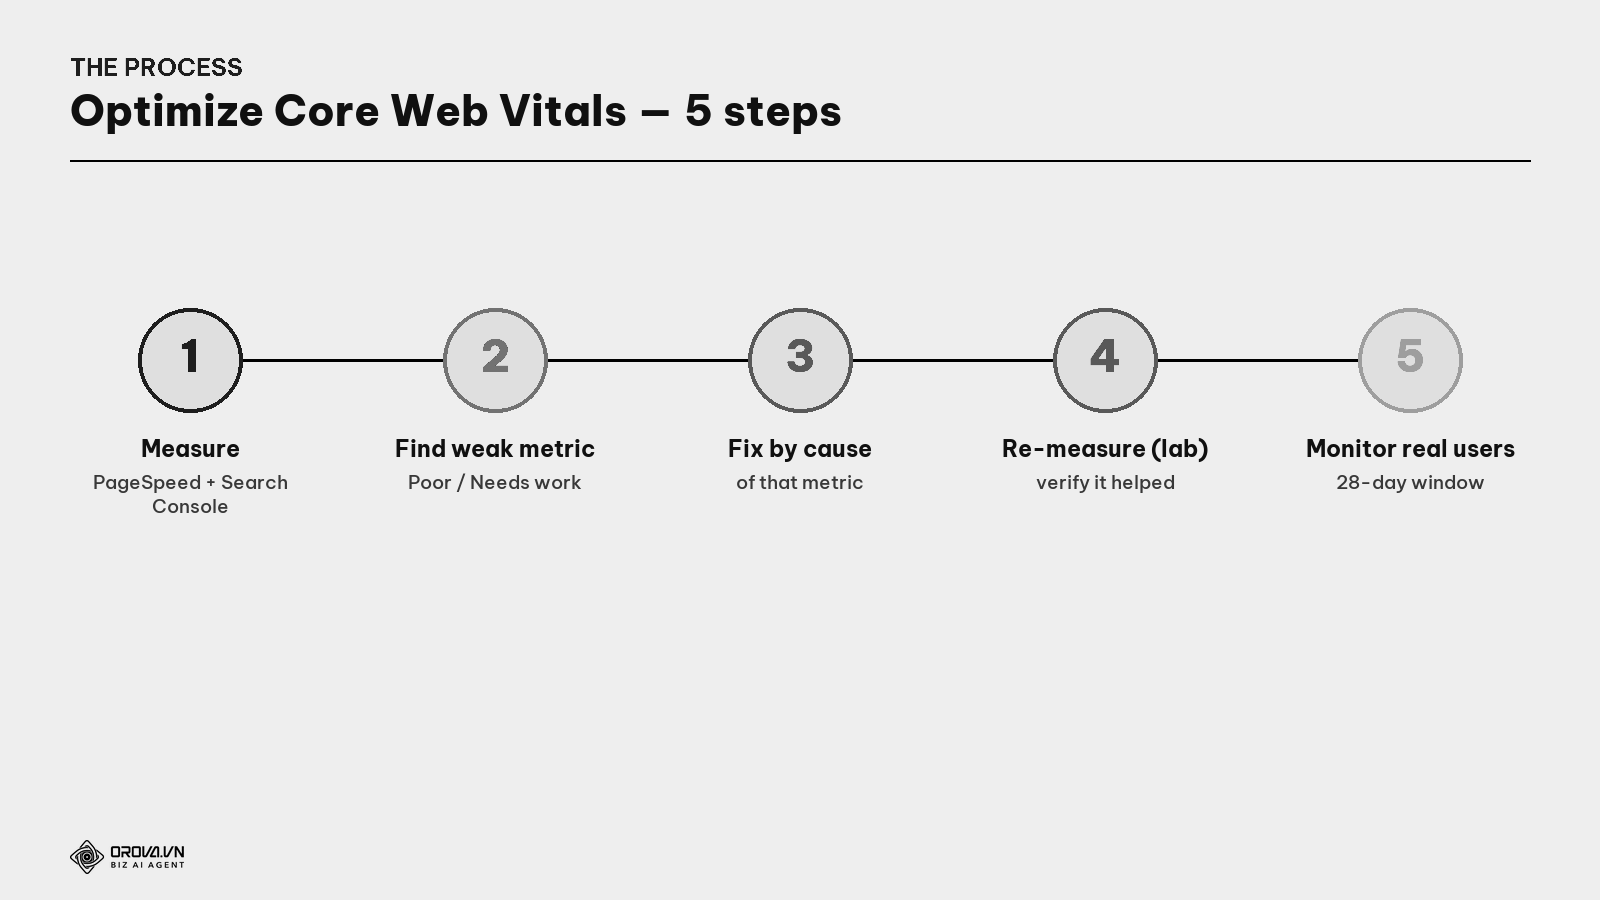
- Measure with PageSpeed Insights (one page) and Search Console (whole site, real-user data).
- Find the weak metric — which is Poor/Needs improvement, on which page template.
- Fix by the cause of that specific metric (see the table above).
- Re-measure with lab to confirm it improved.
- Monitor real-user data — field data updates over a 28-day window, so wait a few weeks for the ranking score to reflect it.
What is the 28-day window? The real-user (field) data Google uses is averaged over the last 28 days. So after a fix, don't be impatient — it takes a few weeks for new numbers to "settle" into the report and the ranking score.
"Pass" standard
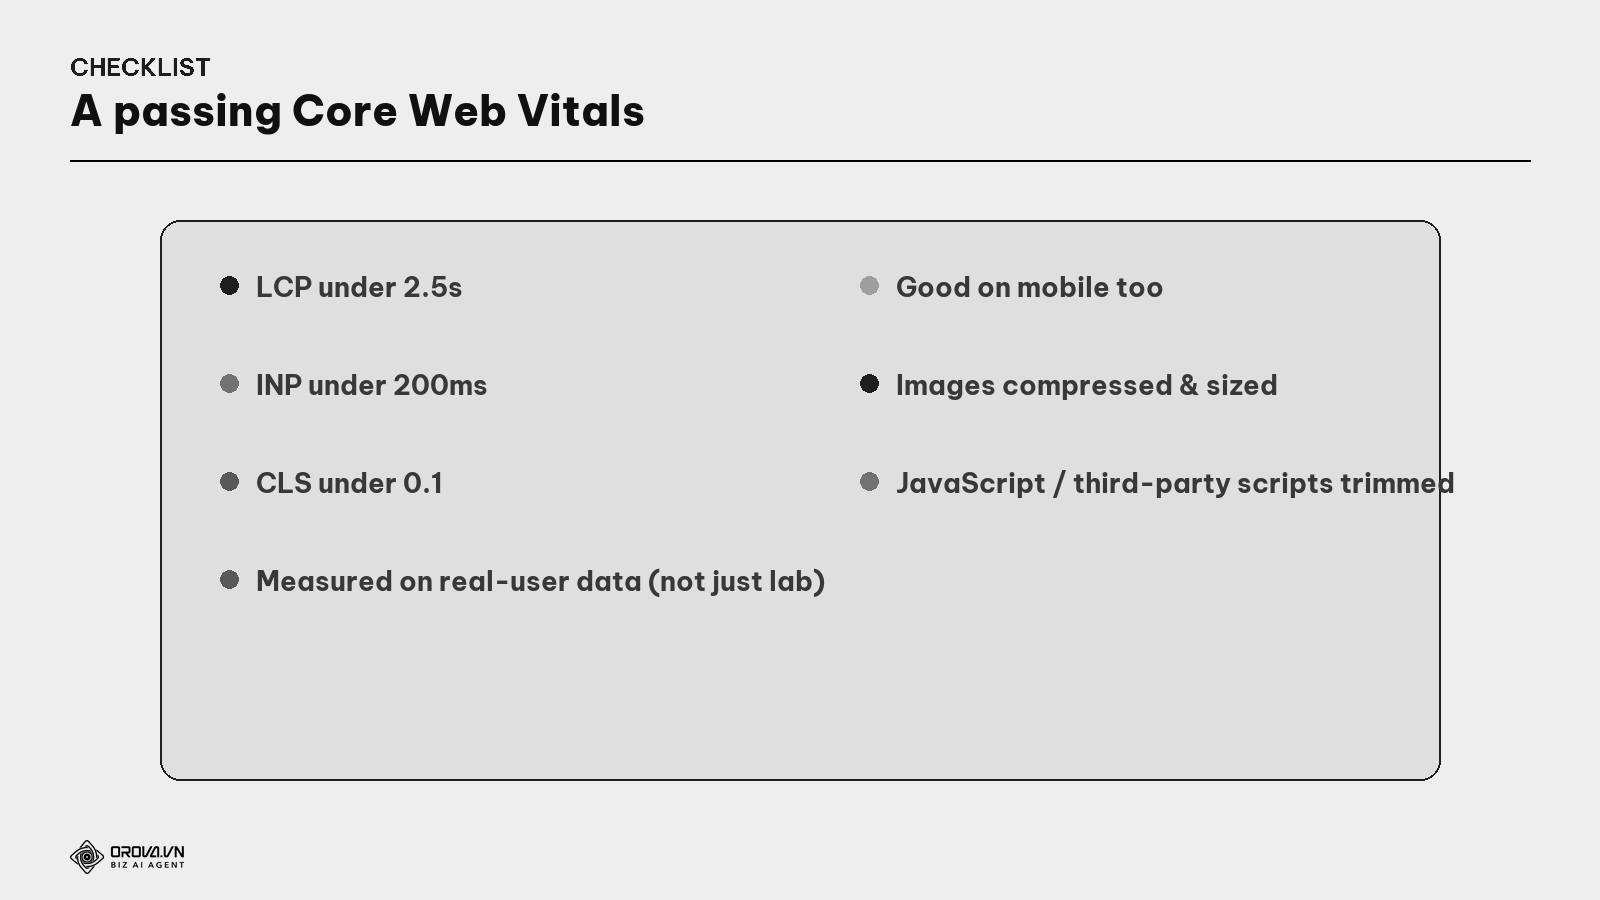
"Pass" standard: all three metrics are Good on real-user data (LCP < 2.5s, INP < 200ms, CLS < 0.1), especially on mobile; images compressed and pre-sized; JavaScript/third-party scripts kept in check; and you monitor the Search Console report regularly. At this level, your page is fast – responsive – stable: users stay longer, buy more, and Google has one more reason to rank you higher.
Benefit: optimizing Core Web Vitals is an investment hitting two targets: Google rewards rankings, and you retain and convert customers better. It's the "double-reward" part of technical SEO — unlike many technical jobs that only avoid penalties, good speed delivers visible benefits in both ranking and revenue.
FAQ
Are Core Web Vitals a strong ranking factor? A ranking factor, but light compared to content and relevance. Don't expect speed optimization to lift you from page 3 to the top if the content is weak. It's a "tiebreaker" when pages are equal — and important for conversion regardless of ranking.
Do I need a 100/100 PageSpeed score? No need for a perfect 100. The goal is passing the Good threshold on all three metrics on real-user data. A pretty lab score of 100 looks nice, but Google counts real-user experience, so don't obsess over the lab number.
Why is my lab score good but Search Console says poor? Because they're different data: lab is an ideal simulation, field is real users across all devices/networks. Search Console uses field. Prioritize improving by real-user data.
How does INP differ from the old FID? INP measures the responsiveness of every interaction throughout the session (more comprehensive), while the old FID only measured the first interaction. Since 2024, INP replaced FID as the official metric.
How long after fixing until I see improvement? The lab score improves right after a fix. But field data — what Google uses — averages over 28 days, so it takes a few weeks for the report and ranking score to reflect it.
I'm not a developer — how do I improve speed? Many "low-hanging fruit" need no coding: compress images before uploading, set image dimensions, remove unneeded heavy plugins/widgets, pick good hosting/CDN. Deeper work (reducing JavaScript) needs a developer — but PageSpeed Insights will point out exactly what to fix.
Does a slow page drop my ranking immediately? Not a sudden drop like a penalty, but a gradual disadvantage: losing customers to bounce, and losing ground to faster competitors. The conversion impact is usually felt before the ranking impact.
Back to the restaurant that makes you wait
Remember the restaurant that made you wait, ignored your bell, and bumped your table? The food might be good, but the bad service experience was enough to keep you from returning. Customers don't grade the food alone — they grade the whole feel of being served.
Your website gets "graded" the same way. Good content is the tasty food; but if the page loads slowly (LCP), taps don't respond (INP), the layout jumps around (CLS), users still get annoyed and leave — and Google notes it. Make your "restaurant" serve smoothly: dishes out fast, bell answered at once, table held steady. The three Core Web Vitals are the mirror reflecting that experience — pass all three, and you both keep customers and give Google one more reason to seat you at the front table.
This article is part of Orova's complete SEO guide series. It's a deep-dive within the cluster — see "Technical SEO", "Site Architecture & URL", and "GA4 + Search Console" for the full picture. Get started with Orova at orova.vn/en/seo.
Sources
Google web.dev (Core Web Vitals: LCP, INP, CLS & thresholds) · Google Search Central (Page Experience as a ranking factor) · Chrome User Experience Report (CrUX — field data) · PageSpeed Insights Help.
Stop guessing, start fixing
Reading a Core Web Vitals test is only step one. The real work — finding exactly which images, scripts, or layout choices are dragging your scores down, then fixing them one by one and re-testing — is where most business owners get stuck. Doing this manually means digging through technical reports, learning tools built for developers, and repeating the process every time you make a change to your site.
This is exactly the kind of repetitive, technical work that Orova SEO is built to handle automatically, running the checks, flagging the real problems in plain language, and tracking your progress over time so you are not doing it by hand every month. If you would rather spend your time running your business than decoding performance reports, it is worth taking a look.
Let Orova SEO handle the repetitive part
Keyword research, drafting, refreshing old posts and rank tracking — running automatically on your own site.
Explore Orova SEO