
AI chart builder
Describe what you want to see, and Orova creates a matching widget from your existing data.
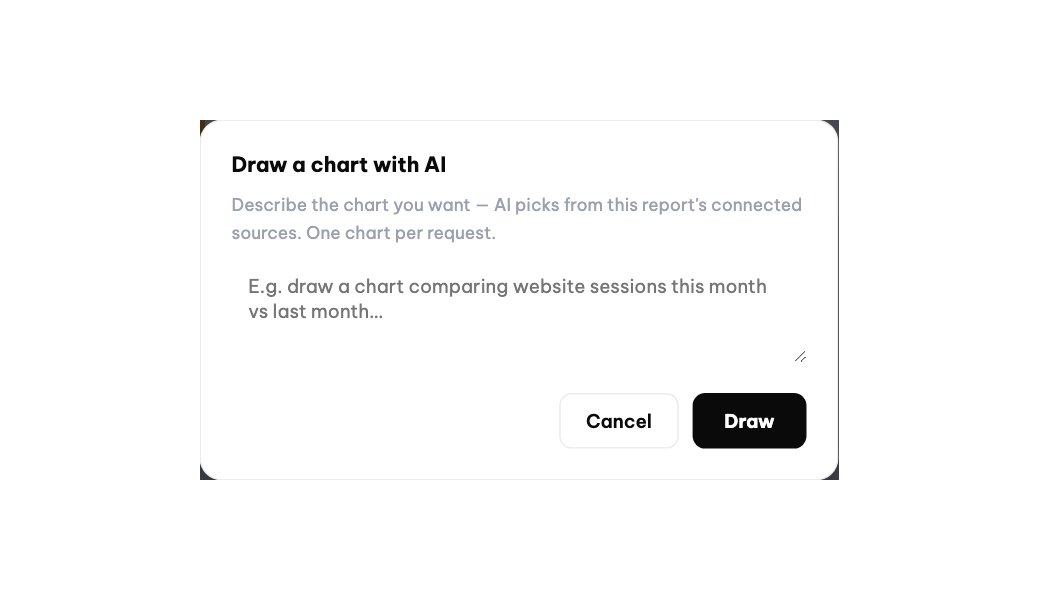
“Compare ad spend and conversions by month.”
AI uses the data in your report to build the right visualization.
Orova Insight connects data from multiple platforms, turns it into visual reports and lets you track every metric in one place.
Combine website, advertising, social media and your own business data. Design reports with a drag-and-drop builder, or let AI analyze and visualize the data for you.
Free until July 7, 2027 · No credit card
Every platform has its own interface and its own reports.
To see the full picture of your marketing, you open one tool after another, export the data, stitch it together, and only then build a complete report.
Orova Insight brings all of those sources into a single reporting workspace.
Pick the data you need, design reports your way and share them with the people who follow the numbers.
Explore Orova InsightOrova Insight supports 16 data sources, from popular marketing platforms to your own business data.
Platform connections are read-only. Nothing is changed in your source accounts.
Don't just collect data. Combine it into a complete report.
Design reports on a free-form canvas.
Drag in components, arrange the layout, add pages and fine-tune how everything is displayed.
Reports use a 16:9 format with guides and alignment tools, plus edit history so you can make changes or roll back to an earlier version.
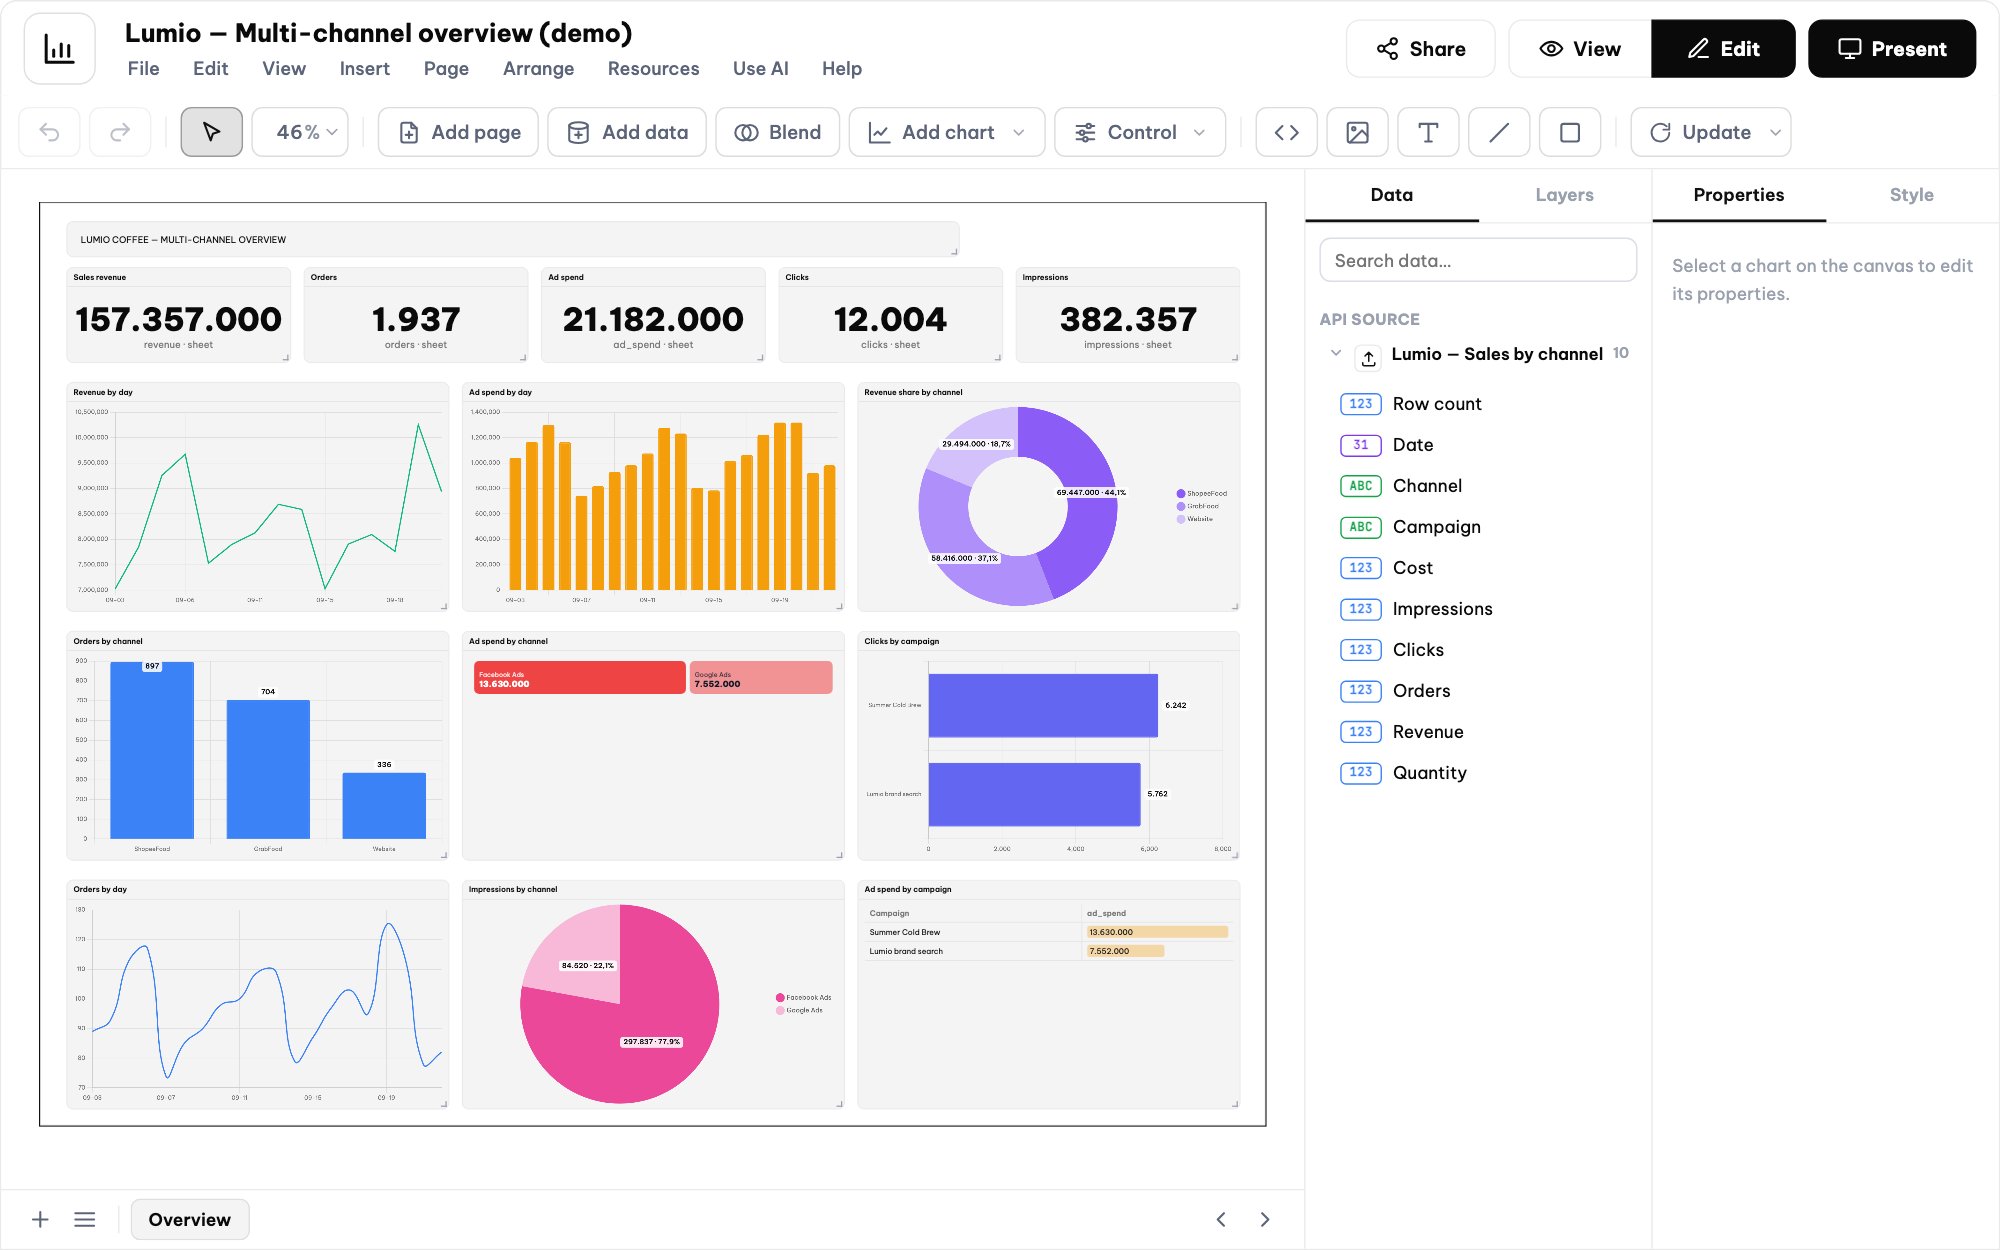
From familiar charts to advanced visualizations:
Beyond charts, you can add text, images, lines, frames and filters.
Mix components on the same page to build exactly the report your business needs.
A report rarely relies on a single source.
Orova lets you blend data from several sources and create calculated fields right inside the report builder.
Build your own metrics with basic math: add, subtract, multiply and divide.
Custom metrics go further, letting you write your own formulas from the available data variables.
Connect Google Sheets and let Orova read the data directly.
Works with different sheet layouts:
Orova can recognize multi-level headers and horizontally laid-out tables and bring them into your report.
A single tab
One tab per month
All tabs
If your data isn't in one of the built-in sources, Orova supports a custom API.
Push JSON data through a webhook, or let Orova pull it from an endpoint on a schedule.
Ideal for internal systems or private data that belongs in the same marketing report.
POST /hooks/insight/{slug}/{key}Content-Type: application/json{"date": "…","source": "…","campaign": "…","metric": "…","value": 0}
Refresh data on demand with the Update button, or set up automatic sync.
Choose a sync interval:
Need the latest numbers? Refresh any individual chart.
No more re-importing data by hand every time you build a report.
You don't always have to pick every chart type yourself.
Describe what you want to see, and Orova creates a matching widget from your existing data.
“Compare ad spend and conversions by month.”
AI uses the data in your report to build the right visualization.
Ask questions about your data and have AI explain what's going on.
Use the assistant to:
AI makes your data easier to work with, without combing through every table yourself.
Orova saves your report automatically as you edit.
Version history keeps up to 100 versions, so you can:
Edit freely without worrying about losing the version your team relies on.
Once a report is shared, viewers get the new layout and data automatically. No need to send another file.
Ideal for reports used regularly by Marketing, Sales, Management and other teams.

Set a delivery schedule:
Choose the time zone and the date range to summarize.
Orova emails a text summary of the numbers for the sources and metrics you selected.
Instead of one report per platform, build a single combined dashboard:
All in one reporting workspace.
Choose the sources your business already uses.
Add the metrics and fields you want to track.
Drag in charts, tables, filters and other visual components.
Use AI to ask questions, analyze trends or create charts.
Share with your team, present it, or create a public link.
Data syncs on schedule or refreshes whenever you need.
Bring ads, website, SEO and social data into a single report.
Build a dedicated report for each client and share it live instead of exporting files over and over.
Track key metrics on one dashboard instead of logging into every platform.
Combine internal system data with marketing data to build custom reports.
Connect the data you already have.
Design reports the way your business needs them.
Let Orova handle visualization, updates and analysis support.
Free until July 7, 2027
No credit card · Every feature included
Free until July 7, 2027 · No credit card