
TikTok Ad Cost: CPM, Minimums and What Actually Drives Price
You typed "tiktok ad cost" into a search bar because someone above you asked what to budget, and you needed an answer today, not a lecture on advertising theory. You found a number, probably a bold CPM figure sitting in someone else's article, and it looked clean enough to put in a spreadsheet. That is the exact moment things start going wrong for most businesses, and it usually shows up a few days later as a campaign burning through budget far faster than planned.
The problem is that the number you copied was never a price list. TikTok does not sell ad space at a fixed rate the way a magazine sells a page. It runs a live auction, so what one business pays depends on its audience, its industry, its creative, and the exact week it is running ads. A benchmark written for a different company in a different season tells you almost nothing about what you will actually pay, which is why so many launch budgets look reasonable on paper and fall apart within the first week.
This article replaces that guesswork with something you can actually use. You will understand what really drives your TikTok ad cost up or down, which of those factors you can control, how to check your own real numbers instead of trusting a stranger's average, and how to set up a small test that gives you a clear answer before you commit real budget. By the end, you will be able to plan a TikTok ad spend with confidence instead of hope.
How Much Do TikTok Ads Cost?
There is no fixed price. TikTok sells impressions through an auction, so your cost is set by who else wants the same viewer, how likely the system thinks that viewer is to act on your ad, and which optimisation goal you chose. Published CPM benchmarks describe someone else's auction, not yours.
People asking how much do TikTok ads cost are usually asking one of three different questions without realising it, and the three have completely different answers.
The first is what is the minimum I have to commit. That one has a real answer, because TikTok enforces budget floors, and those floors are published inside Ads Manager for your billing currency. It is the only part of the cost to advertise on TikTok that behaves like a price.
The second is what will my cost per result be. That has no answer that anyone outside your account can give you, because it depends on your offer, your creative, your audience, your market and your competition. Anyone who tells you a number for this without seeing your account is guessing, and usually guessing from an average of accounts nothing like yours.
The third is what will my CPM be, and this is the one worth understanding properly, because for most campaign types CPM is not one metric among many. It is the price. TikTok's delivery for most optimisation goals bills you by the impression. Your cost per click and your cost per conversion are not separately purchased things; they are your CPM divided by ratios you produce. Get the framing right and half the confusion about TikTok ads price disappears.
What TikTok Ad Cost Actually Is: An Auction Price, Not a Rate Card
Start with the sentence that unlocks everything else: you are not buying inventory, you are buying the right to interrupt one specific person, and that right is contested.
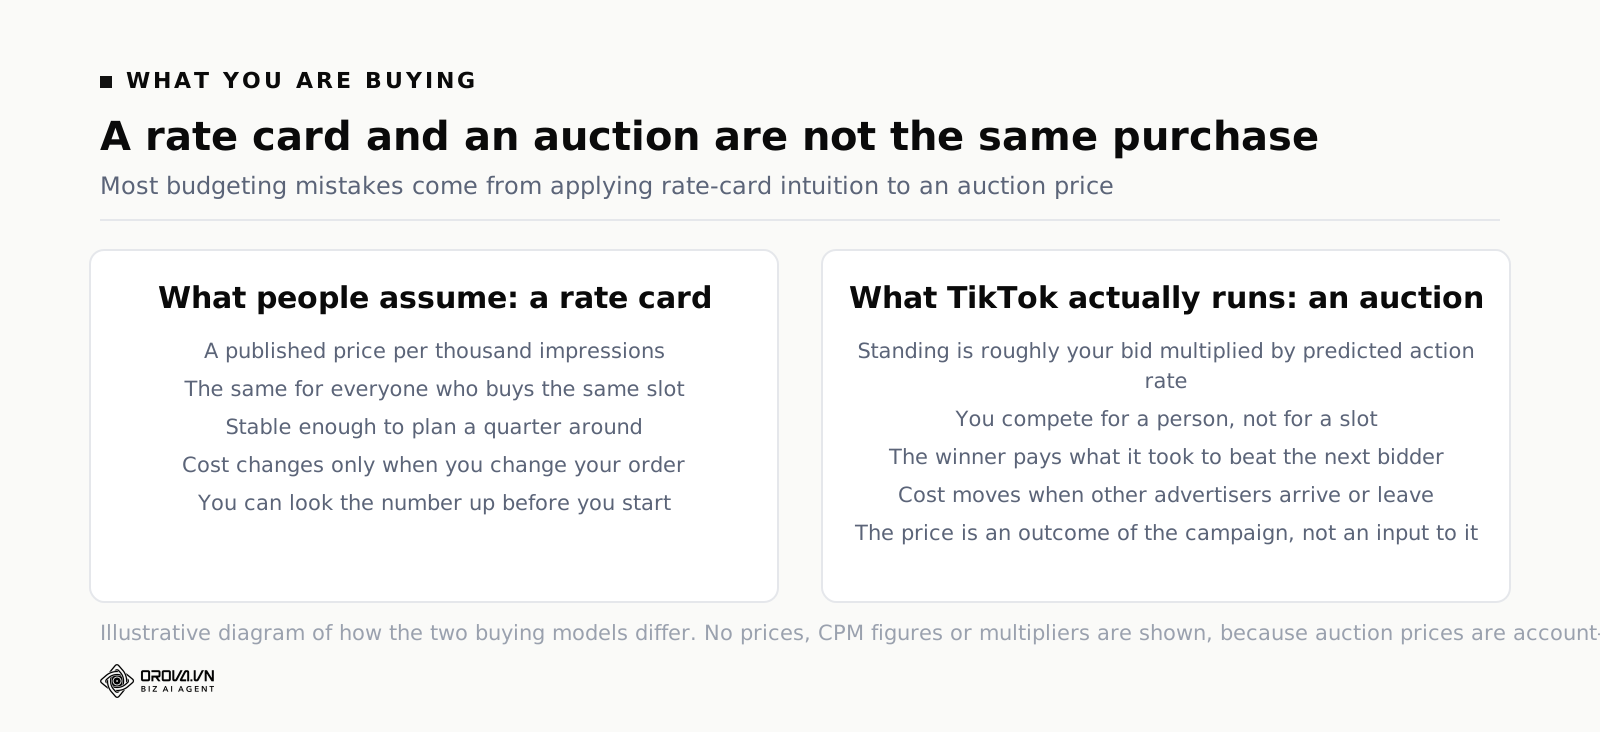
When someone opens TikTok and scrolls to the slot where an ad can appear, TikTok holds an auction for that slot. Every advertiser whose targeting includes that person is a candidate. TikTok does not simply hand the slot to the highest bidder, because the highest bidder might be someone whose ad that person will ignore, and an ignored ad earns TikTok nothing on a per-action basis and costs it attention. Instead the system ranks candidates by an effective value that combines two things: what you are willing to pay, and how likely the system predicts that person is to take the action you optimised for.
That second half is the part advertisers underestimate. Simplify it to a formula and the consequences become obvious: your standing in the auction is roughly bid × predicted action rate. If your creative is one that people scroll past, the predicted rate falls. To keep the same standing you have to raise the bid. So a weak hook does not merely produce fewer results. It raises the price of every impression you win, because you are compensating with money for what you failed to earn with attention. Creative is not a "quality" issue that lives in a different department from cost. Creative is a pricing input.
The other consequence is that you are competing for people, not for slots. The same in-feed placement, at the same hour, in the same country, costs wildly different amounts depending on who is in front of it. A twenty-four-year-old who has recently engaged with three shopping ads is wanted by dozens of advertisers. A person with a thin commercial signal is wanted by almost nobody. If your targeting has narrowed onto the first kind of person, you have volunteered for the expensive end of the marketplace and no bidding trick will get you out of it.
The price you actually pay is not your bid. In auctions of this design the winner pays roughly what was needed to beat the next candidate, not what they were willing to pay. This is why raising a bid often does not raise your cost proportionally, and why lowering a bid in a thin auction often changes nothing except your delivery. It is also why your cost moves when you did nothing at all: someone else entered or left the auction for your audience, and their behaviour set your price.
The Minimums TikTok Actually Enforces
Auctions set your price. Minimums set your floor, and the floor is the part of the cost to advertise on TikTok that is genuinely fixed, published, and frequently ignored until it bites.
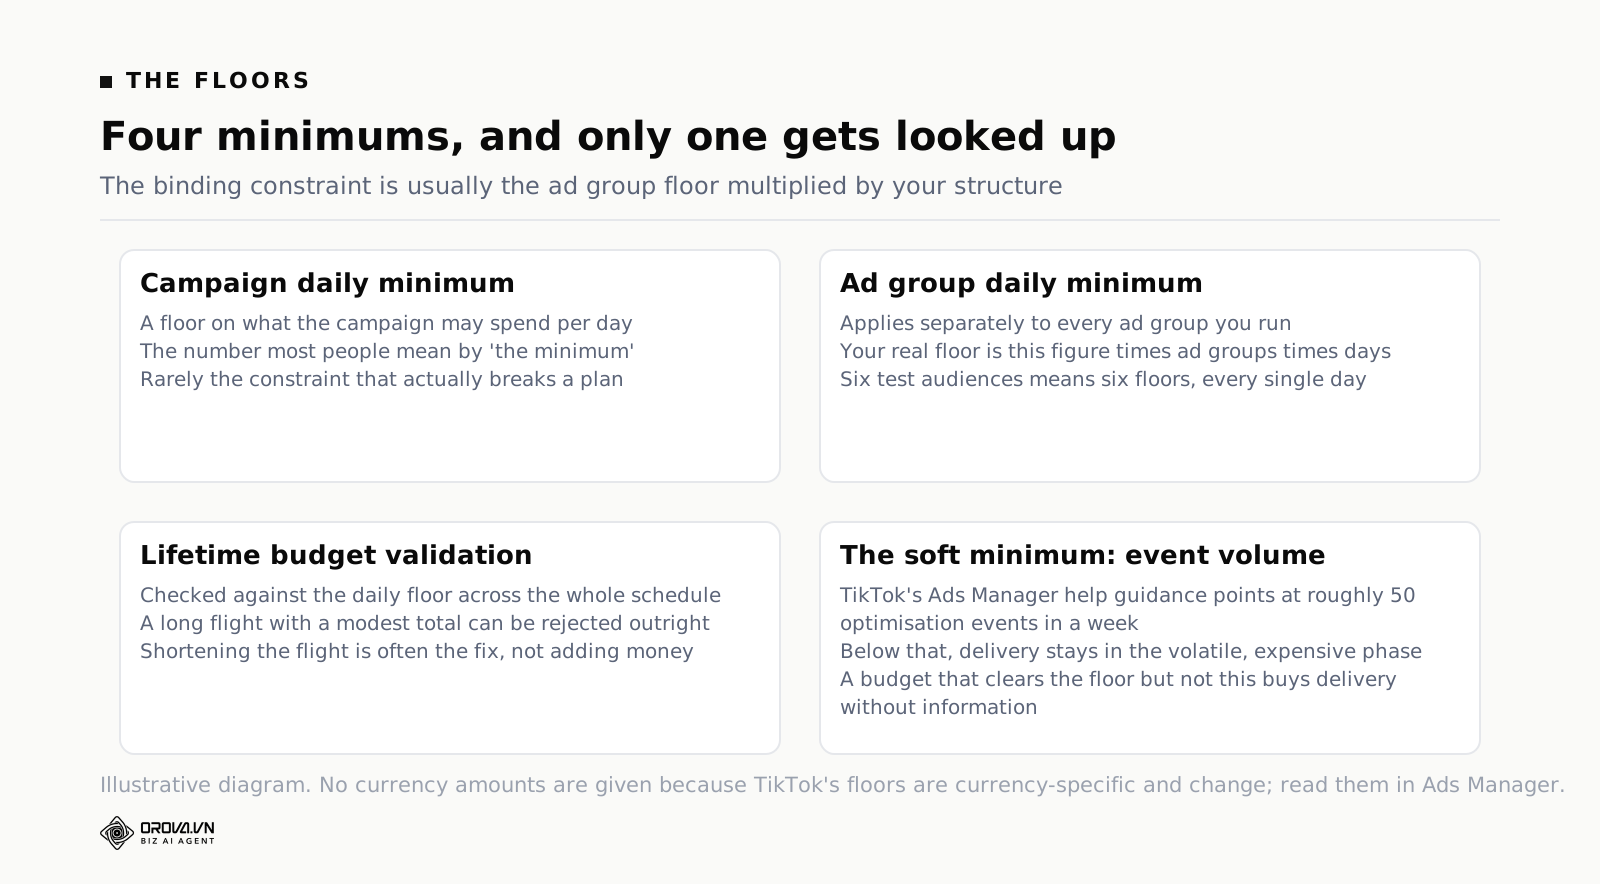
TikTok enforces minimum budgets at two levels. There is a minimum daily budget for the campaign, and a separate minimum daily budget for each ad group inside it. Lifetime budgets are typically validated against the daily floor multiplied by the number of days in the schedule, so a long flight with a small total can be rejected even though the total sounds substantial. The exact floors depend on your billing currency and TikTok has changed them over time, which is precisely why this article will not print a figure. Open Ads Manager, start a campaign in your own currency, and read what the budget field refuses to accept. That takes ninety seconds and gives you a number that is true today for you, rather than a number that was true in 2023 for an advertiser billing in dollars.
What matters more than the floors themselves is a piece of arithmetic almost nobody does before launch. Your real minimum monthly spend is not the campaign floor. It is the ad group floor multiplied by the number of ad groups you intend to run, multiplied by the number of days you intend to run them. A structure with one campaign and six ad groups, because someone wanted to test six audiences, commits you to six times the ad group floor every single day. Teams routinely design a test in a slide deck, discover the enforced minimum only at the moment of launch, and then either blow the budget or gut the test. Do the multiplication first and the structure argument becomes an honest one.
There is a second, softer minimum that costs more people more money than the hard one: the volume of optimisation events the delivery system needs before it stops guessing. TikTok's own Ads Manager help documentation describes a learning phase and points advertisers at accumulating in the region of fifty optimisation events in a week for delivery to stabilise. Treat that as a design constraint, not a nice-to-have. If your budget and your conversion rate cannot plausibly produce that many events in a week for a given ad group, that ad group will spend its entire life in the expensive, high-variance part of its lifecycle, and every number it reports will be noise you then make decisions on.
Finally, self-serve is not the only way to buy. Reserved and guaranteed formats — reach-and-frequency style buys, premium takeover placements, anything sold with a promised delivery — are transacted through TikTok's sales teams with committed spend levels that sit far above self-serve floors and are negotiated rather than published. If someone quotes you a "TikTok minimum" that sounds enormous, they are probably describing that market, not the auction one. The two are different products that happen to share an app.
Bidding and Optimisation Goals: Each Choice Reprices Your Impressions
Two campaigns can run in the same country, at the same hour, against the same audience, with the same creative, and report CPMs that differ by a large multiple. Usually the reason is that they asked TikTok for different things.
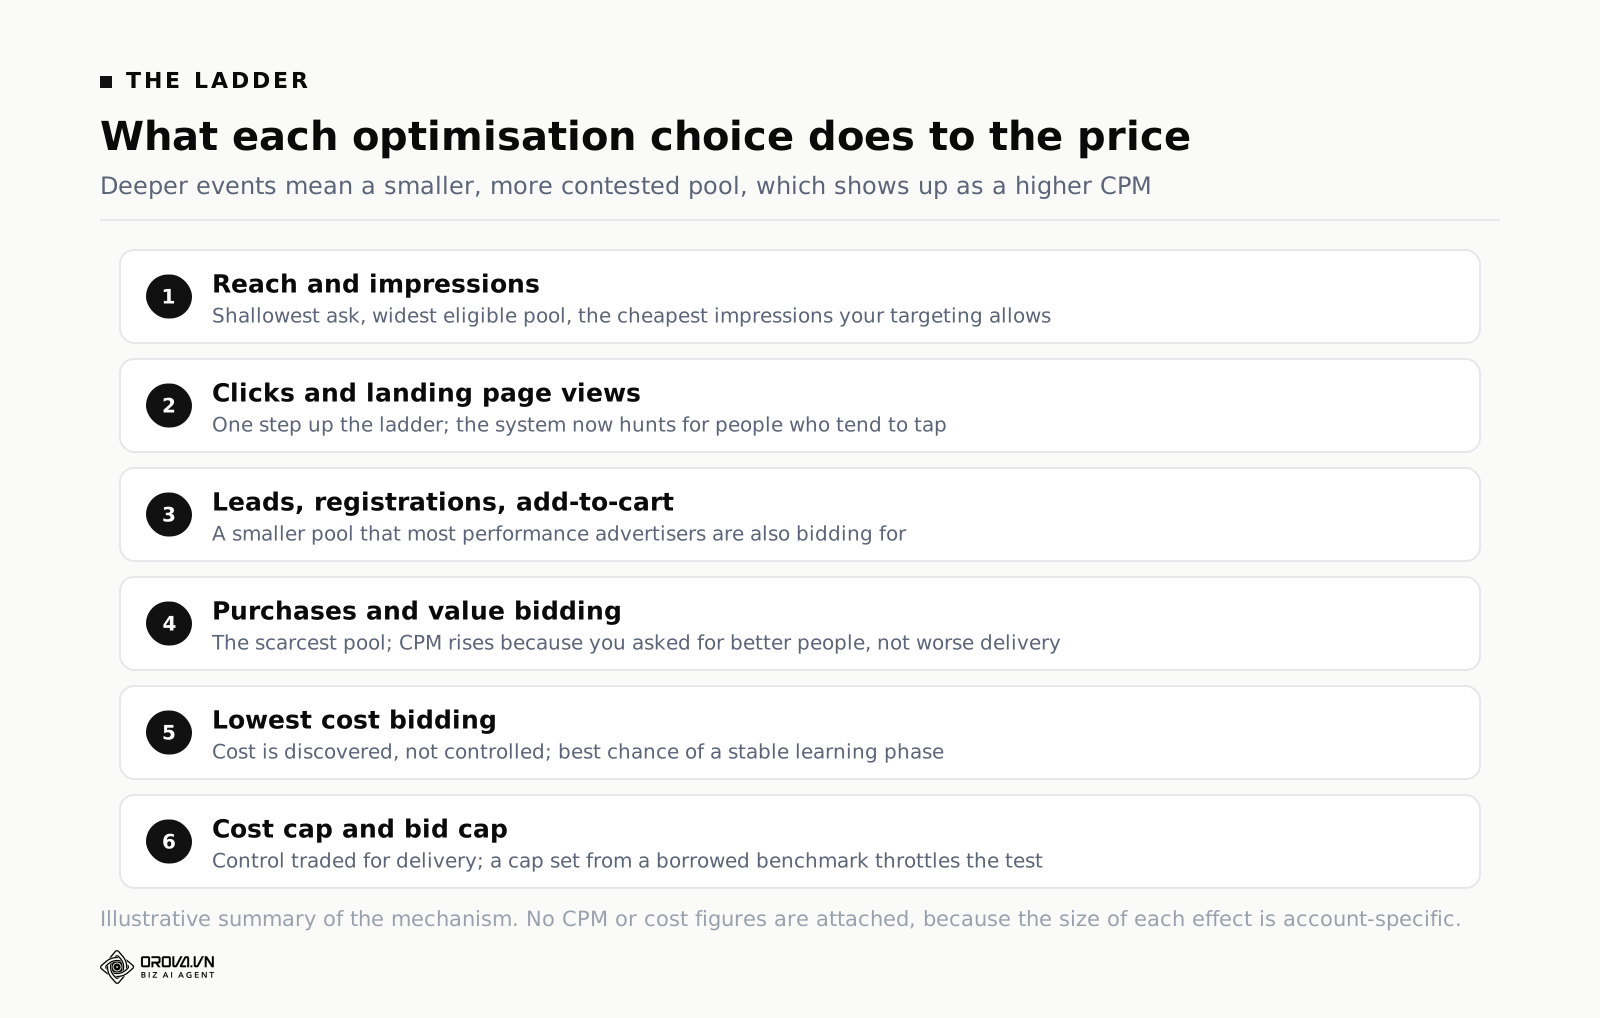
The optimisation goal tells the delivery system which people to look for. Ask for impressions and it will find the cheapest eyeballs that satisfy your targeting. Ask for purchases and it will hunt for the subset of that audience it predicts will buy, and that subset is exactly the group every other performance advertiser is also hunting. You are not paying more for the same impression. You are paying more for a scarcer, more contested, more commercially valuable impression. The CPM went up because you asked for better people.
Understand this as a ladder. The deeper the optimisation event, the smaller the eligible pool, the higher the auction pressure, and the higher the CPM. Reach and impressions sit at the shallow end. Clicks and landing page views sit a step up. Registrations, leads and add-to-carts sit above that. Purchases and value-based optimisation sit at the top. Comparing the CPM of a reach campaign against the CPM of a purchase campaign and concluding that TikTok "got expensive" is a category error, and it is the single most common way a benchmark gets misapplied.
The bid strategy then decides how aggressively the system pursues that goal.
Lowest cost, or maximum delivery
You set a budget and no bid; the system spends it seeking the most events it can. This is the right default when you do not yet know what a result is worth to you, and it is the strategy most likely to produce a stable learning phase because nothing is constraining delivery. The trade-off is that your cost per result is discovered rather than controlled. It will drift as the auction drifts, and it will usually creep upward as the cheapest pockets of the audience are exhausted.
Cost cap
You name an average cost per result you are willing to live with, and the system tries to hold to it on average, not per event. Two things follow. First, individual results above your cap are normal and not a malfunction. Second, a cap set below what the auction can actually deliver does not produce cheap results; it produces no delivery, or a trickle of delivery that never accumulates enough events to learn from. A cost cap set from a number you read in a blog post rather than from your own measured cost is the most reliable way to build a campaign that spends nothing and teaches you nothing.
Bid cap
A hard ceiling on what you will pay in any single auction. It gives the tightest control and the worst delivery, and it is genuinely useful only when you already know your economics precisely and are willing to trade volume for certainty. Reaching for it early, before you have measured anything, is a way of enforcing a guess.
Value or ROAS-based bidding
Instead of treating every conversion as equal, the system optimises toward revenue. It requires clean value data flowing back to the platform, and it usually requires more volume than event-count optimisation to work well, because it is estimating a distribution rather than a rate. When it works, your CPM often rises and your return improves at the same time, which looks alarming on a CPM dashboard and is completely fine.
One practical note that saves arguments: because most of these goals still bill per impression, your reported cost per click and cost per acquisition are derived numbers. The relationship is plain arithmetic. Cost per result equals your CPM divided by one thousand, divided by the product of the rates between an impression and that result. Change nothing about your bidding and simply double the rate at which people click, and your cost per click halves. That is not an optimisation trick. That is division.
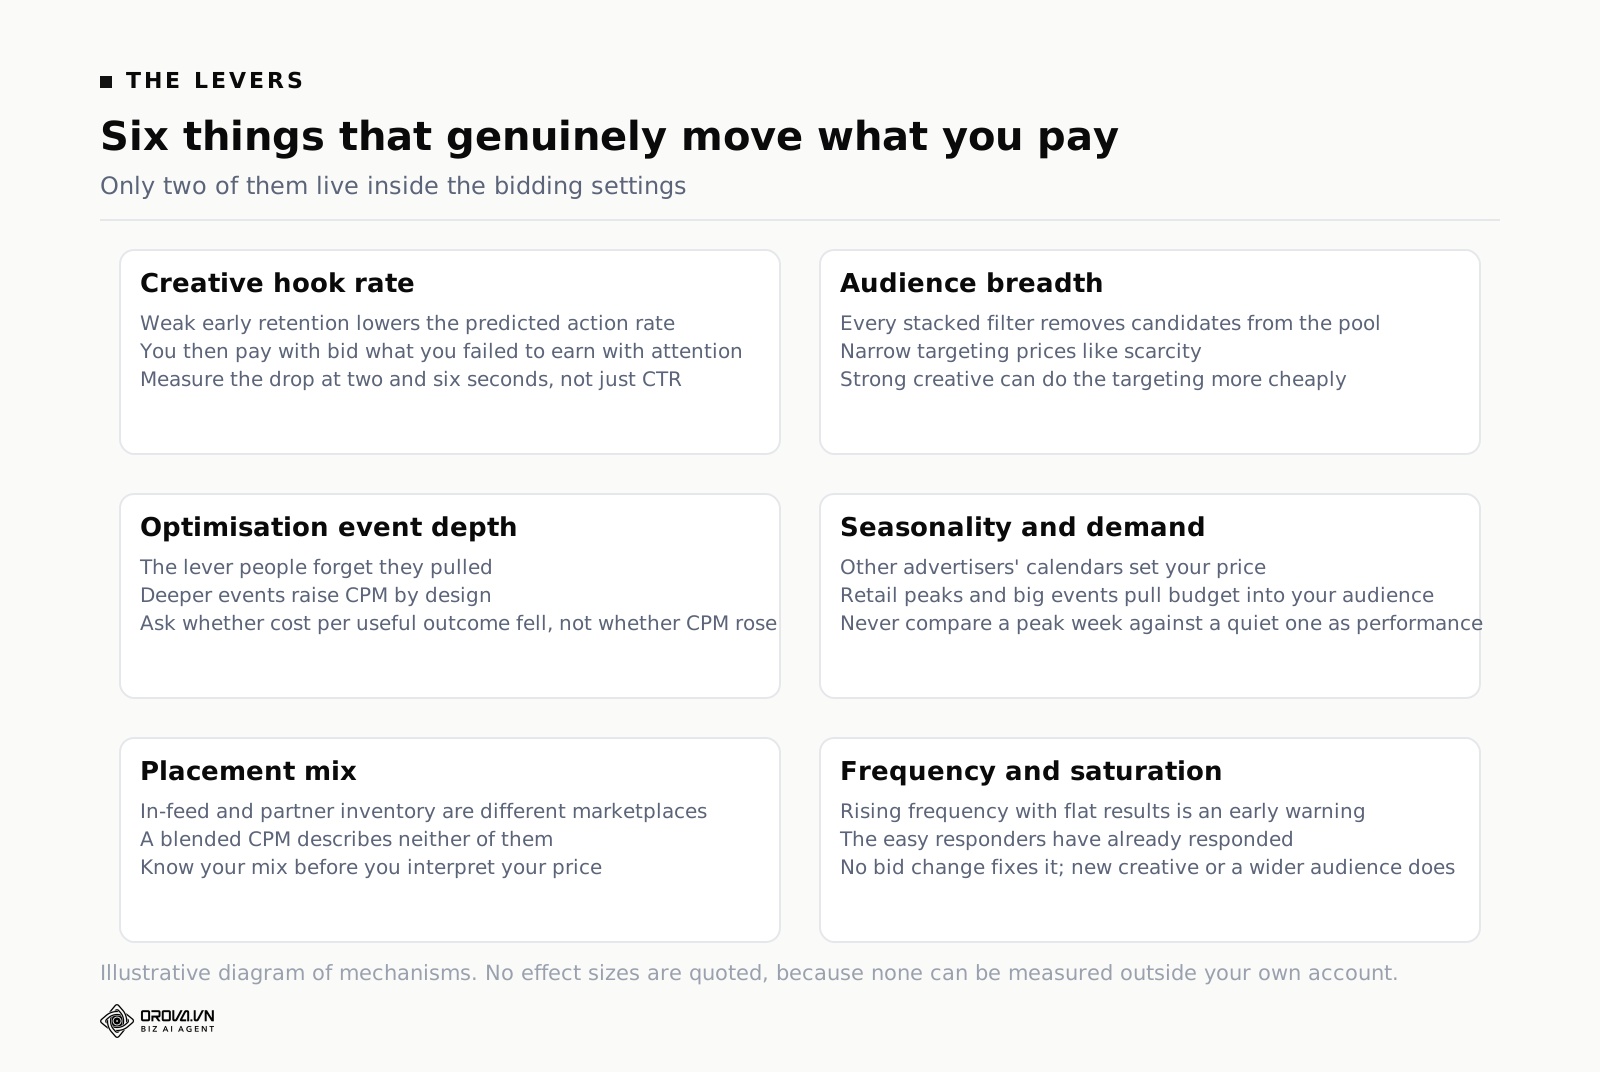
The Six Levers That Genuinely Move TikTok Ad Prices
Strip away the folklore and there is a short list of things that actually change what you pay. Everything else is a consequence of these.
1. Creative hook rate
This is the biggest lever and the one most often filed under "brand" rather than "cost". Go back to the auction ranking: bid multiplied by predicted action rate. Predicted action rate begins with whether people stop. If your first second does not earn the second second, every downstream rate collapses, the prediction collapses with it, and you are left paying full auction price for attention you did not earn.
The practical measure is the retention curve on the video itself, not the click-through rate. Watch the drop between the impression and the two-second mark, then the six-second mark. A creative that loses most of its audience before the product appears is not a weak creative; it is an expensive one. And this is where native-feeling formats earn their keep, because an ad built from a real creator post behaves differently in the feed to a repurposed television cut. If your paid creative is all studio-made, the cheapest available improvement is usually to start from content that already earned attention organically, which is the whole argument for spark Ads TikTok: Turning Organic Posts Into Paid Winners rather than commissioning new film.
2. Audience breadth
Narrow targeting feels precise and prices like scarcity. Every interest layer, every behaviour filter, every exclusion you stack removes candidates from the pool the system is allowed to buy, and the smaller the pool, the more of your delivery is forced into the contested part of it. Stacked narrow targeting also reduces the system's room to find the cheap pockets it is quite good at finding on its own.
The counter-intuitive version: on a platform whose delivery model is built around signal, broad targeting with strong creative frequently clears cheaper than tight targeting with average creative, because the creative is doing the targeting. That does not mean broad is always right. It means breadth is a price lever you are pulling whether or not you meant to.
3. Optimisation event depth
Covered above, and worth repeating as a lever because it is the one people forget they chose. Moving an ad group from clicks to purchases will raise your CPM. That is the mechanism working, not a fault. The question is never "did the CPM go up" but "did the cost per useful outcome go down".
4. Seasonality and auction demand
You share the auction with everyone else's calendar. Retail peaks, national shopping festivals, election windows, big sporting events and the run-up to major holidays pull enormous budgets into the same weeks and the same audiences. Your price rises because their budgets arrived, not because your account changed. This is the single most common cause of the "my CPM tripled and I didn't touch anything" report.
The defence is not clever bidding. It is knowing your own seasonal shape well enough to plan around it: shifting testing into cheap weeks, accepting a higher cost in weeks where the buyer is genuinely present, and refusing to compare a November CPM against a February one as though the difference were performance.
5. Placement mix
TikTok's automatic placements can extend delivery beyond the TikTok feed itself into partner inventory. These are different marketplaces with different demand and different attention, so they clear at different prices, and a blended report averages them into a single figure that describes neither. An account whose CPM suddenly improved may simply have shifted its mix, with no improvement in anything a customer would notice.
The rule is to know your mix before you interpret your price. If your reporting cannot break placement out, your CPM number is a weighted average of markets you did not consciously choose, which is worth understanding before you draw conclusions from it — the difference between TikTok Spark Ads & Pangle: The Native Ads Guide shows up in cost long before it shows up in anyone's slide.
6. Frequency and audience saturation
A campaign left running against a finite audience will show a rising frequency and a rising cost, in that order. The system has exhausted the people who responded easily and is working through the ones who did not. Frequency is therefore an early-warning column, not a vanity one. When frequency climbs while results flatten, no bid adjustment will save you; you need new creative, a wider audience, or both.
Why Published TikTok CPM Benchmarks Are Nearly Useless
Every quarter a fresh round of articles publishes an average TikTok CPM. They get cited in plans, pasted into decks, and used to justify budgets. Here is why the number, whatever it is, cannot do the job people ask of it.
It blends markets that share nothing. The auction in a market with deep advertiser competition and high purchasing power is a different economy from the auction in a market where fewer advertisers are bidding for the same attention. Averaging them produces a figure that is accurate for nowhere.
It blends objectives. A dataset containing reach campaigns and purchase campaigns has an average that describes neither. Since optimisation depth is one of the strongest determinants of price, this alone can move a published average by a multiple.
It blends placements. Accounts running automatic placements and accounts restricted to the TikTok feed are buying different inventory. A blend of the two is a blend of two markets.
It is a survivorship sample. The accounts contributing data are typically the ones plugged into whichever tool published the study, which skews toward larger, better-managed advertisers. Their auction outcomes are not your auction outcomes, and the skew always runs the same direction.
It is stale on arrival. By the time a study is compiled, written and published, it describes a quarter that has ended. Auction prices move with demand, and demand moves weekly.
The currency is often unstated or converted. A figure quoted in one currency and converted at some unnamed rate on some unnamed date is not a number you can put in a plan denominated in a different currency.
None of this means benchmarks are lies. It means they answer the question "what does the population look like" when you asked "what will I pay". The only legitimate use for a published TikTok CPM is as a sanity check of the order of magnitude, and even that is shaky across markets. The moment it becomes an input to a budget, it is doing work it cannot support.
There is one exception worth naming. The most useful benchmark in existence is your own account's history, segmented properly, and nobody publishes it because it belongs to you.
How to Measure Your Own TikTok CPM Properly
Replacing a borrowed number with a measured one takes less work than people expect. What it requires is discipline about segmentation, because an unsegmented CPM is just a private version of the same useless average.
The calculation itself is trivial. Cost per thousand impressions is your spend divided by your impressions, multiplied by one thousand. TikTok reports it for you. The work is in deciding what to compute it across.
Build a baseline table with one row per combination of the things that genuinely change price, and one column per week. At minimum: market, objective or optimisation event, placement setting, and audience type. Four dimensions, and you will immediately see that your account does not have a CPM. It has ten of them, and they behave independently.
Then add the derived relationships, because CPM alone will mislead you in both directions. For any row, cost per click is CPM divided by one thousand, divided by click-through rate. Cost per result is CPM divided by one thousand, divided by the product of every rate between an impression and that result. Writing these out changes how you read a report. A rising CPM alongside an improving click-through rate is usually good news wearing a bad costume. A falling CPM alongside a collapsing click-through rate is the opposite, and it is how accounts quietly buy cheaper and cheaper attention from people who were never going to care.
Three rules keep the baseline honest. Use a consistent window, ideally full weeks, so that weekday and weekend mix does not contaminate comparisons. Never compare a period containing a learning phase against a period that does not. And decide once whether you are reading platform-reported results or your own back-end results, then never mix the two in a single table, because the platform is measuring what it can attribute and you are measuring what actually happened.
Once you have this, you also have the answer to which numbers deserve to drive decisions and which are just interesting. CPM is a diagnostic, not a goal — nobody has ever been paid for a low CPM — and the discipline of separating ad Performance Metrics That Actually Matter matters more here than almost anywhere, because CPM is so easy to improve by making the campaign worse.
Building a Test Budget That Produces a Decision, Not Noise
Most TikTok test budgets are set by asking "what can we afford to risk". That question produces a number, and the number produces a campaign that spends real money and settles nothing. The better question is "what decision am I trying to be able to make, and what is the cheapest amount of data that would let me make it".
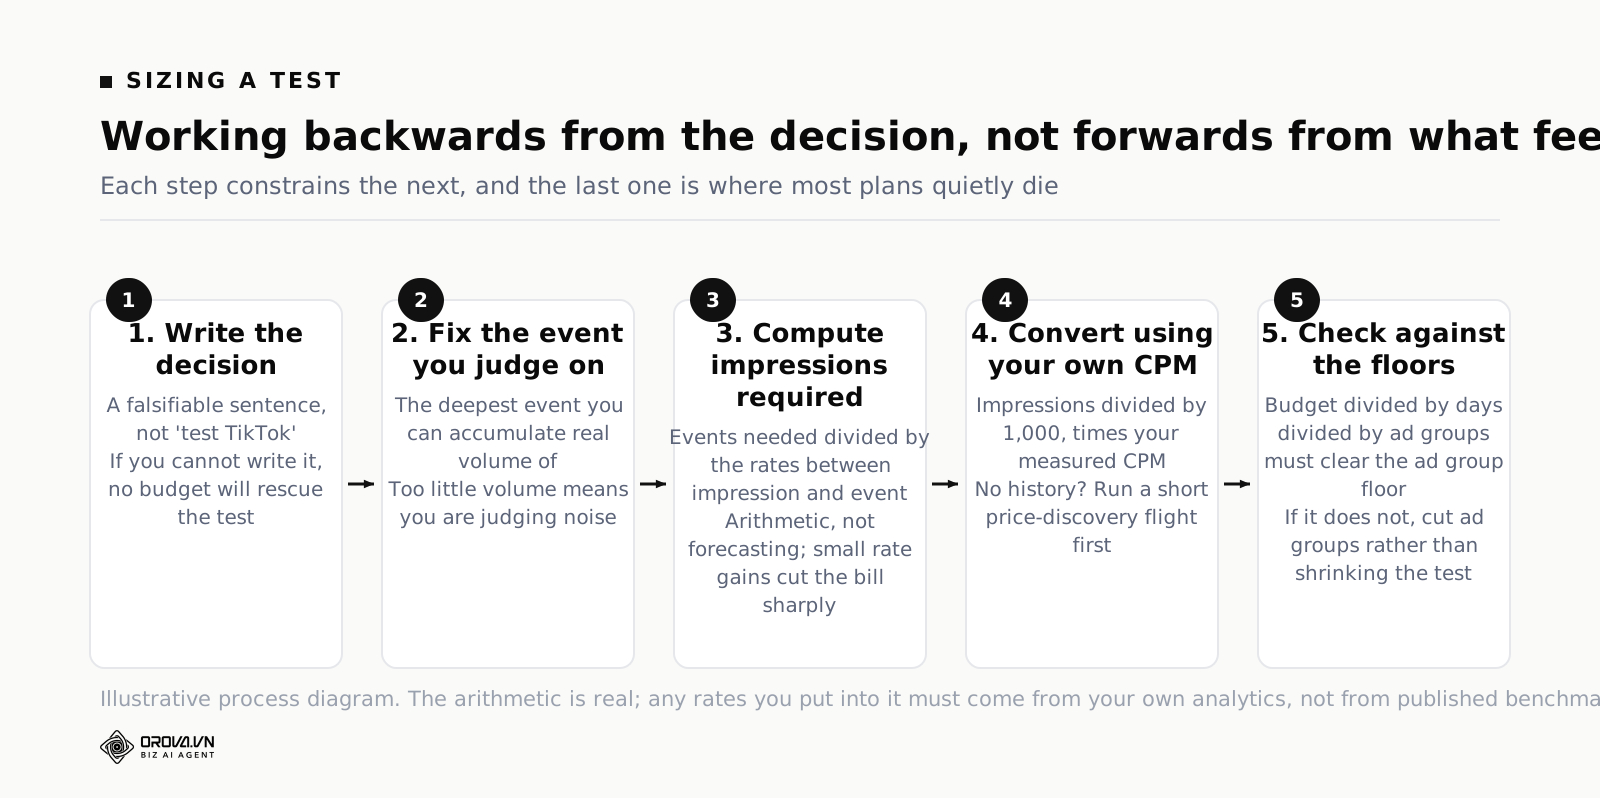
Work backwards in five steps.
Step one: write down the decision. Not "test TikTok". Something falsifiable: whether TikTok can acquire a first-time customer at or below the cost we currently accept on our other channel; or whether creator-style creative outperforms studio creative for this product; or whether this new market is viable at all. If you cannot write the sentence, no budget will help.
Step two: fix the event you will judge on. Ideally the deepest event you can accumulate meaningful volume of within the test window. If your purchase volume will be five, judge on a shallower event and accept that you are testing the top of the funnel, rather than pretending five purchases mean something.
Step three: compute the impressions required. Take the number of optimisation events you need — using TikTok's learning-phase guidance of roughly fifty in a week as your floor for a single ad group — and divide by the product of the rates between an impression and that event. This is arithmetic, not forecasting. The table below shows how sharply the answer swings with rates, using illustrative percentages chosen only to show the shape.
| Example click-through rate | Example conversion rate | Impressions needed for 50 events |
|---|---|---|
| 1% | 1% | 500,000 |
| 1% | 2% | 250,000 |
| 2% | 2% | 125,000 |
| 2% | 5% | 50,000 |
| 3% | 5% | 33,333 |
Those rates are invented for the illustration and you should replace them with your own, from your own analytics, before the table means anything. What it demonstrates is the leverage: a modest improvement in two rates cuts the impressions you must buy by an order of magnitude, and therefore cuts the budget the test requires by the same factor. Testing is expensive mostly when the funnel is weak.
Step four: convert impressions to money using your own CPM. Impressions divided by one thousand, multiplied by the CPM from your own baseline table for that market and objective. If you have no history at all, run a deliberately small, deliberately shallow campaign for a few days for the sole purpose of discovering your CPM, and treat its results as a price discovery exercise rather than a performance test. That is a legitimate and cheap use of a few days' budget. Copying a stranger's CPM into this step is where the three-times surprise at the top of this article came from.
Step five: check the structure against the floors. Now go back to the minimums. Divide your total budget by the number of days and then by the number of ad groups. If the result sits below the ad group daily floor, or below the amount needed to accumulate your event volume per ad group, your test is already broken and no amount of patience will fix it. The fix is fewer ad groups, not more money — concentrate the budget until each surviving ad group can reach a conclusion, and run the other variants later.
One more constraint that people discover too late: duration. A test that must produce fifty events per ad group per week cannot be compressed into three days by doubling the daily budget, because the auction and the learning system both need calendar time, and because a three-day window samples three days of a weekly demand cycle. Plan in whole weeks. Two clean weeks beat five ragged ones.
Common Mistakes When Budgeting for TikTok
Treating a published CPM as a quote
The mistake that started this article. A benchmark is a description of a population you are not a member of. If a number is load-bearing in your plan, it has to come from your account or from a deliberately-run price discovery campaign. Everything else is decoration.
Splitting a small budget across many ad groups
The instinct is reasonable: more variants, more learning. The arithmetic is brutal. Each ad group has to clear its own floor, accumulate its own event volume, and complete its own learning phase. Five ad groups on a small budget means five permanently-learning ad groups producing five noisy datasets, and the comparison between them is meaningless because none of them ever stabilised. Fewer, better-funded ad groups produce fewer answers per month and vastly more reliable ones.
Editing the campaign every day during learning
Significant edits reset the learning process. An account where someone adjusts budgets and bids each morning is an account that never leaves the most expensive, most volatile phase of delivery. This is the most expensive form of diligence there is: it feels like management and it functions as sabotage. Set a review cadence, write it down, and do not touch the campaign between reviews unless something is actually on fire.
Optimising for an event you cannot accumulate
Choosing purchase optimisation when your account produces a handful of purchases a week tells the system to learn from almost nothing. It will spend expensively while guessing. Optimising for a shallower event with real volume, and watching the deeper event as a reported outcome, is usually cheaper and always more stable — provided you actually check that the shallow event still correlates with the deep one, because when it stops correlating you are efficiently buying worthless actions.
Comparing TikTok CPM against another platform's CPM as if the unit were the same
An impression is not a standard unit across platforms. Placements differ, viewability conventions differ, the format differs, and audience mixes differ. A cross-platform CPM comparison tells you almost nothing about value. Compare on the outcome you sell, on the same measurement basis, over the same window, and be honest that even that comparison is contaminated by attribution differences.
Forgetting the money that is not media
The number in Ads Manager is not what leaves the bank. Depending on your market there may be tax added at invoicing, payment or currency conversion costs, agency or tooling fees, and the very real cost of producing enough creative to keep frequency down. Plans that budget only for media routinely run out of creative before they run out of money, then keep spending against a saturated audience at rising cost.
Mixing currencies in one view
If you run accounts billing in different currencies and stack them in one report, every cost threshold you set is quietly wrong, because the conversion rate you used was right on one day only. This sounds like a small bookkeeping matter. It is not: it silently corrupts every cost cap, every rule and every comparison downstream.
A Monthly Routine for Keeping Cost Honest
Cost control on TikTok is not a project. It is a cadence, and it is short.
| When | What you look at | What it tells you | Typical action |
|---|---|---|---|
| Weekly, 10 minutes | CPM by market, objective and placement setting, full weeks only | Whether price moved, and where | Nothing, unless a segment moved outside its usual range |
| Weekly, 10 minutes | Frequency alongside results, per ad group | Whether the audience is saturating | Queue new creative or widen the audience before cost climbs |
| Weekly, 10 minutes | Early retention on your top-spending videos | Whether the hook is still earning attention | Retire creative that has stopped stopping people |
| Fortnightly, 20 minutes | Rates between impression and result, per ad group | Whether cost changes came from price or from the funnel | Fix the weakest rate rather than adjusting bids |
| Monthly, 30 minutes | Ad group count against enforced floors and event volume | Whether the structure can still reach conclusions | Consolidate ad groups that never accumulate enough events |
| Monthly, 20 minutes | Platform-reported results against back-end results | Whether the gap between the two is drifting | Recalibrate the numbers you plan with |
| Quarterly | Your own seasonal CPM shape, year over year | Which weeks are structurally expensive | Move testing into the cheap weeks |
Notice that almost nothing in that table is a bid adjustment. Bidding is the last lever, not the first, and on most accounts it is the one with the smallest available upside.
Where Hand Work Stops and a Tool Earns Its Place
You can run everything above by hand. Plenty of good advertisers do, and if you manage one account in one currency with three ad groups, hand work is genuinely fine. It stops scaling at a predictable point: when the segmentation that makes your CPM meaningful is also what makes it tedious. Four dimensions of segmentation across several markets and three platforms is not a hard analysis, it is a boring one, and boring analyses are the ones that quietly stop happening in week six.
That is roughly the shape of what Orova Ads is for. It connects Google Ads, Meta and TikTok Ads through each platform's own login, pulls campaigns, ad groups, ads and daily metrics into one table, and shows spend, impressions, reach, frequency, clicks, CTR, CPC and results side by side with filters and drill-down, so the weekly read takes minutes instead of three interfaces. Its rule sets are written as ordinary sentences with data placeholders and each set runs on its own schedule, so the frequency check and the saturation check happen whether or not anyone remembers; there are 19 template rule sets to start from and 214 optimisation action codes across the platforms, 55 of them for TikTok. By default the AI only advises: every suggestion arrives with its reason and the numbers behind it, logged in a history you approve or reject, and you can move to hybrid or fully automatic for the actions you trust. One detail matters more than it sounds for this topic — when an account mixes currencies, Orova blocks the comparison rather than converting it, because a stale exchange rate makes every cost threshold downstream quietly wrong. Signing up is free with 1,000 quota and no card, and there is no percentage taken from your ad spend. The judgement about what a customer is worth stays yours. The not-forgetting does not have to be.
Frequently Asked Questions
Why did my TikTok CPM triple overnight?
Four causes cover almost every case. Auction demand rose because a shopping season, holiday or major event pulled other advertisers into your audience. You changed the optimisation goal to a deeper event. Your placement mix shifted, so you are buying different inventory than last week. Or a new creative is under-performing on early retention, which lowers the predicted action rate and forces the auction to charge you more for the same standing. Check them in that order, and check whether your comparison window straddles a learning phase before concluding anything.
What is the real minimum cost to advertise on TikTok?
For self-serve, the honest answer is: the ad group daily floor for your currency, multiplied by the number of ad groups you run, multiplied by the number of days. Read the floors in Ads Manager rather than from any article, because they are currency-specific and they change. Then check that figure against the volume of optimisation events you need per week, because a budget that clears the floor but never accumulates events buys you delivery without buying you information.
Does raising my bid lower my CPM?
No, though the confusion is understandable. Raising your bid raises your standing in the auction, which usually raises what you win and can raise what you pay. What genuinely lowers your price for a given position is a higher predicted action rate — better creative, a better-matched audience, a shallower optimisation event — because those improve the other half of the ranking. Bidding buys standing with money; the rest buys it with relevance, and relevance is cheaper.
Are TikTok ads cheaper than Meta or Google?
Not answerable as asked, because CPM units are not comparable across platforms and the audiences and intents are different. What is answerable, in your own account, is which platform delivers your business outcome at a lower cost on a consistent measurement basis over the same period. Run that comparison on outcomes rather than on CPM, and be explicit about attribution differences before anyone treats the result as settled.
Do Spark Ads or creator-style formats change the cost?
Indirectly, and often substantially. The format does not carry a different rate; it tends to carry a different early retention curve, because content that already earned attention in the feed keeps earning it when boosted. Better retention lifts the predicted action rate, which improves your auction standing at the same bid. That shows up in reporting as a lower cost for the same delivery, and it is the mechanism, not a discount.
How long before my costs settle?
Plan in whole weeks. An ad group is unstable until it has accumulated enough optimisation events for delivery to stop guessing, and every significant edit restarts that process. If you have been editing daily, your account has never shown you a settled cost, and the first honest number you will see is roughly a week after you stop touching it.
Should I use a cost cap to protect my budget?
Only once you know, from your own data, what your cost per result actually is. A cap set from a borrowed benchmark either does nothing, because it sits above the achievable cost, or throttles delivery to nothing, because it sits below it. Both outcomes waste the flight. Discover the number with lowest-cost bidding first, then cap around what you measured.
What to Do This Week
Three things, in order, and none of them takes a day.
First, delete the borrowed CPM from your plan. Open Ads Manager, read the actual minimum daily budget for your currency at both campaign and ad group level, multiply by your intended structure and duration, and see whether the plan was ever feasible. Most surprises about TikTok ad prices are discovered at this step, on a spreadsheet, for free.
Second, build the baseline table. One row per market, objective, placement setting and audience type; one column per full week; CPM plus the rates between impression and result. It will be ugly and half-empty for a month. It will still be worth more than every published benchmark you can find, because it is about you.
Third, pick one decision you want TikTok to answer this quarter, write it as a falsifiable sentence, and size the budget backwards from the events required to answer it. If the arithmetic says the budget cannot produce an answer, do not run a smaller version of the test. Run fewer ad groups, or run it later. A test that cannot conclude is not a cheap test. It is a slow way of paying for noise.
Stop Guessing, Start Measuring Your Own TikTok Ad Cost
Everything covered above works, but doing it properly by hand takes real time: pulling your own campaign data, comparing bidding options, tracking cost per result across test after test, and redoing that check every time TikTok changes something in the auction. Most business owners do not have a spare afternoon each week for that kind of monitoring, and that is exactly where things quietly slip and budgets drift.
Orova Ads is built to take that ongoing tracking off your plate, automatically pulling in the numbers that matter and flagging when your costs move so you are not left checking spreadsheets manually. If you would rather spend your time deciding what to do with the numbers than collecting them, it is worth taking a look.
Watch TikTok spend next to Google and Meta
Orova Ads puts all three platforms in one table so you can see where the next dollar should go.
Start for free