
Facebook Ads Getting Clicks but No Sales: A Diagnostic Order
You check the dashboard and the clicks look fine, the cost per click looks fine, even the comments under the ad look promising. Then you open your actual order list and the number does not match anything the dashboard promised — a handful of sales, maybe one of them placed by a friend or relative you asked to test the checkout. That gap between cheap traffic on one screen and an almost empty order list on the other is exactly what people mean when they say facebook ads not converting.
The usual reaction is to blame the ad itself — the video, the photo, the headline — and spend the weekend making new ones. But creative is only one possible cause out of several, and it happens to be the least likely one to check first. Chasing it before ruling out the others means you burn days reshooting content while the real issue, wherever it actually lives, keeps quietly killing every new ad you launch.
This article walks through the problem in the order that actually matters, starting with whether your sales are even being tracked correctly, then who is really clicking, then what you're asking them to buy, then what happens the moment they land on your page, and finally how long people need before they buy. By the end, you will know exactly where to look first the next time clicks come in but sales don't, instead of guessing and hoping the next ad performs better.
Why Facebook Ads Not Converting Is Rarely a Creative Problem
Creative is the thing you can see. It is also the thing you have opinions about, the thing your partner has opinions about, and the only part of the machine that feels like it belongs to you. So when the money stops working, creative is where the hands go first. That instinct is wrong for a specific and checkable reason.
Creative's job is to earn the click. If you are getting clicks at a cost you are willing to pay, the creative already did its job. It found people, it interested them enough to leave the feed, and it delivered them to your site. Everything that happens after the click — whether they find what they expected, whether they trust you, whether the price makes sense, whether the page loads before they lose patience, whether the sale gets recorded when it happens — is a different set of machinery entirely, and none of it is the ad's fault.
There is exactly one creative problem that produces this pattern, and it is worth naming so you can rule it in or out in five minutes: a mismatch between what the ad promises and what the page delivers. If the ad says "70% off everything" and the landing page shows a 20% sale on last season's stock, you will get a great click-through rate and no sales, and the creative genuinely is the problem — not because it is bad, but because it is writing cheques the page cannot cash. Check that once, honestly, by clicking your own ad on your own phone and asking whether the page is what you expected. If the answer is yes, stop touching the creative and start working the layers.
The deeper reason order matters is that the layers contaminate each other's evidence. Suppose your pixel is under-reporting by half. Every conclusion you draw about which audience converts, which creative converts, and which landing page converts is drawn on half the data, weighted toward whichever segments happen to be measured best. You could run four creative tests, pick a winner, scale it, and be scaling the ad that happened to reach the most Android users. Fix measurement first and every test after it becomes trustworthy. Fix it last and you throw away the tests you already ran.
What Does It Mean When Facebook Ads Get Clicks but No Sales?
It means the ad is doing its job and something after the click is not. Clicks prove the creative earned attention. No sales means the failure sits in measurement, traffic quality, the offer, the landing experience, or the buying timeline. Check those five layers in that order, because a fault in an earlier layer makes every later measurement unreliable.
Think of it as a funnel with five valves, arranged so that each one sits upstream of the next. Water at the top is impressions. Water at the bottom is money in the bank. A closed valve anywhere stops the flow, but a closed valve near the top also stops you from seeing whether the valves below it are open.
Here is the order, with what each layer is actually asking:
- Measurement. Are the sales that already happened being recorded and attributed? If not, you may not have a problem at all — you may have a reporting hole.
- Traffic quality. Are the people arriving the kind of people who could ever buy? Placement, audience definition, and whether the click was intentional all live here.
- Offer. Is what you are selling, at that price, with those terms, a thing this audience would buy from a stranger on the internet today?
- Landing experience. Does the page load, work on a phone, answer the obvious questions, and let someone pay without an argument?
- Timing. Is the purchase decision longer than the window you are measuring in? Some things are not bought on the first visit and never will be.
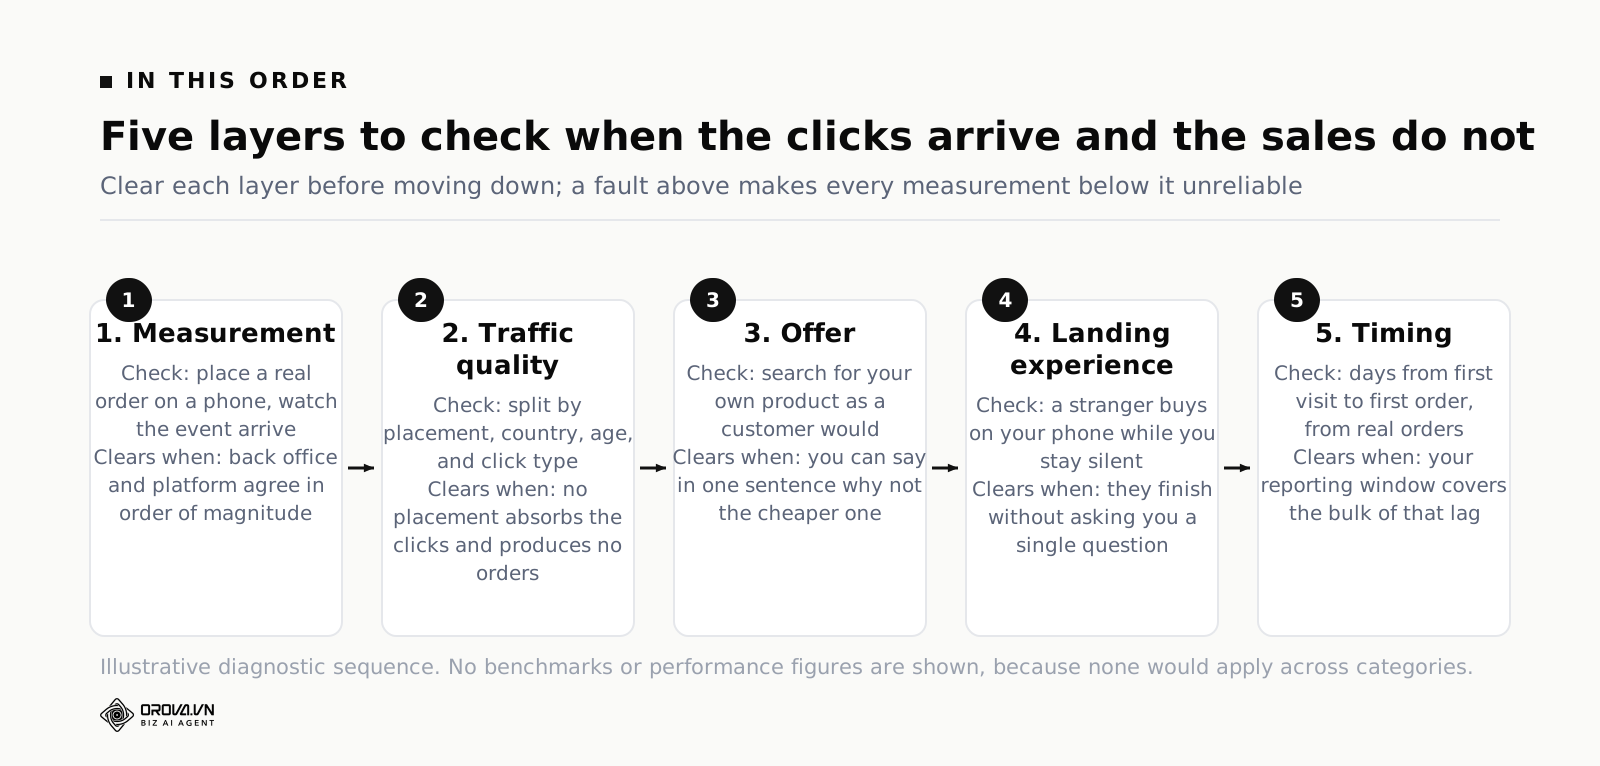
One rule holds the whole method together: clear a layer before you move down, and never skip back up to fiddle. Clearing means you have a specific piece of evidence, not a feeling. "The pixel is probably fine" is not evidence. "I placed a test order on my phone and the Purchase event arrived in Events Manager within ninety seconds with the correct value and currency" is evidence.
Layer 1: Measurement — Are the Sales Even Being Recorded?
Start here every single time, including the times you are certain it is fine. In my experience the measurement layer is where somewhere close to half of these cases end, and the reason is uncomfortable: measurement breaks quietly. Nothing goes red. No email arrives. The number just gets smaller, and because performance always wobbles, a wobble is exactly what it looks like.
The three numbers that should roughly agree
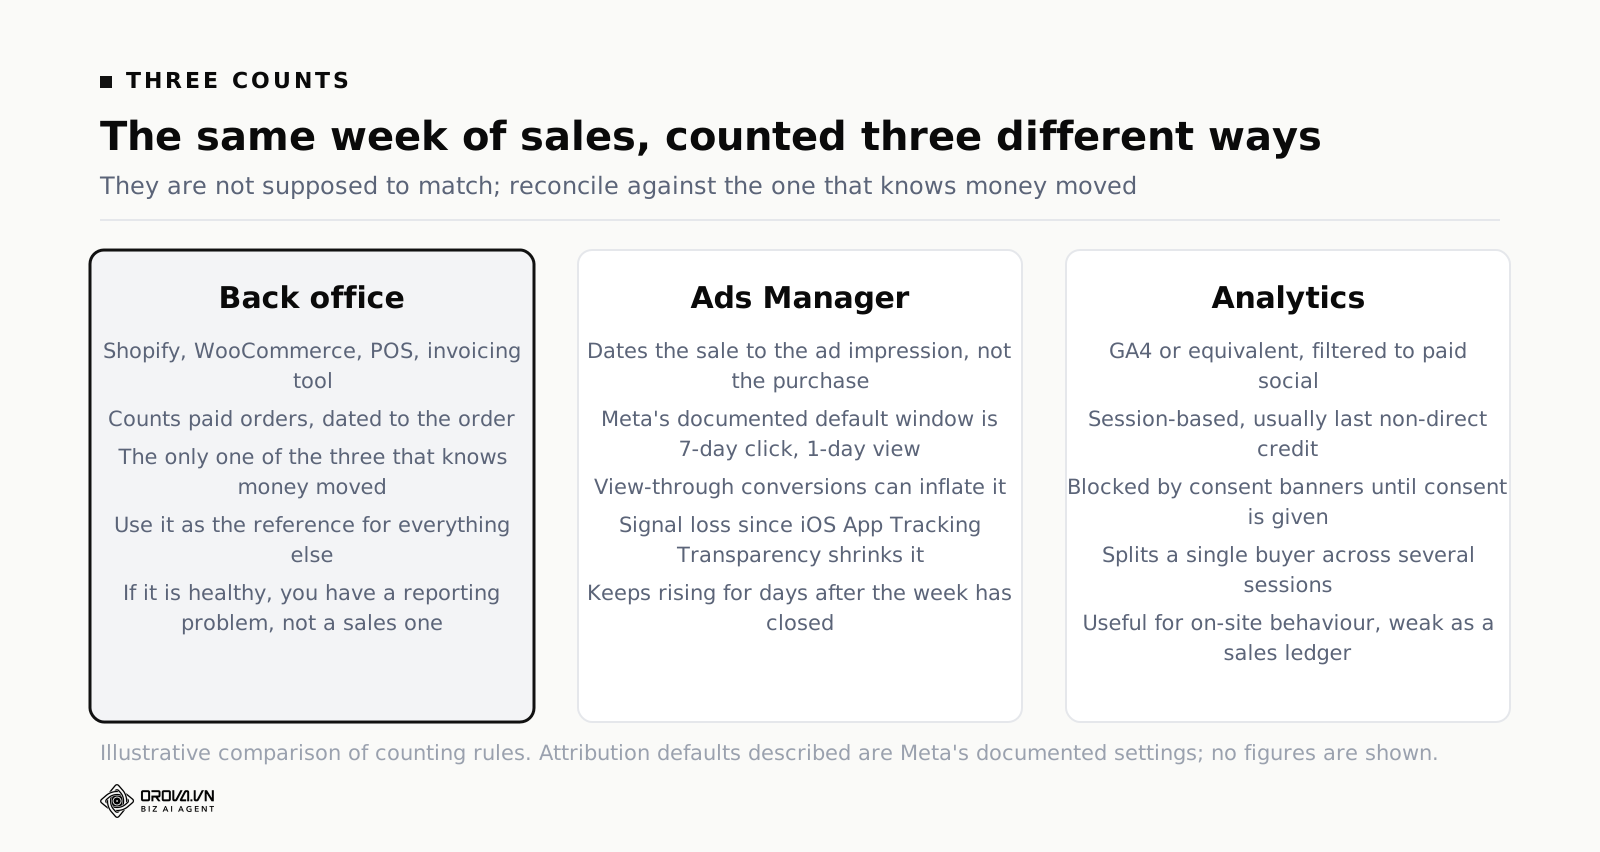
Open three screens and write down the same week's sales from each:
- Your back office. Shopify, WooCommerce, your POS, your invoicing tool — whatever actually knows that money moved. This is the truth. Every other number is an estimate of it.
- Your analytics. GA4 or equivalent, filtered to paid social.
- Ads Manager. The Purchase or Lead column for the same period.
They will not match exactly and they are not supposed to. They count different things, on different dates, under different rules. What you are looking for is not agreement — it is order of magnitude. If the back office says fourteen orders came in last week and Ads Manager says one, that is not attribution nuance. That is a broken pipe.
Why the three numbers legitimately differ
Understanding the legitimate reasons stops you chasing ghosts, so it is worth being precise.
Ads Manager dates conversions to the ad impression, not the purchase. If someone saw your ad on Monday and bought on Friday, Ads Manager credits Monday. Your back office credits Friday. Compare a narrow week and the two will disagree simply because of where the boundary falls. This is also why last week's ad performance keeps quietly improving for several days after the week has ended — a phenomenon worth understanding properly, because it wrecks Monday-morning decisions. We covered the mechanics of it in ROAS Formula & Conversion Lag: Why Today's ROAS Is Wrong.
The attribution window is a setting, and the default is not what most people assume. Meta's documented default attribution setting for most objectives is 7-day click and 1-day view. Change it to 1-day click and your reported conversions drop overnight with no change in reality. Look at the small print under the results column and know which setting you are reading before you compare anything to anything.
View-through conversions inflate the platform's number. Someone who scrolled past your ad, never clicked, and later typed your name into Google can still show up as a Meta conversion under a 1-day view window. Your analytics tool would call that organic or direct. Neither is lying.
Signal loss after Apple's App Tracking Transparency is real and permanent. Since iOS 14.5, users who decline tracking cannot be observed by browser-based pixels the way they used to be, and Meta's Aggregated Event Measurement responds with modelling and with a documented limit of eight conversion events per verified domain, prioritised in an order you choose. Meta publishes all of this. The practical consequence: if you sell to an iPhone-heavy audience, the platform will systematically report fewer conversions than your back office records, and no amount of pixel debugging will close that gap.
The checks that clear this layer
- Place a real test order. Not a preview, not a simulator. On a phone, on mobile data rather than office wi-fi, through the ad if you can. Then open Events Manager and confirm the Purchase event arrived, with the right value, the right currency, and a matched event ID if you run the Conversions API alongside the pixel.
- Check for duplicate events. Pixel plus Conversions API without proper deduplication produces conversions that look great and are half fictional. If the platform is reporting more sales than your bank account, this is usually why.
- Check event value and currency. A Purchase event firing with no value cannot optimise for value. A shop that switched from one currency to another and left an old hard-coded value in the template will report nonsense forever.
- Check domain verification and the eight-event priority list. If Purchase is not in the top slots, it may be getting deprioritised behind events that do not matter to you.
- Check for consent-banner interference. On many EU-facing sites the pixel does not fire until consent is given, which means a portion of buyers is invisible by design. That is correct behaviour, and you need to know its size.
What "cleared" looks like: a test order that appears in Events Manager with correct value, and back-office sales that are within a believable multiple of what the platform reports for the same window. What "found it" looks like: the back office shows a healthy number of orders that the platform never saw. In that case you never had a conversion problem. You had a reporting problem, and it was probably telling the algorithm to optimise toward the wrong people the entire time — which is the expensive part.
If measurement was the fault, fix it and then wait. Do not immediately go changing audiences. Give the account a week to relearn on correct signal before you judge anything else, because the optimisation engine has been fed wrong answers and needs time to unlearn them.
Layer 2: Traffic Quality — Who Actually Clicked
Measurement is clean, the back office agrees, and the sales genuinely are not there. Now ask a blunter question: were these people ever candidates to buy?
A click is not an intention. It is a finger movement. Some finger movements mean "I want this", some mean "what is this", and some mean nothing at all because the finger was aiming at something else.
Placement: where the click physically happened
Break your results down by placement — Ads Manager will do it in two clicks — and look at cost per click and conversion rate side by side per placement. The pattern that shows up again and again is one placement delivering the majority of clicks at a fraction of the cost, and approximately none of the sales. Audience Network and some in-feed video placements are the usual suspects, and the reason is not that the people there are worthless. It is that a proportion of those clicks are accidental: a full-screen interstitial appears, a thumb is already moving, and a click gets registered by someone who never chose to visit you.
You can spot this without guessing. Accidental clicks have a signature: extremely low cost per click, near-zero average time on page in your analytics, and a bounce pattern that looks like people arriving and leaving within a second or two. If one placement shows that signature, exclude it and watch what happens to your blended cost per click. It will go up. That is the correct outcome — you were buying cheap clicks that could never become sales, and the cheapness was hiding the problem inside your average.
Audience: the wrong kind of right people
Three failures are common enough to check by name.
Interest targeting that describes a topic, not a buyer. Targeting "interested in yoga" for a premium yoga mat reaches people who like yoga content. Liking content and buying equipment at a certain price point are different behaviours. Broad interests fill the top of the funnel with people who enjoy the category and have no purchase intent, and Meta's delivery system will happily optimise toward whoever is cheapest to get a click from within that pool.
Lookalikes built from a bad seed. A lookalike is only as good as the list underneath it. Build one from all website visitors and you get a lookalike of browsers. Build it from purchasers, ideally your repeat purchasers or your top-value customers, and you get something closer to a lookalike of buyers. If your seed list is small or stale, the model has little to work with. We went through which sources are worth building on in facebook Ad Fatigue: How to Spot It Before Results Drop, where the same seed-quality question decides how long an audience can sustain a campaign before it burns out.
Geography and delivery you did not intend. Check the country and region breakdown. Campaigns set to a broad region, or left on the default "people living in or recently in this location", routinely deliver a meaningful share of impressions somewhere you cannot ship to or do not serve. Also check the age and gender split against who actually buys from you in the back office. If the ads deliver 70% to one group and the orders come from another, the delivery system found a cheap pocket and settled there.
Click type: outbound versus everything else
This one catches people out constantly. The default "Clicks (All)" column counts a lot of things: link clicks, but also expanding "See More", clicking the page name, tapping to unmute a video, opening the comments. If your ad has an engaging first line and a long caption, a large share of your headline click number may never have gone anywhere.
Add the outbound clicks and landing page views columns and compare all three. The interesting number is the gap between link clicks and landing page views: it tells you how many people started the journey to your site and never arrived. A big gap points down to the next layers — usually page speed — and it also tells you your real click volume is much smaller than you thought, which changes whether you have a conversion problem or a sample-size problem.
What "cleared" looks like: placements behave consistently, the geography and demographics match your actual customers, and landing page views are within a reasonable distance of link clicks. What "found it" looks like: one placement or one country produced most of the clicks and none of the orders. Exclude it, let the account restabilise for several days, and re-read.
Layer 3: The Offer — What You Are Asking Them to Buy
This is the layer people skip because it is the one that cannot be fixed with a setting. It is also the one where the answer is most often found when the first two layers are genuinely clean.
Cold traffic from a social feed is the hardest audience in commerce. These people were not looking for you. They were looking at their friend's holiday photos. In the seconds after the click, they are deciding whether a company they had never heard of thirty seconds ago deserves their card details. Every weakness in the offer is amplified by that context.
Price against the shelf next door
Open a private browsing window and search for your product the way a customer would. Look at what comes back: marketplaces, big retailers, three competitors you had not thought about. If your price is 30% above the visible alternatives and your page does not explain why in the first screen, most visitors will leave to compare and not come back. This is not a landing page problem. The page is working. The offer is losing an argument the visitor is having in another tab.
The fix is rarely "cut the price". It is usually to make the comparison unnecessary — a bundle that has no direct equivalent, a guarantee that removes the risk of choosing wrong, a service component, a stated reason the cheap version is cheap. If you genuinely have no answer to "why not the cheaper one", you have found something more important than an ad problem.
The size of the ask
There is a rough ceiling on what a stranger will spend on a first purchase from an unfamiliar brand in one sitting, and it is lower than most owners want it to be. It varies enormously by category, so no published figure would help you. What helps is the question: is my entry price the smallest sensible thing this person could buy from me? Plenty of accounts convert badly on cold traffic and beautifully on returning traffic, purely because the first purchase asked for too much commitment.
Three structural options, in rough order of how often they work: a genuinely lower-priced entry product; a strong risk-reversal on the main product, such as free returns stated in the ad itself; or accepting that the first click is not meant to sell and building a retargeting sequence that does. That last option changes what you measure — the first campaign is now buying qualified attention, not sales — and it only works if your retargeting actually reaches the people it thinks it does.
Clarity, which is not the same as persuasion
Read your own product page as if you had arrived from an ad with no context, and answer six questions out loud: What is this exactly? What does it cost, including shipping? When will it arrive? What if it is wrong? Who else bought it? Who are you? If any answer requires scrolling past the second screen or clicking into a policy page, you have a clarity problem, and clarity problems look exactly like conversion problems in the data.
What "cleared" looks like: your price is defensible against what a customer would find in ninety seconds of searching, the first purchase is a small enough step to make in one sitting, and all six questions are answered above the fold or immediately below it. What "found it" looks like: you cannot answer "why not the cheaper one" without a long paragraph.
Layer 4: The Landing Experience — Speed, Phones, Friction, Trust
Now, and only now, does the page itself get examined. And when it does, examine it in the condition your customers actually meet it: on a mid-range phone, on mobile data, with a cold cache, arriving from an in-app browser rather than Safari or Chrome.
Speed, measured properly
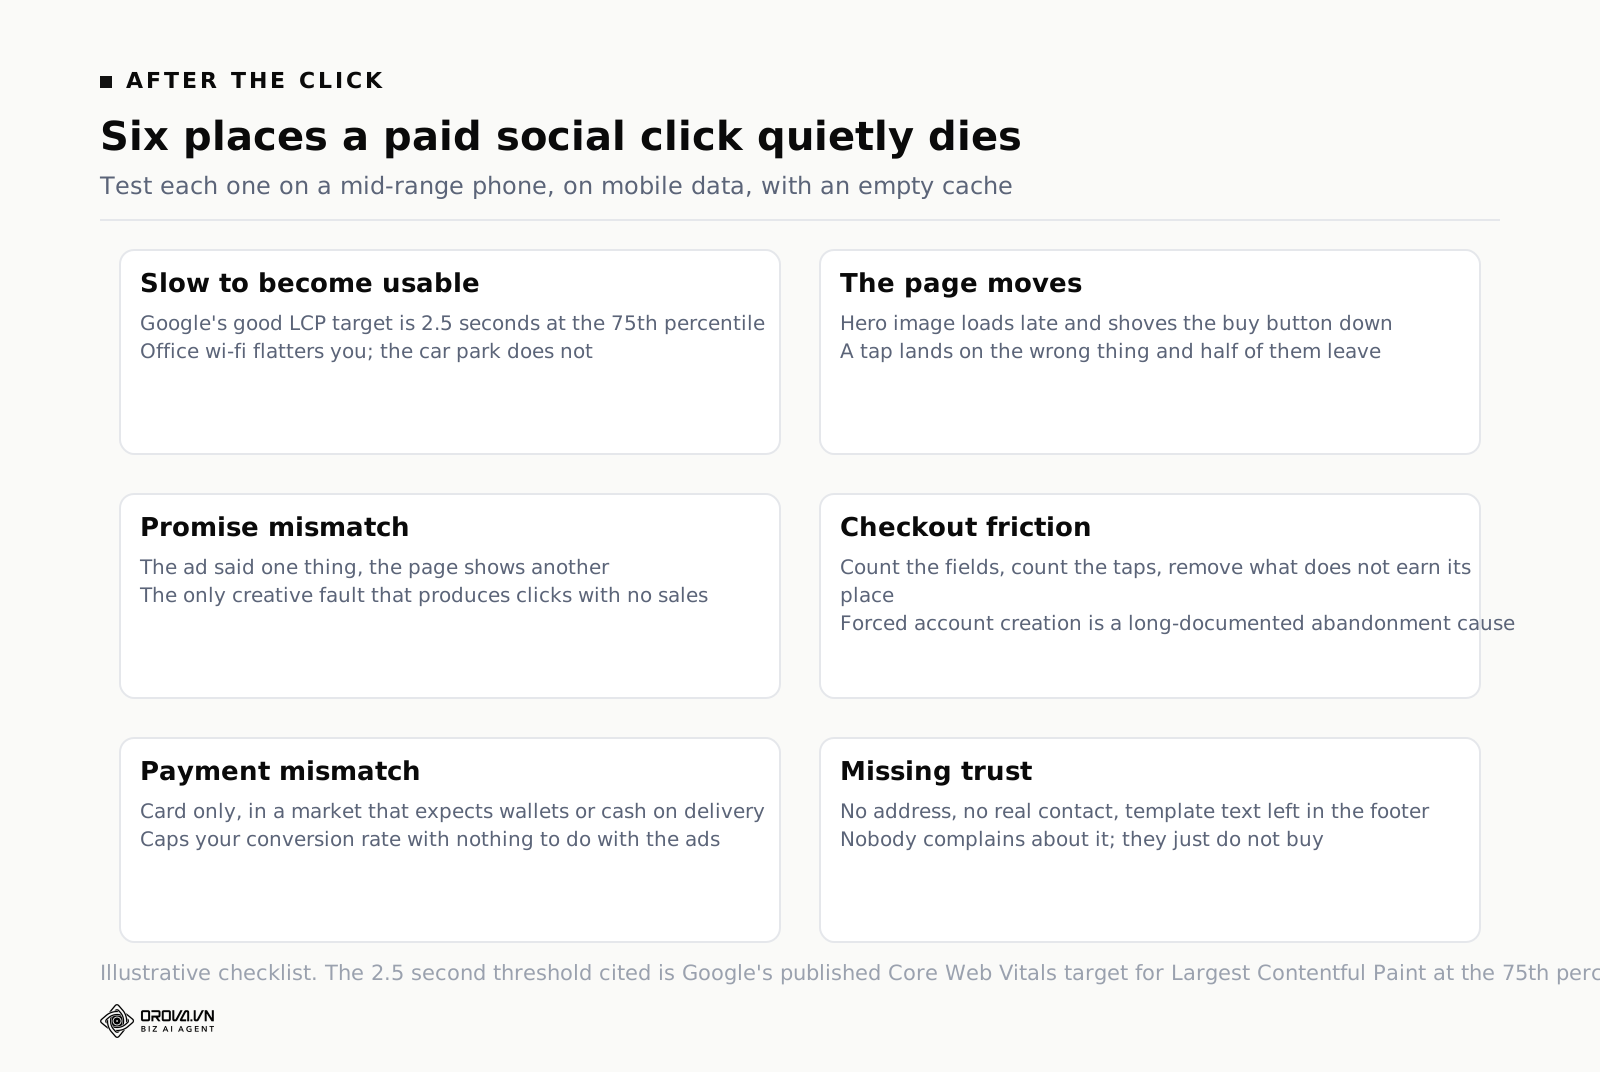
Google's Core Web Vitals documentation sets the "good" threshold for Largest Contentful Paint at 2.5 seconds, measured at the 75th percentile of real users. That last part is the part people ignore. A page that loads in 1.8 seconds on your office fibre connection might take five or six on a phone on 4G in a car park — and the car park is where a lot of feed browsing happens.
The specific failure that produces the clicks-but-no-sales pattern is a page that is slow to become usable rather than slow to finish. Text appears, someone starts reading, then a hero image loads and shoves the buy button down the screen. Cumulative Layout Shift, in Google's terminology. The visitor taps where the button used to be, hits something else, and half of them leave. Your analytics records a session. Your ad account records a click. Nothing records the frustration.
Check with a field-data tool rather than a lab test if you can, because lab tests run on simulated conditions that flatter you.
The phone test, done honestly
Give your phone to somebody who has never seen the site, open the ad, and ask them to buy something while you stay quiet. Do not help. Do not explain. Watch where their thumb hesitates. Ten minutes of this is worth more than a month of heat-map screenshots, and it consistently surfaces things nobody on the inside can see: a font too small to read in daylight, a variant selector that looks like decoration, a discount field that makes people leave to hunt for a code they never find, a delivery estimate buried in a tab.
Friction in the checkout itself
Count the fields. Count the taps from "add to cart" to "payment confirmed". Then remove the ones that do not earn their place. Company name on a consumer order. Address line 2 as a required field. A mandatory account before purchase — Baymard Institute's checkout research has flagged forced account creation as a recurring abandonment cause across its studies for years, and it remains one of the easiest wins available to a small store.
Also check what payment methods you accept against what your audience uses. In several markets a large share of buyers will not use a card on an unfamiliar site and expect a wallet, a bank transfer, or cash on delivery. If those options are missing, your conversion rate is capped by something that has nothing to do with your ads.
Trust, which is invisible until it is missing
A stranger deciding whether to give you money is looking for reasons not to. Missing trust signals do not annoy people; they just quietly tip the decision. The list is boring and it works: a real returns policy in plain language, a physical address, a contact method that is not a form, reviews that read like humans wrote them, a padlock and a checkout that looks like other checkouts. Anything that looks even slightly like a template that was never finished — placeholder text in the footer, a broken policy link, a 2019 copyright date — costs you sales you will never see in a report.
What "cleared" looks like: a stranger completed a purchase on a phone without asking you a question, and field data shows the page becoming usable quickly for most real visitors. What "found it" looks like: your tester got stuck, or you did, or the page shifted under your thumb.
Layer 5: Timing — The Consideration Window
The last layer is the one where "nothing is broken" is a legitimate answer.
Some purchases are not made on first contact and never will be. A £40 consumable bought on impulse and a £2,000 piece of equipment that requires spousal approval are different physical events. If your product sits at the considered end, a seven-day window is simply the wrong instrument, and every conclusion you have drawn inside it is premature.
Find your real lag before you judge your ads
You do not need to guess this. Your back office knows. Take last quarter's orders, look up when each customer first landed on the site, and plot the distribution of days between first visit and first order. Most shops that do this exercise are surprised: a chunk buys on day zero, then there is a long tail that goes on much further than anyone expected, and the median sits several days out.
Once you know the shape, two things follow. First, your reporting window must be at least as long as the bulk of that distribution, or you are reading the story before it finishes. Second, the "no sales" week you are panicking about may simply be a week whose sales have not happened yet. The mechanics of that delay, and how it distorts every Monday-morning decision, are worth understanding properly before you cut a campaign that was working.
Consideration is a thing you serve, not a thing you wait out
If your lag is long, the fix is not patience alone. It is building the middle of the journey deliberately: a retargeting audience that reaches people who viewed but did not buy, an email or messaging capture that gives you a second conversation, content that answers the questions people research during the gap. A cold campaign judged on same-week sales, for a product that takes two weeks to decide on, will always look like a failure and will always be cut too early.
Telling "No Result Yet" Apart From a Real Problem
Before you conclude anything at any layer, check whether you have enough data to conclude it. This is where most small accounts genuinely go wrong, and it is arithmetic rather than opinion.
If a page's true conversion rate were 2%, then the chance of seeing zero sales in a given number of clicks is 0.98 raised to that number. At 50 clicks, zero sales happens about a third of the time by luck alone. At 100 clicks it still happens roughly one time in eight. You need about 149 clicks before "zero sales" becomes unlikely enough — under 5% — to be treated as evidence of a genuine problem rather than a bad run.
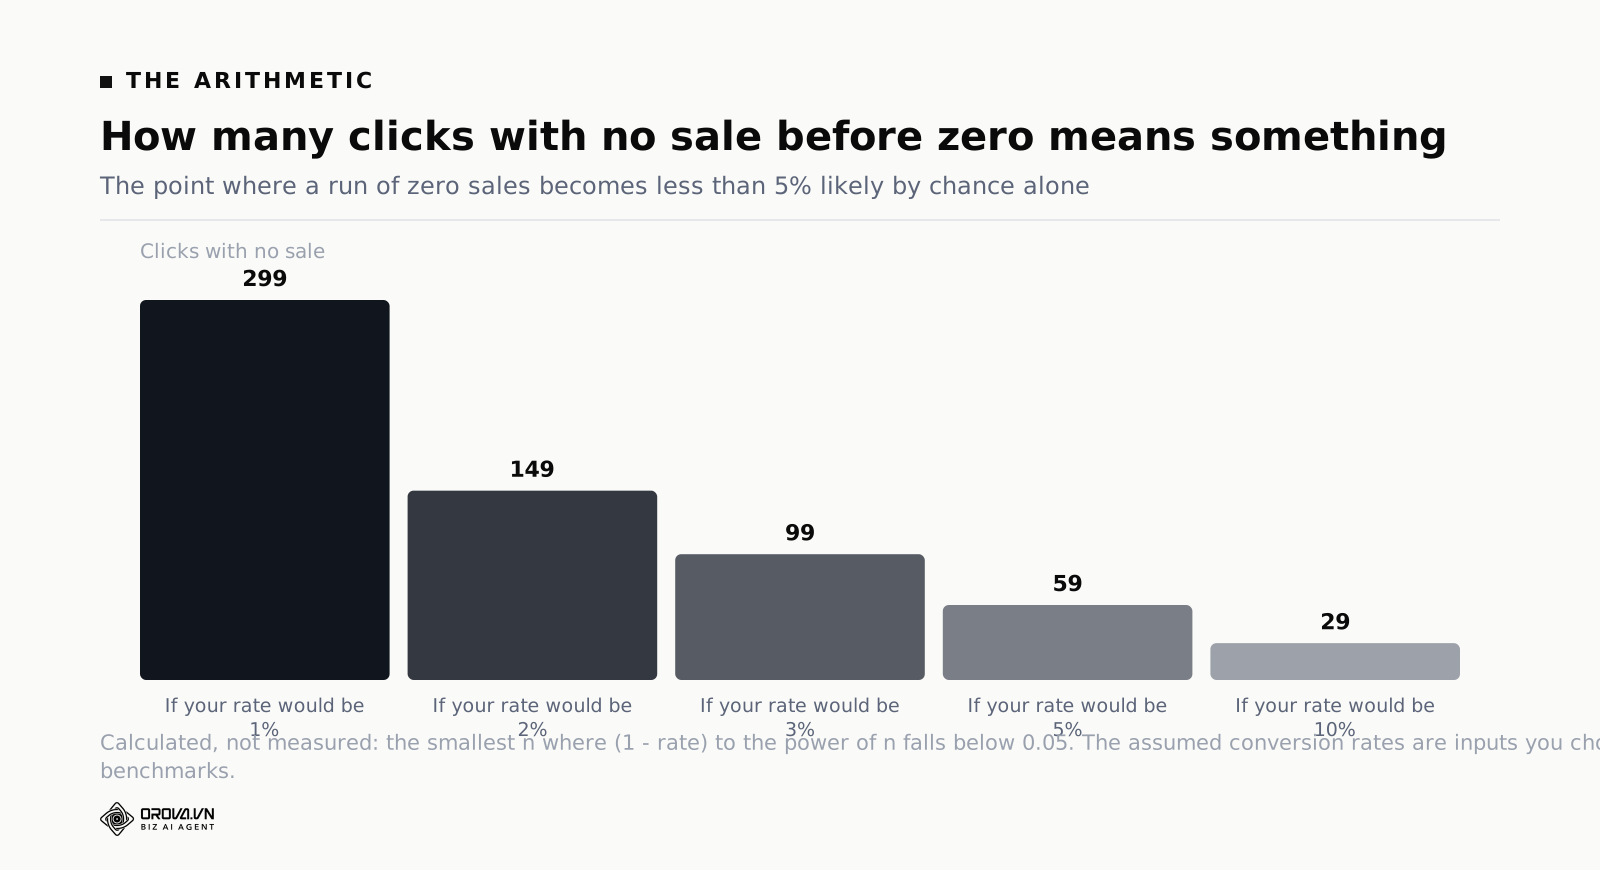
Run the same arithmetic across a few assumed rates and the practical rule falls out. The lower your realistic conversion rate, the more traffic you need before silence means anything. For a shop that would convert at 1% on a good day, three hundred clicks with nothing is the point where you should start believing the data. Below that you are reading noise, and every change you make on the basis of noise adds a fresh learning period on top of the last one.
Three related sanity checks:
- Count landing page views, not clicks. If a third of your clicks never reached the page, your effective sample is a third smaller than the number you were about to make a decision on.
- Do not judge inside the learning phase. A newly launched or significantly edited ad set is still calibrating. Every edit restarts it. Owners who "optimise" daily can keep an account in permanent recalibration for months, and the account never gets a fair run.
- Beware the denominator you chose. Twelve conversions split across six ad sets is two each. Nothing in that table means anything, no matter how confidently the percentages are displayed to two decimal places.
Four Ways People Work Out of Order and Lose Weeks
Changing creative while measurement is broken
The most expensive mistake, because it feels the most productive. New creative, new week, new numbers — read through a pixel that is under-reporting or double-counting. You will pick a winner, and the winner will be whichever ad happened to reach the segment your tracking sees best. Then you scale it, the reported cost per purchase gets worse, and you conclude the ad "fatigued". It never worked in the first place; you just measured it wrongly and then measured it wrongly at higher volume.
Changing everything in the same week
New audience, new creative, new landing page, new budget, all on Monday. On Friday the numbers moved. You have learned precisely nothing about why, and you have restarted the learning phase on every ad set simultaneously. One change per cycle, cycle long enough to matter. It feels slow. It is the fastest available route, because it is the only one that produces knowledge you can keep.
Cutting the campaign before the lag has run
You kill a campaign on day four for having no sales. On day nine, four orders arrive from people who first saw that campaign — and they land in your reports as organic or direct, so the campaign never gets the credit and your belief that it failed hardens into a fact. Do this three times and you will have concluded that paid social does not work for your product, on the basis of three experiments that were stopped before they finished.
Trusting a percentage built from single-digit numbers
Two conversions from one ad set and none from another does not mean the first is infinitely better. Ads Manager will still print a conversion rate for both, to two decimal places, in a confident-looking column. The interface does not distinguish between a number and a rumour. That is your job.
The Weekly Routine That Keeps This From Recurring
Diagnosis is a one-off. Not needing to diagnose again is a routine. The version below is deliberately boring and takes well under an hour a week for a small account.
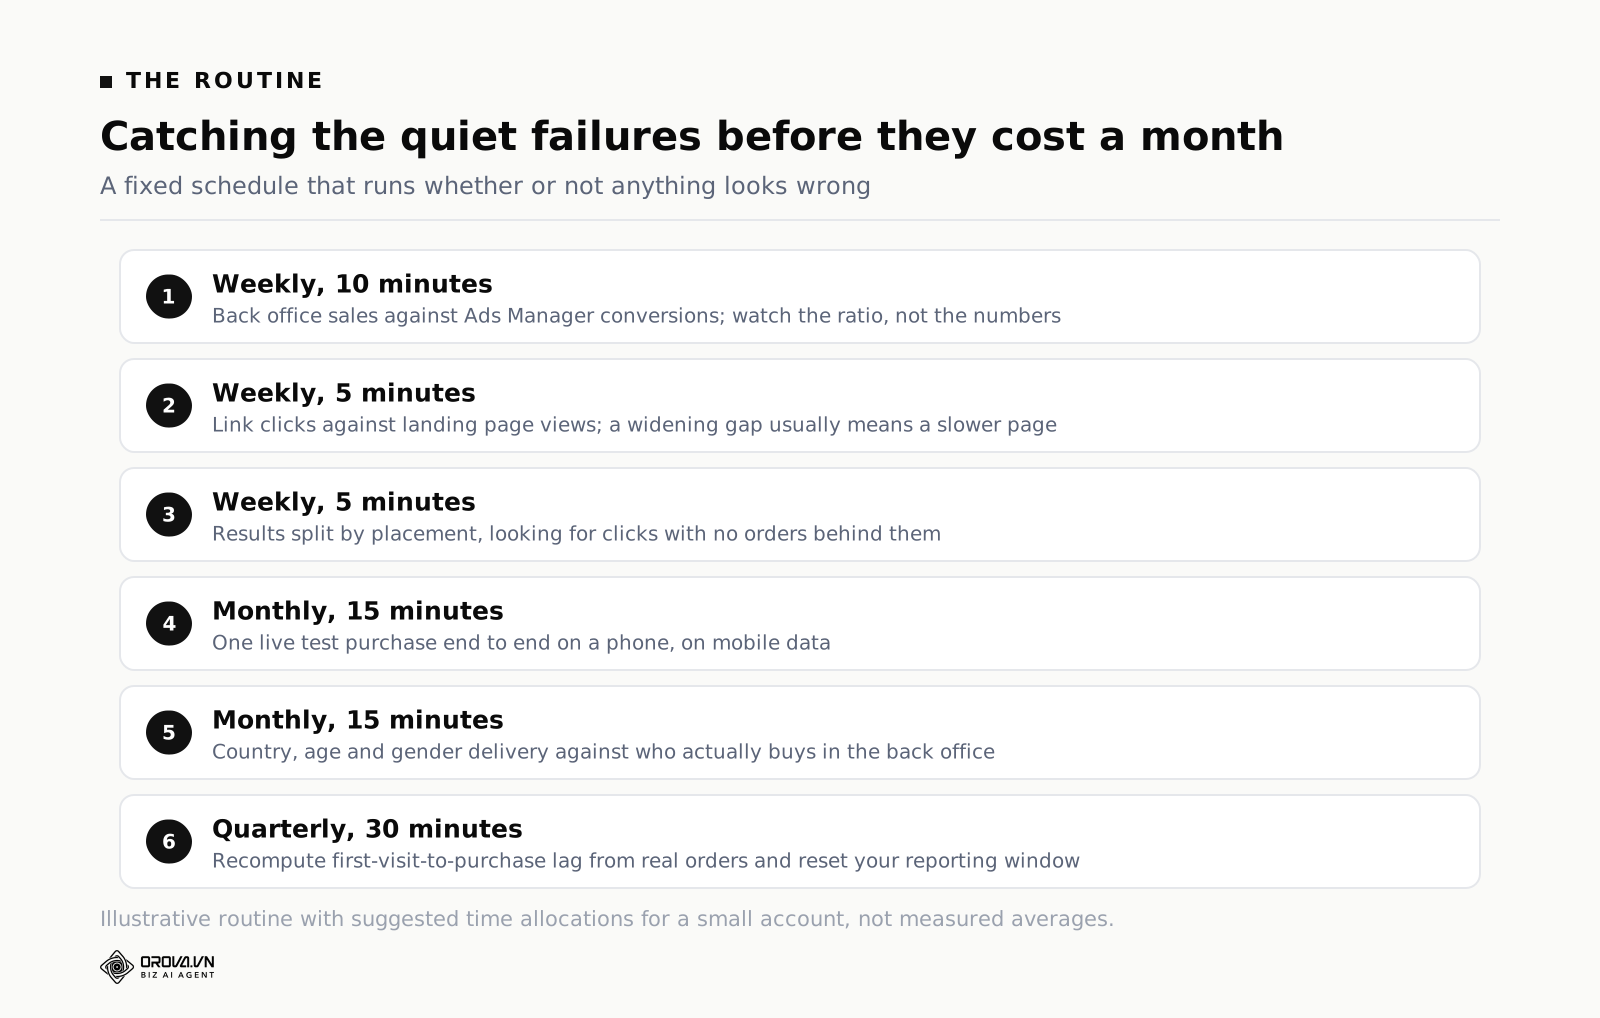
| Cadence | Check | What you are looking for |
|---|---|---|
| Weekly | Back office sales versus Ads Manager conversions, same window | The ratio between them changing — that is the early warning of tracking breaking |
| Weekly | Link clicks versus landing page views | The gap widening, which usually means the page got slower |
| Weekly | Results by placement | One placement absorbing clicks and producing no orders |
| Monthly | A live test purchase, end to end, on a phone | Anything that broke silently during a theme or plugin update |
| Monthly | Country, age and gender breakdown against back-office customers | Delivery drifting toward a cheap pocket that does not buy |
| Quarterly | Recompute the first-visit-to-purchase lag from real orders | Whether your reporting window still matches how people actually buy |
Two habits make the routine survive contact with a busy week. Write one line of commentary next to each number, every time — "placement split normal, 3 orders in back office vs 2 reported" — because the commentary is what turns a spreadsheet into a memory. And run the checks in the same order, from the same screens, on the same day. Consistency is what lets you spot a change; a check performed differently each time can only ever show you a number, never a trend.
When a Tool Earns Its Place, and How Far Manual Goes
All five layers can be worked by hand, and for one account with one platform and a few campaigns, by hand is correct. There is nothing here that requires software. What software buys you is frequency and memory: the checks happening every day instead of the days you remember, and last month's reasoning still being readable next month.
The point where manual stops scaling is well documented, and it is not the point most people expect — we broke down where the hours actually go in PPC Ad Management: What It Involves and What It Costs. Roughly: one platform is fine, two is annoying, three across several projects stops being a checking routine and becomes a job.
That is the gap Orova Ads was built for. It connects Google Ads, Meta and TikTok through each platform's own login, pulls campaigns, ad sets, ads and daily numbers into one table, and runs rules you write in ordinary sentences — "if cost per result on this campaign goes above X for three days, tell me" — on whatever schedule you set. Behind those rules sit 214 optimisation action codes, 58 of them for Meta, each in two flavours: an advisory code where the AI explains and you act, and an execution code where the AI is allowed to act for you. The default is advisory only, and there are three operating modes — advisory, hybrid and automatic — so nothing touches your account until you decide it should. Every suggestion lands in a history tab with its reasoning and the numbers behind it, approved, rejected or expired, fully logged. For the measurement layer specifically, each project gets its own Conversions API webhook so your CRM can send real conversions back to the platform rather than relying on a browser pixel to survive.
Two design decisions in that product are worth stealing even if you never use it, because both came from real failures. First, a value of zero must be treated as a real number, not as an empty field — a threshold of zero is a legitimate instruction, and software that quietly ignores it will skip the exact check you cared most about. Second, an account holding several currencies should be blocked from mixing them rather than helpfully converted, because a wrong exchange rate makes every cost threshold downstream wrong in a way nobody notices for weeks. Both are worth remembering the next time you build a spreadsheet that watches your account.
Frequently Asked Questions
How many clicks should I get before deciding my Facebook ads are not converting?
Work backwards from the conversion rate you would consider acceptable. If a 2% rate would be fine, roughly 149 clicks with zero sales puts you below a 5% chance that the drought is luck. If your realistic rate is 1%, you need close to 300. Count landing page views rather than clicks, since some of your clicks never arrived.
Ads Manager shows conversions but my shop shows none. Which is wrong?
The shop is right; it is the only one of the two that knows money moved. The usual causes are duplicate events from running the pixel and the Conversions API without deduplication, view-through conversions being counted inside your window, or a Purchase event firing on a page it should not — an add-to-cart, a thank-you page reachable without paying, or a test order left running. Place one real order and trace it end to end.
Should I pause the campaign while I fix the landing page?
Usually no, if you are only making a change or two and the spend is modest. Pausing throws away the delivery learning you have accumulated and restarts it when you resume. If the page is genuinely broken — checkout failing, page not loading on mobile — then pause, because you are paying for clicks that cannot possibly convert. Otherwise let it run at a reduced budget and ship the fix.
Can bad creative cause clicks with no sales?
Only in one specific way: when the ad promises something the page does not deliver. Everything else about creative is a click-side variable. If the creative is winning clicks at a price you accept, it has done its job, and blaming it is the most common way people spend a month fixing the wrong thing.
My conversion rate collapsed after iOS updates. Is that measurement or reality?
Almost always measurement in the first instance, and then reality afterwards. Reported conversions fall because a share of users cannot be observed; then real performance often follows, because the optimisation engine is learning from a smaller and less representative signal. The response is the same for both: send server-side conversions through the Conversions API so purchases that genuinely happened are reported even when the browser cannot report them, and reconcile against your back office rather than against the platform.
How long should I give a fix before judging it?
Long enough to clear the learning phase and cover your first-visit-to-purchase lag, whichever is longer. For most small accounts that means a minimum of a week, often two, with no further edits in between. If you cannot resist editing, you have not given the fix a chance and you will not learn anything from it.
What to Do This Week
Do not open the creative folder. Do this instead, in this order, and stop at the first layer that fails.
- Today, twenty minutes. Write down last week's sales from your back office, your analytics and Ads Manager, side by side. Then place one real test order on your phone, on mobile data, and confirm the event arrives with the correct value.
- Tomorrow, fifteen minutes. Break results down by placement and by country. Add the outbound clicks and landing page views columns. Exclude anything delivering clicks and no orders.
- This week, thirty minutes. Search for your own product as a customer would, and write one honest sentence explaining why someone should buy yours instead of the cheapest result. If you cannot write it, that is your finding.
- This week, ten minutes. Hand your phone to someone who has never seen your site and ask them to buy something. Say nothing while they do it. Write down every hesitation.
- Before you conclude anything. Count your landing page views against the arithmetic above. If you are under the number, you do not yet have a problem to solve — you have a sample to finish collecting.
Most accounts stop at step one or two. That is not a disappointing outcome; it is the point. The layers are ordered by how often they are the culprit and how cheaply they can be checked, so the fastest route to an answer is also the least glamorous one. The creative can wait until the machinery underneath it is telling the truth.
When You'd Rather Not Chase This by Hand
Working through five layers of possible causes by hand takes real time — pulling reports, comparing numbers across platforms, testing landing pages, watching where people actually drop off. Most business owners can do it once they know the order to follow, but doing it every time a campaign underperforms is a different story, especially when you're also running the rest of the business.
This is the kind of checking Orova Ads is built to handle for you, working through measurement, traffic, and landing experience automatically so you spend less time digging through dashboards and more time deciding what to fix. If that sounds useful, it's worth a look.
Run the diagnostic every morning
Orova Ads checks the account daily and tells you which of these five layers is leaking.
Start for free