
Marketing Reporting Tools: Solving the Right Problem
Every team that runs more than one marketing channel eventually goes shopping for marketing reporting tools, and most of them buy the wrong thing — not a bad product, but a product solving a different problem than the one they have. The symptom that sends people looking is almost always the same: a monthly report that takes half a day to assemble and that nobody acts on afterwards.
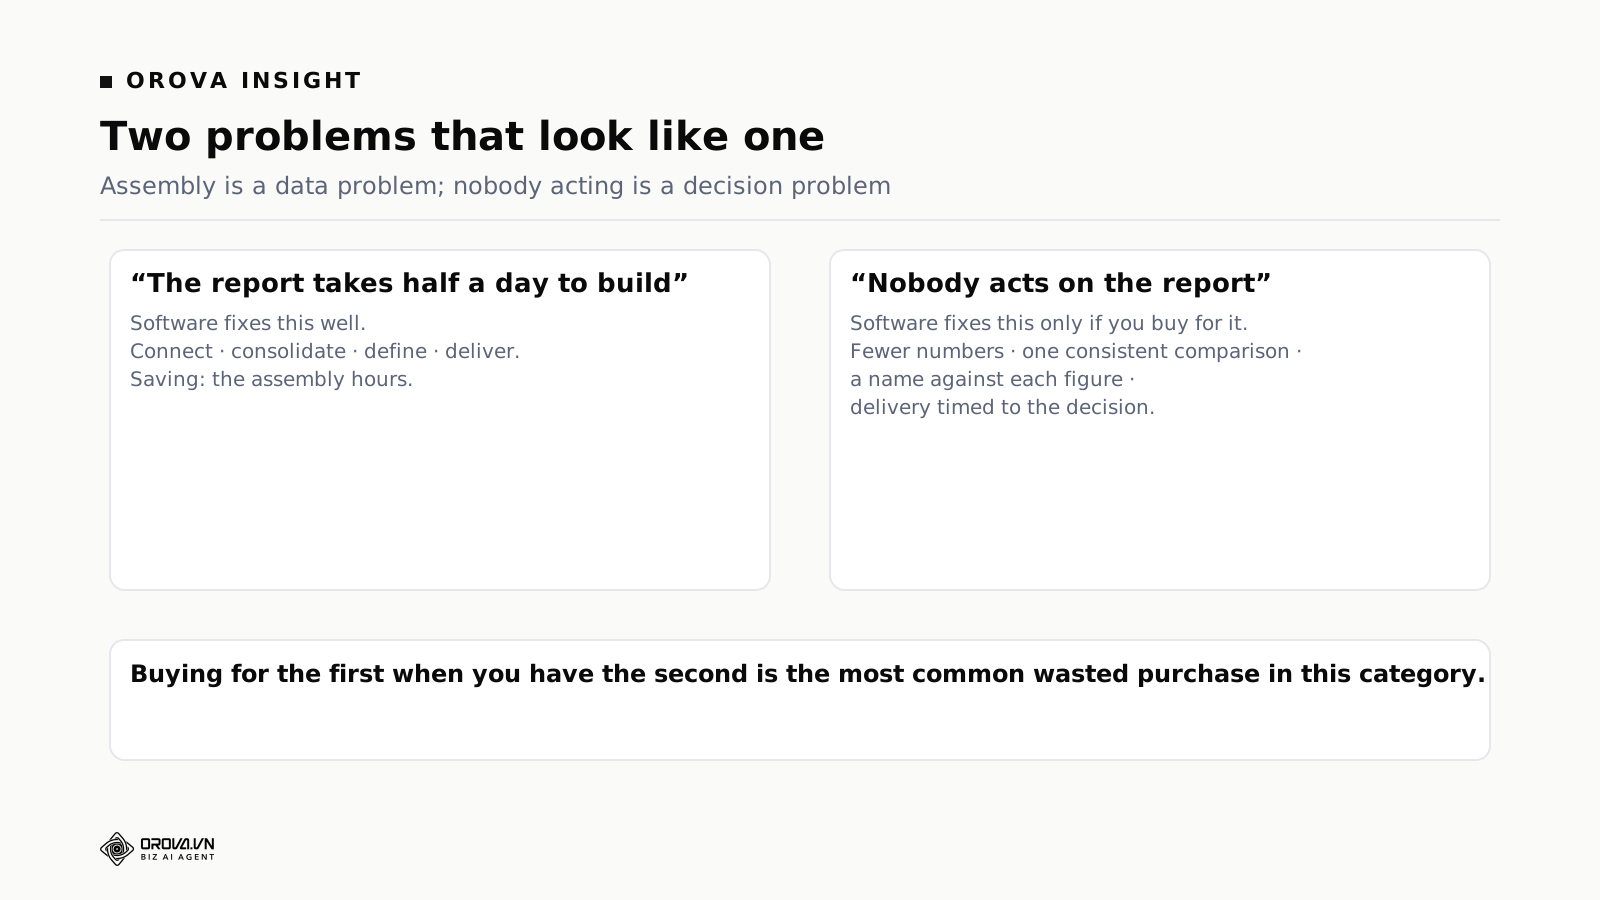
Those are two separate problems. Assembly is a data problem and software fixes it well. Nobody acting is a decision problem, and software fixes it only if you buy for that specifically. This article is about telling them apart before you spend anything, what the category genuinely does, and the questions that separate one option from another.
What do marketing reporting tools actually do?
They pull data from the platforms you advertise and publish on, put it in one place, apply your own metric definitions rather than each platform's, and present it on a schedule without anyone assembling it. Some also send the result to people who will never log in. That is the category: connection, consolidation, definition, and delivery.
What they do not do, and this is where expectations go wrong, is decide what the numbers mean. A tool can tell you cost per acquisition rose eighteen per cent. Whether that is a problem depends on seasonality, on what you were testing, on what changed in the mix — context that lives outside every platform.
The four jobs, and which ones you are actually buying
Connection
Getting data out of each platform reliably. This sounds trivial and is the part that quietly consumes engineering time when teams build it themselves. Platform APIs change, tokens expire, rate limits bite during month-end when everyone is pulling at once, and a connection that silently returns partial data is worse than one that fails loudly.
The number of platforms matters less than whether the ones you use are covered properly. A tool with sixty connectors, three of which are the ones you need and one of which is shallow, is worse than a tool with twelve done well. Check the depth: does the connector return the dimensions you report on, or only top-line totals?
Consolidation
Putting several platforms in one view. Useful, and the place where the most confident errors are produced, because summing metrics across platforms that count differently gives you a total that looks authoritative and is wrong.
A conversion in one platform's reporting and a conversion in another's are counted under different attribution rules and different windows. Added together, they typically overstate — sometimes substantially, because the same sale is claimed twice. Any consolidated view has to state which definition it is using. If the interface does not say, assume it has simply added them and treat the total as an upper bound rather than a measurement.
Definition
This is the job most buyers undervalue and the one that produces the most durable benefit. Every platform reports metrics its own way. Your business has its own definitions — what counts as a lead, which costs go into acquisition cost, whether returns are netted off.
A tool that lets you define metrics once, centrally, and have every report use that definition is doing something no spreadsheet does reliably. The spreadsheet version drifts: two people build two versions of the same metric, both defensible, and six weeks later two reports disagree and nobody can reconstruct which is right.
Delivery
Getting the result to people on a schedule. The value here is not convenience but consistency — a report that arrives every Monday gets read, and one that arrives when someone remembers does not. Scheduled delivery is also what makes it safe to stop building the report manually, which is the actual saving.
The distinction that decides your purchase
Products in this category cluster into three shapes, and the words on the homepage do not reliably tell you which you are looking at.
| Shape | What it optimises for | Right when |
|---|---|---|
| Client reporting | Producing many similar reports for different audiences, on brand, on schedule | You are an agency, or report to several stakeholders who each want their own view |
| Internal dashboard | One team looking at the same numbers continuously, defined their way | You have channels to run and decisions to make weekly |
| Data pipeline | Moving platform data into a warehouse for someone else to model | You have an analyst and questions that outgrow prebuilt reports |
Buying a client-reporting product for internal decisions gives you beautiful documents and no working view. Buying a dashboard when you needed forty branded client reports means someone rebuilds the same thing forty times. And buying a pipeline when nobody will model the data leaves you with a warehouse full of rows and no report at all — the most expensive of the three mistakes.
Where reports fail to produce decisions
If assembly is solved and nothing changes, the failure is in the report's design rather than its data. Four causes, in rough order of frequency.
Everything is on it
A report with sixty metrics is a reference document, and reference documents get filed. Nobody scans sixty numbers weekly looking for the four that moved meaningfully; they glance at the two they already worry about and close it.
The fix is uncomfortable because it means deleting things people asked for. A weekly report should carry the numbers that could change a decision this week — usually between five and nine. Everything else belongs in a monthly review or in a dashboard people visit when they have a question, which is a different artefact with a different job.
No comparison
A number without a reference point is not information. Cost per acquisition of a given figure tells you nothing until it sits beside last month, the same month last year, or the target. Reports that show current values only force every reader to supply their own context from memory, and memory supplies whatever confirms the mood in the room.
Pick one comparison and use it consistently. Changing the comparison between reports — this month against last, then against target, then against last year — is how a report becomes an instrument for arguing rather than for deciding.
No owner per number
A metric nobody owns is a metric nobody explains. The most useful column in most weekly marketing reports is not a number at all — it is a name. When the figure moves, somebody is expected to know why, and knowing that in advance changes how carefully it gets watched.
It arrives after the decision window
A weekly report delivered on Thursday afternoon reports on a week whose spending decisions were made on Monday. It is history rather than input. Match the delivery to the moment the decision gets made, which for most teams means Monday morning or nothing.
Attribution: the thing reporting tools cannot settle
Any consolidated marketing report eventually runs into the question of which channel deserves credit, and no tool in this category resolves it. They can only present a chosen convention consistently, which is genuinely valuable and different from being right.
The practical position that survives contact with reality has three parts.
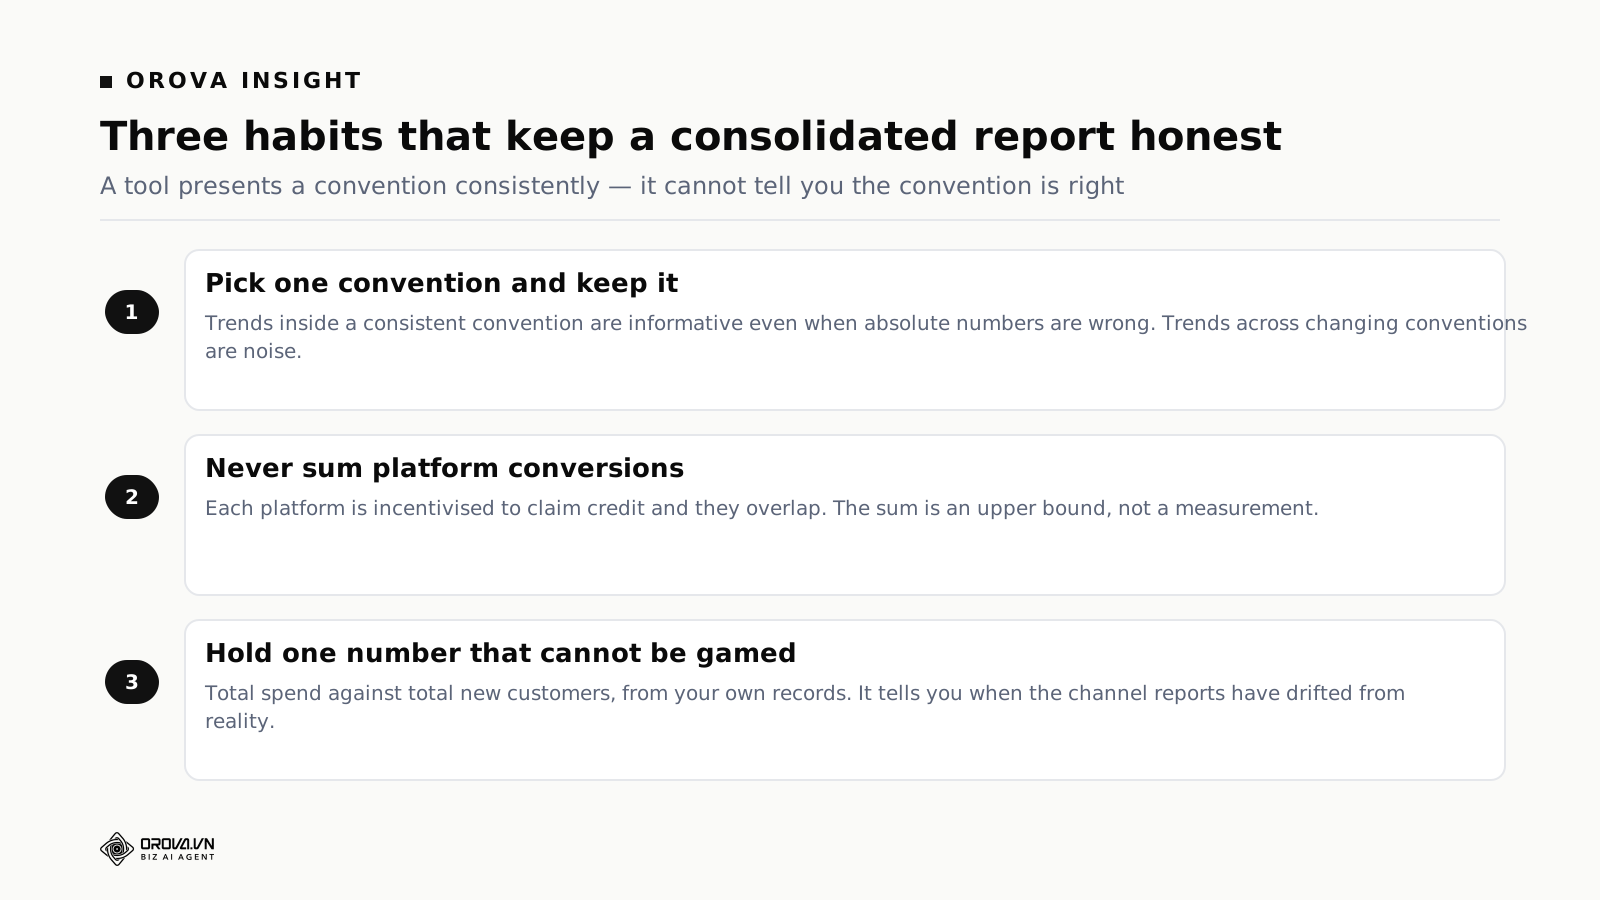
Pick one convention and keep it. Whether it is last click, a platform-reported view, or something custom matters less than that everyone is reading the same convention over time. Trends within a consistent convention are informative even when the absolute numbers are wrong; trends across changing conventions are noise.
Never sum platform-reported conversions. Each platform is incentivised to claim credit, and they overlap. The sum is an upper bound. If a total is needed, take it from a single source that sees all channels — your own analytics or your order system — and use platform numbers for within-channel comparisons only.
Hold one number that cannot be gamed. Total spend against total new customers, from the business's own records, over a month. It is crude, attributes nothing, and it is the number that tells you whether the whole operation is working when the channel-level reports disagree. Teams that report only channel-level metrics can have every channel looking healthy while the blended figure quietly deteriorates.
How Orova Insight is built, and what it is not
Insight is the reporting module inside Orova. Being specific about its shape is more useful than a recommendation.
Twelve sources connect directly: GA4, Search Console, Google Ads, Meta pages, Meta Ads, Instagram, Threads, TikTok, TikTok channels, YouTube, LinkedIn and LinkedIn Ads — plus Zalo, which matters if you operate in Vietnam and is absent from most Western products.
Google Sheets is a first-class source, not an export target. Sheets sync in, with support for merging tabs and multi-level headers — the shape real spreadsheets actually have rather than the tidy single-header table most importers assume. This matters more than it sounds, because in most companies a meaningful share of the numbers that belong in a marketing report live in a spreadsheet maintained by a person: offline sales, agency invoices, targets, a manually tracked pipeline.
You can declare your own API source. If a number lives in a system nobody has built a connector for, it can be brought in without waiting for a vendor roadmap.
Dashboards are built by dragging, and they are versioned. There is version history with restore, snapshots, sharing, and a live view for people without accounts. The versioning is the part experienced teams appreciate: a dashboard that several people edit will eventually be broken by someone, and without history the fix is a rebuild.
There is an analyst you can ask questions of, which answers in charts as well as text, and AI widgets that sit on a dashboard. This is the part that addresses the decision problem rather than the assembly problem — a question asked in words is a much lower barrier than building a new view to answer it.
Reports send themselves on a schedule, with an option to send immediately, and you can define your own metrics centrally rather than per dashboard.
What Insight is not
It is not a business intelligence platform in the sense that Power BI or a warehouse-plus-modelling-layer is. There is no data warehouse, no SQL modelling layer, no semantic layer for an analyst to build against. If your requirement is joining marketing data to finance and product data across years and modelling it properly, this is the wrong shape of tool and you should be looking at a warehouse.
It is also not an attribution product. It presents what the platforms report and what your own sources say; it does not run incrementality experiments or media mix modelling.
Choosing between building it yourself and buying
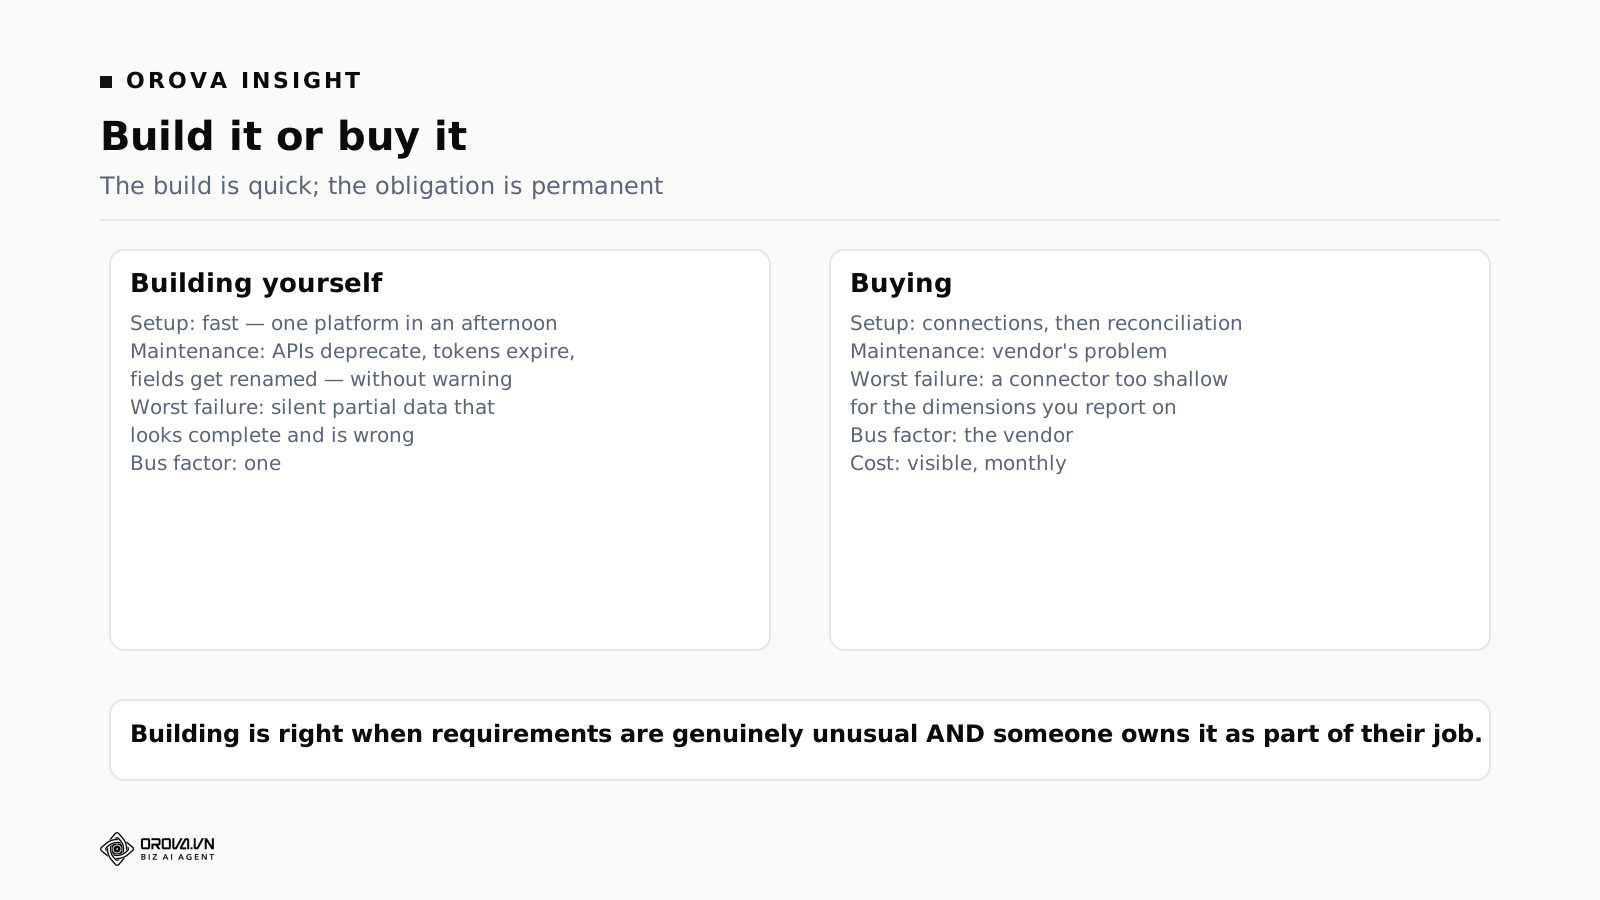
Teams with any engineering capacity consider building, usually starting from a Sheets script that pulls one platform. It is worth being clear about what that path actually costs, because the first version is genuinely quick and the cost arrives later.
The build is not the expense; the maintenance is. Platform APIs deprecate versions on their own schedule, tokens expire, and a field gets renamed. None of these are hard problems. All of them arrive without warning, usually on the morning a report is due, and they land on whoever built it regardless of what else they were doing.
Silent partial failure is the real risk. A build that breaks loudly gets fixed. A build that returns data for six of seven platforms, or drops the last three days of a month, produces a report that looks complete and is wrong. Decisions get made on it, and the error is discovered later by accident.
The bus factor is one. The person who built it holds the model in their head. When they leave or move teams, the reporting becomes an artefact nobody can safely change, and it typically gets frozen — which means it stops reflecting the business within a couple of quarters.
Building is right in one situation: your requirements are genuinely unusual, you have someone whose job includes owning it, and that ownership survives them being busy. Otherwise the honest comparison is not subscription against zero, it is subscription against a recurring obligation nobody has budgeted for.
Designing a weekly report people actually read
Once the data problem is solved, the report itself becomes the variable. A structure that works for most small marketing teams looks like this, and it fits on one screen.
One line at the top: are we on track? Spend against plan, new customers against target, cost per customer against the ceiling. Three numbers, each with a comparison. A reader who stops here should still know whether to be worried.
Then: what moved, and by how much. Only the metrics that changed more than a threshold you set in advance. Everything stable is omitted deliberately — the absence of a metric is itself information, meaning nothing here needs your attention.
Then: what we are testing. One line per active experiment with its status. This is the section that turns a report from a record into an agenda, and it is the section almost no automated report includes because no platform knows what you decided to try.
Last: the open questions. Things the numbers raised that nobody has answered yet, with a name against each. This is where a report stops being a document and starts being a meeting.
Notice that two of those four sections cannot be automated. That is not an argument against tooling — the tool removes the assembly so there is time to write the two sections that require judgement. Teams who automate the whole thing end up with a report that is complete, timely, and inert.
The metrics worth carrying, and the ones worth dropping
Every marketing report accumulates metrics, because adding one is easy and removing one requires telling somebody no. A periodic clear-out is worth the awkwardness.
Keep anything that could change a decision this week. Spend pacing, cost per customer, conversion rate at the step you are working on, and the volume of whatever is scarce — leads, applications, orders.
Keep one number the platforms cannot influence. Revenue or new customers from your own records. It is the anchor that tells you when the channel-level story has drifted from reality.
Drop impressions and reach unless brand awareness is a stated objective with a measurement plan behind it. They move with spend and tell you almost nothing about whether the spend worked.
Drop click-through rate as a headline. It is a diagnostic, useful when investigating why something changed, and misleading as a top-line indicator because it can improve while the business gets worse.
Drop anything nobody has asked about in two months. If a number has not prompted a question in eight weeks, it is decoration. Removing it makes the remaining numbers easier to see.
The test for any metric: name the decision it would change. If you cannot, it belongs in a dashboard for the curious rather than in the report people are expected to read.
Ten questions for a demo
- Connect one of my accounts now, live. Not the sample workspace. Yours, with its awkward permissions.
- Show me a connector's depth. Does it return the dimensions I report on, or only totals?
- What happens when a connection breaks? Silent partial data, or a visible failure?
- How do you handle conversions from two platforms in one total? Listen for whether they mention overlap unprompted.
- Define a custom metric in front of me, and show it appearing in two different reports.
- Import a real spreadsheet — merged cells, two header rows, the actual thing my colleague maintains.
- Break a dashboard and restore it. Is there version history?
- Send a report to someone with no account. What do they receive, and can they interact with it?
- Ask the built-in analyst a question I care about, in words, and judge the answer.
- Export everything. If leaving is hard, that is part of the price.
What to expect in the first month
Three things happen in a predictable order, and knowing the order prevents the usual mid-month panic.
Week one: the numbers disagree with what you thought. Almost always. A metric defined properly for the first time rarely matches the number people had been quoting, and the gap is usually explained by a definition rather than an error. Resist the urge to conclude the tool is wrong; reconcile one metric completely before touching the others.
Week two: you discover a channel has been reporting badly for months. A connection nobody checked, a conversion event double-counting, a campaign missing from the account structure. This is the tool paying for itself, though it does not feel like it at the time.
Weeks three and four: the report gets shorter. The first version has everything because everything was available. Then people stop reading it, and the second version has nine numbers. That contraction is the sign it is working, not a sign the first attempt failed.
Do not judge the purchase before that contraction has happened. A month of numbers arriving reliably is what makes it possible to see which numbers matter, and that is not visible at the start.
Agencies and client reporting: a different problem
If you report to clients rather than colleagues, the requirements shift enough that a tool chosen for internal use will frustrate you.
Volume of near-identical reports. Forty clients wanting the same structure with their own data and branding is a templating problem. Internal tools handle one dashboard beautifully and forty tediously.
Access without accounts. Clients will not maintain logins. Scheduled delivery and a shareable live view are not conveniences here; they determine whether the reporting gets seen at all.
Explaining rather than exploring. An internal dashboard exists to be interrogated by someone who knows the account. A client report exists to communicate a conclusion to someone who does not. The second needs commentary, and commentary is written by a person — so the tool's job is to leave time for it rather than to generate it.
The awkward metric. Every agency has a client who wants a number the platforms do not produce, usually because it was promised in a proposal. A tool that lets you define metrics centrally handles this; one with fixed metrics means a spreadsheet appears alongside the tool, and then two sources of truth exist.
The failure mode specific to agencies is worth naming: reports that are beautiful, punctual, and never discussed. If a client never asks a question about a report, they are not reading it, and the hours spent on it are pure cost. The fix is not a better-looking report. It is three sentences at the top saying what changed and what you propose to do about it — which is also the fastest way to find out whether anyone was reading.
Five mistakes that waste the purchase
Rebuilding the old report exactly
The instinct is to reproduce the spreadsheet, because it is familiar and because someone will notice if a number disappears. But the spreadsheet accumulated its shape over years of one-off requests, and reproducing it imports every one of those requests into a new system. Start from the decisions you make weekly and work backwards to the numbers those need.
Connecting everything on day one
Twelve connections produce twelve things that can break before anyone understands what normal looks like. Connect the two channels that carry most of the spend, get a week of reliable data, then add. Diagnosing a discrepancy is straightforward with two sources and miserable with twelve.
Letting definitions live in the dashboard rather than centrally
If a metric is defined inside each dashboard, you have recreated the spreadsheet's central flaw with better graphics. Definitions belong in one place, referenced everywhere. This is the single most durable benefit in the category and it is easy to configure your way out of.
Assuming the tool validates the data
It reports what the platforms return. If a conversion event fires twice, the report shows twice as many conversions, cleanly and professionally. Reporting tools make data errors more legible, not less likely — the first month's reconciliation is not optional.
No named owner
Reporting drifts. A campaign gets renamed, a new channel appears, a metric definition stops matching how the business talks. Fifteen minutes a month from a named person keeps a reporting setup honest; without it, a system that was accurate in January is quietly misleading by June and everyone still trusts it, which is worse than having no report.
A caution about dashboards that nobody owns
Dashboards proliferate. Someone builds one for a campaign, someone else copies it and changes two tiles, and within a quarter there are nine, four of which contradict each other because they were built before a metric definition changed. Nobody deletes any of them, because deleting something someone else built feels rude.
The cheap discipline is an owner and a date on every dashboard, and a rule that anything not opened in sixty days gets archived rather than kept. Archiving is reversible, which is what makes it possible to actually do. A reporting setup with four maintained dashboards is more useful than one with nineteen of unknown provenance, and the difference is entirely administrative rather than technical.
When you do not need one
Two channels, one person running them, and a monthly review that takes twenty minutes: you do not have a reporting problem. Buying a tool adds a surface to maintain and a subscription, and the twenty minutes was never the constraint.
Similarly, if the reason nobody acts on the current report is that nobody has authority to change anything, better reporting will not help. The report is not the bottleneck; the decision rights are. This sounds like an organisational platitude and it is the most common reason reporting projects disappoint — the numbers arrive faster and the same person still has to wait for approval to spend differently.
And if you are about to change your channel mix substantially, wait. Reporting built around the current mix will need rebuilding, and the month of transition produces numbers that compare badly against anything.
Getting the first dashboard right
The first dashboard sets the pattern for everything after it, and there is a shape that survives contact with a real team.
One page, no scrolling. Anything below the fold is not part of the weekly rhythm. If it does not fit, it is two dashboards with different jobs rather than one long one.
Ordered by decision, not by channel. The instinct is a section per platform, because that is how the data arrives. But nobody makes a decision about a platform in isolation; they decide where the next unit of budget goes. Order the page so that question is answerable from the top, then let the channel detail sit underneath.
Every number carries a comparison in the same tile. Not on a separate chart the reader has to correlate. The comparison and the value belong side by side, because a reader who has to look in two places will look in one.
Targets on the page, not in someone's head. If there is a ceiling for cost per customer, draw it. A number beside a threshold reads instantly; the same number alone requires the reader to remember what the threshold was, and half of them will remember it wrong.
A date stamp on the data, prominently. Platforms report with different lags, and a dashboard that mixes a source updated hourly with one updated daily will show a Monday-morning figure that looks like a collapse and is actually an incomplete day. Every serious reporting failure we have seen comes back to somebody reading a partial period as a real one.
That last point deserves emphasis because it produces the most avoidable panics. Yesterday's numbers are usually incomplete, some platforms revise figures for several days afterwards, and a report generated at 8am reflects a different reality than one generated at noon. Marking the freshness of each source is unglamorous and prevents most false alarms.
Sharing numbers outside the team
Reporting inside a marketing team is one problem. Reporting upward or outward is another, and the same dashboard rarely does both.
An internal view is dense, uses shorthand, and assumes the reader knows the account. Handed to a founder or a client, that density reads as either impressive or evasive depending on their mood, and it generates questions that take an hour to answer because the answer requires context the page does not carry.
The version that works outward has three properties. It is shorter — five numbers, not fifteen. It states the conclusion in words at the top, because a chart does not tell anyone what you think. And it says what happens next, with a name and a date, which converts a report into a commitment.
Scheduled delivery is what makes this sustainable. A report you have to remember to send is a report that gets sent when the numbers are good, which teaches the recipient exactly the wrong thing about silence.
One number that keeps everyone honest
If you take a single habit from this article, take this one. Alongside whatever channel reporting you build, keep one figure that no platform contributes to: total marketing spend against total new customers, from the business's own records, monthly.
It attributes nothing, explains nothing, and cannot be gamed. Its entire value is that it disagrees with the channel reports when something has drifted. Every channel can look healthy while this number deteriorates — that happens when platforms are each claiming the same conversions, when the mix shifts toward channels that report generously, or when a growing share of customers would have arrived anyway.
Teams who watch only channel-level metrics discover this late, usually when finance asks a question nobody can answer. Teams who keep the blended figure beside the detailed one notice within a month, and the conversation is about a discrepancy rather than about a crisis.
Why the monthly report is usually the wrong artefact
Most teams inherit a monthly report because that is the rhythm finance runs on. For marketing decisions it is close to useless: by the time a month has closed, the spending it describes is a month old and the decisions it might have informed were made four weeks ago in the absence of it.
The monthly report has a real job, but it is narrative rather than operational — explaining to people outside the team what happened and why, and setting up what happens next. Trying to make it operational produces a document that is simultaneously too late for decisions and too detailed for the audience that reads it.
Split them. A weekly operational view with nine numbers for the people running channels, and a monthly narrative with five numbers and three paragraphs for everyone else. Teams who maintain one document for both audiences end up serving neither, and the usual symptom is a monthly report that grows every quarter as each audience asks for its own addition.
A reasonable order to do all this in
Six steps, in the order that avoids the most rework.
One: write down the three decisions you make weekly. Where the next budget goes, what to stop, what to test. Everything else is downstream of these.
Two: list the numbers each decision needs. You will end up with fewer than a dozen, and several will turn out not to exist yet in any reliable form.
Three: connect the two channels carrying most of the spend. Nothing else, for a week.
Four: reconcile one metric completely against the business's own records until you understand every unit of the gap. This is the least enjoyable step and the one that determines whether anyone trusts the reporting later.
Five: define your metrics centrally, then build one dashboard that fits on a screen.
Six: schedule it, and add the two sections no tool can write — what we are testing, and the open questions with names against them.
Teams who follow that sequence tend to end up with a short report that gets read. Teams who start by connecting everything and building a comprehensive dashboard end up with something impressive that quietly stops being opened around week five, and a suspicion that the category is overrated.
The short version
Marketing reporting tools do four things: connect to platforms, consolidate the data, apply your own metric definitions, and deliver on a schedule. The third is the most undervalued and the most durable. Consolidation is where the confident errors live, because platform conversions overlap and summing them overstates.
Work out which shape you need — client reporting, internal dashboard, or data pipeline — before comparing features, because buying the wrong shape is more expensive than buying the wrong brand. Expect the first month to disagree with what you thought, expect to find a broken connection you did not know about, and expect the report to get shorter before it gets useful.
Above all, separate the two problems that sent you looking. If assembly is the pain, this category solves it. If nobody acts on the report, the fix is fewer numbers, a consistent comparison, a name against each figure, and delivery timed to the moment the decision is actually made — none of which you need to buy.
One last observation from watching teams go through this. The reporting setups that survive longest are almost never the most sophisticated ones. They are the ones somebody uses to answer a question every week, and that use is what keeps them accurate — because a report nobody reads is a report nobody notices has broken.
Related reading: combined SEO and Ads reporting in one dashboard, from dashboards to decisions, and the vanity metrics quietly wasting your time. The product is at orova.vn.
Twelve sources, one set of definitions
Orova Insight connects GA4, Search Console, Google Ads, Meta, TikTok, YouTube, LinkedIn and Zalo, syncs real spreadsheets with merged tabs, and defines metrics centrally so two views cannot disagree.
See the sources