
Getting Ad Data into Google Sheets: Three Methods Compared
It is Monday morning, Ads Manager is open, and you are waiting on a CSV so you can paste it into the tab the client report reads from. Then the same for Google Ads. Then TikTok. Then a stretch of time spent matching campaign names nobody spells the same way twice. Somewhere in there you think: there has to be a way to connect Facebook Ads to Google Sheets once and never do this by hand again.
The manual export feels free because no invoice shows up for it, but it quietly eats your week, breaks the moment someone renames a campaign, and turns into the kind of task only you know how to do correctly. Add-on tools cost money and hand your numbers to a company you have never spoken with. Building your own connector with a script saves money up front but tends to fail quietly months later, right when you least expect it, leaving whoever inherits it stuck guessing why the numbers stopped updating.
This article does not try to crown one method as the universal winner. It walks through the real setup work, the ongoing upkeep, and the point where each approach tends to break, so you can pick the one that fails in a way you and your team can actually live with, given who is around to fix it when something goes wrong.
What Is the Best Way to Connect Facebook Ads to Google Sheets?
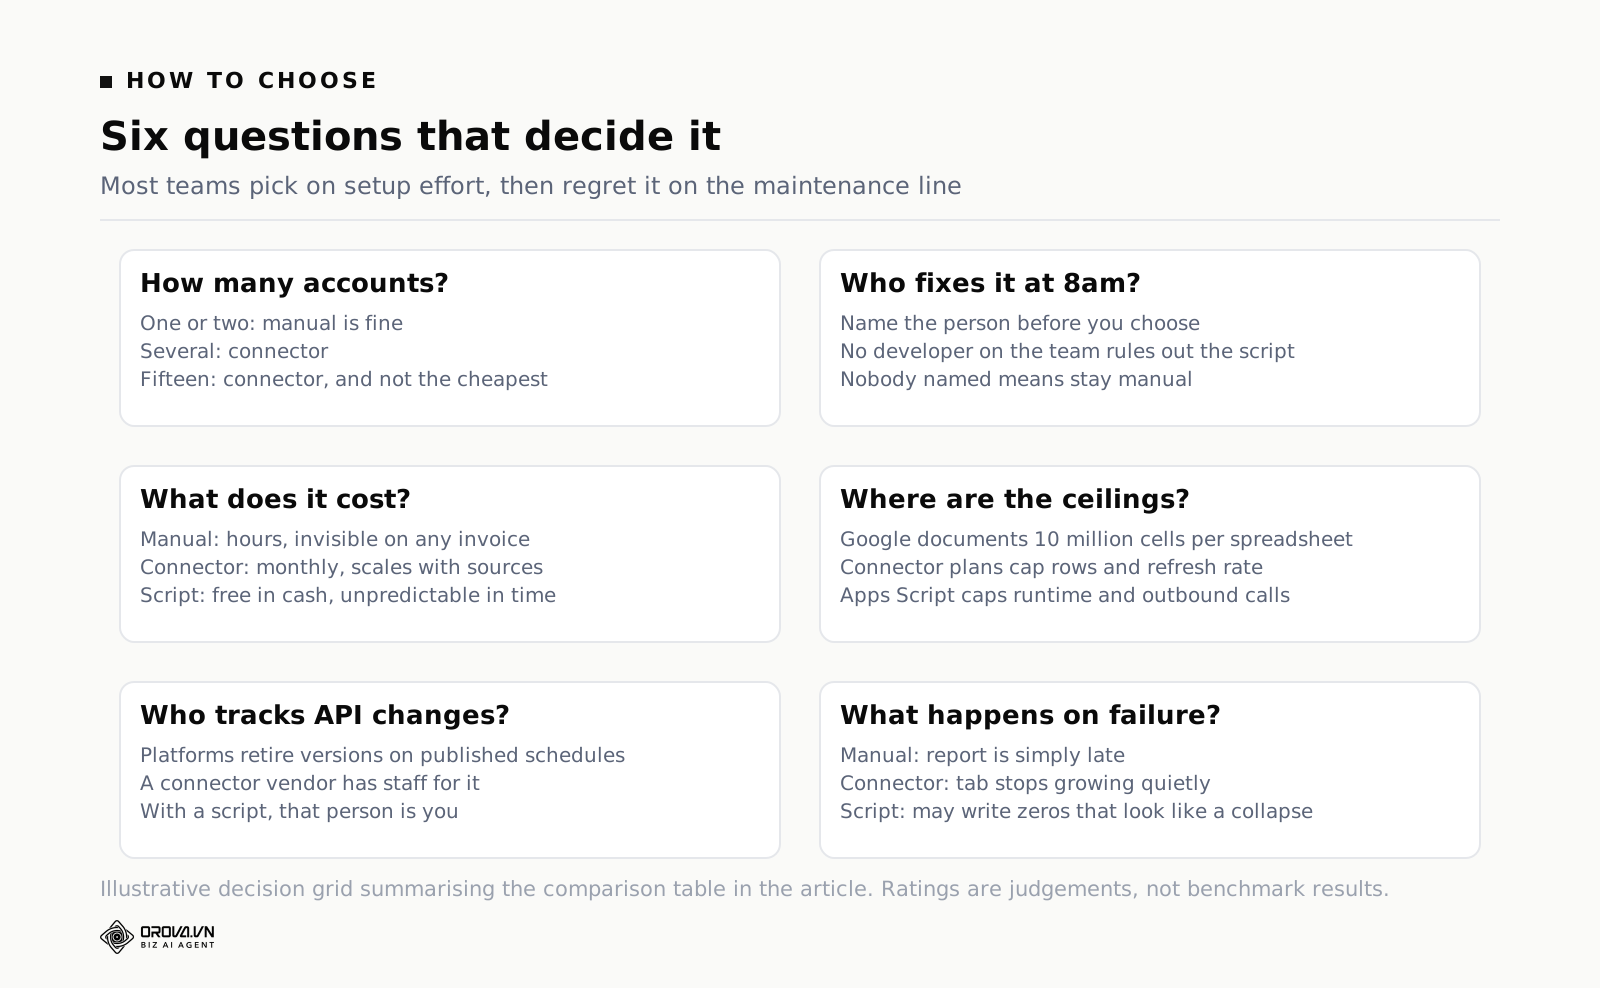
Pick by maintenance, not setup. Manual export suits one account and a monthly report. A connector suits several accounts and a team with no developer, at a monthly fee. Apps Script suits odd requirements and someone who can debug it. Whoever fixes a break at 8am should choose the method.
One note before the comparison, because it explains why this question is oddly underserved. When you check the phrase people type for this problem in Google's Keyword Planner, "connect facebook ads to google sheets" returns no volume figure at all. That does not mean nobody wants it. It means the demand is scattered across dozens of phrasings — export, import, sync, pull, automate, "get facebook ads data into a spreadsheet" — and each one individually is too small for the tool to report. The problem is common; the wording is not standardised. If you have been searching for an hour and finding mostly vendor landing pages, that is why.
The three methods, stated plainly:
- Manual export. You download a file from each platform and paste it into a sheet. Zero setup, zero cost, and a recurring tax on your calendar forever.
- An add-on or off-the-shelf connector. A third-party tool authorises against your ad accounts and writes rows into your sheet on a schedule. Setup is an afternoon, cost is monthly, and someone else owns the API maintenance.
- Calling the APIs yourself with Apps Script. You write JavaScript inside the sheet that authenticates to Meta, Google Ads or TikTok, requests a report, waits for it, pages through the results and writes them into a tab. Total control, no fee, and you now own a small piece of software.
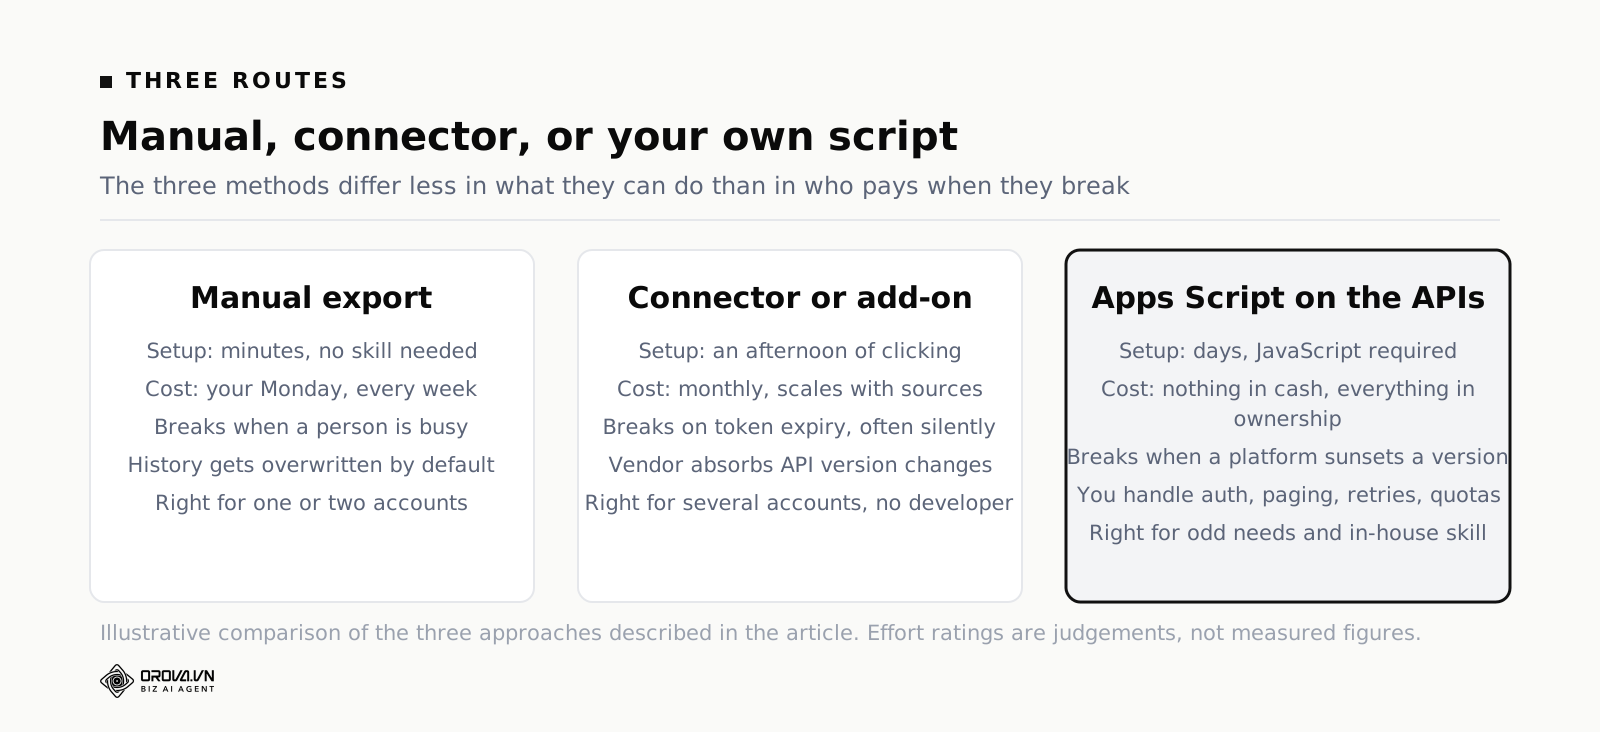
Everything else in this article is detail on those three lines. If you only read one more section, read the one on what breaks — it is the difference between a reporting setup that lasts a year and one you quietly abandon in November.
Method One: The Manual Export You Are Already Doing
It is worth describing the manual route properly rather than dismissing it, because a surprising number of teams should stay on it, and because you cannot price the alternatives until you have priced this one.
What it actually involves
In Meta Ads Manager you set a date range, choose a breakdown, customise columns, and export to CSV or XLSX. You can also schedule a report to arrive by email on a recurring basis, which is the closest thing Meta offers to automation without touching an API. In Google Ads you build a report and download it, with Google Sheets available as a destination — a meaningful convenience, because the file lands in Drive rather than in your Downloads folder. TikTok Ads Manager exports a file too.
Then comes the part that is never in anyone's estimate: reconciliation. Meta calls a thing a campaign, Google calls a thing a campaign, and they mean subtly different objects. Currency symbols travel inconsistently. Dates arrive in the platform's timezone, which may not be the timezone your business reports in. Someone renamed a campaign mid-month, so last month's rows and this month's rows no longer join. Every one of those is a five-minute problem, and there are six of them.
The real cost, worked through
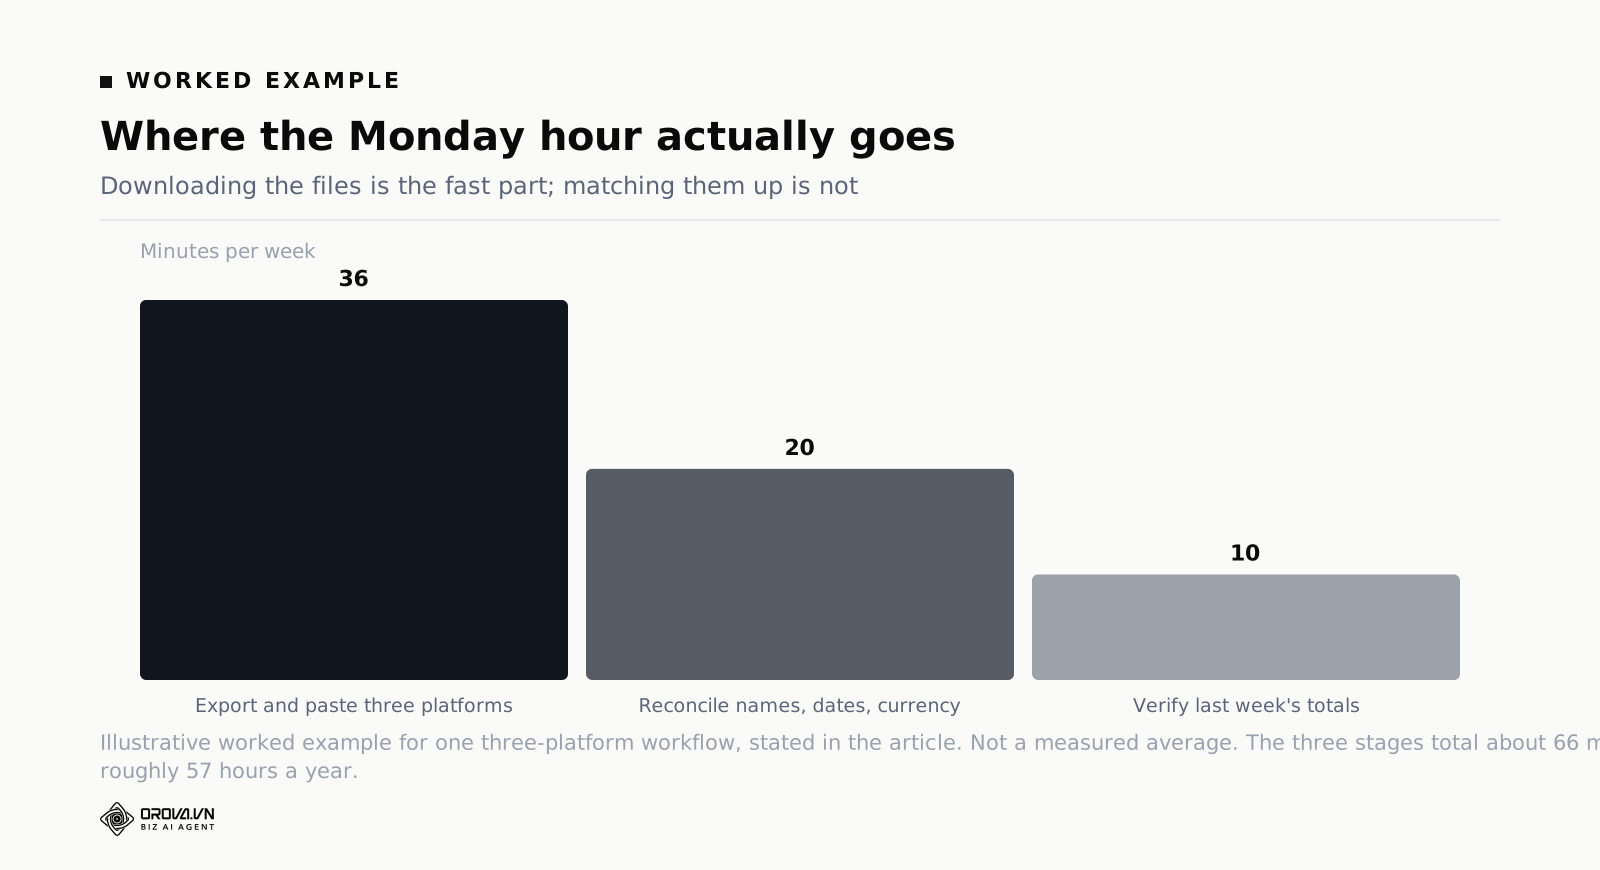
Take a plausible example — these are illustrative figures for one workflow, not measured averages. Three platforms at roughly twelve minutes each to export, clean and paste is thirty-six minutes. Reconciling names and currencies is another twenty. Checking that last week's totals did not shift is ten. That is about sixty-six minutes, once a week, or roughly fifty-seven hours a year. Whether that is expensive depends entirely on what an hour of your time is worth and what else it would have been spent on.
Where it breaks
Manual export does not break in the software sense. It breaks in the human sense, which is harder to fix:
- It stops when you stop. Holiday, illness, a busy week — the report is late, and everyone learns that the report is optional.
- Paste errors are silent. A column added on the platform side shifts everything one place right, and nothing turns red. The number is wrong and looks fine.
- History gets overwritten. Most people paste over the previous week. When a client asks what you reported in March, you no longer have it — only what the platform says about March today, which is not the same thing.
- It does not scale linearly. Two accounts is twice the work. Ten accounts is more than ten times the work, because at ten you start making mistakes and adding checks.
Manual export is the right answer when you run one or two accounts, report monthly, and nobody downstream makes automated decisions from the sheet. It is the wrong answer the moment the sheet feeds something else — a dashboard, an invoice, a bonus calculation — because a human transcription step in front of an automated system is where bad numbers get laundered into official ones.
Method Two: An Add-On or Off-the-Shelf Connector
The middle option is a product built specifically to move rows from ad platforms into spreadsheets. You install it, click through an authorisation screen for each platform, pick accounts, pick fields, pick a date range and a refresh schedule, and it writes into a tab. Setup is genuinely an afternoon, most of which is spent deciding which of four hundred available fields you actually want.
What you are really buying
You are not buying data movement. Data movement is the easy part. You are buying somebody else's obligation to keep up with three APIs that change on their own timetables. Meta's platform versioning policy gives each Graph API version a limited support window — Meta's own versioning documentation states the schedule and the sunset dates — after which calls against it stop working. Google Ads API versions are likewise released and retired on a published cadence. TikTok's marketing API has its own. A connector vendor has an engineer whose job is to notice those announcements. You probably do not.
That is the whole value proposition, and it is a real one. Judge a connector on how it behaves during a version migration, not on how pretty the field picker is.
Limits you should ask about before you commit
- Row and cell ceilings. Google documents a hard ceiling of ten million cells per spreadsheet in its Sheets help pages. That sounds enormous until you pull ad-level data with three breakdowns for two years. Forty columns times a hundred thousand rows is four million cells in one tab.
- Refresh frequency by plan. Hourly refresh is usually a paid tier. Daily is often the entry tier. If your morning routine starts at 8am and the connector refreshes at 9, that is a product decision you inherited.
- Account and destination counts. Pricing is normally per data source, per destination, or per row volume. Agencies get surprised here, because fifteen clients means fifteen sources.
- Historical backfill. Some tools re-pull the last thirty days each run; some only append yesterday. The difference matters enormously, and I will come back to why in the section on restatement.
- Where the data transits. Your ad performance is commercially sensitive. It is a fair question to ask where it is processed and how long it is retained.
The failure modes nobody demos
Connectors fail in three characteristic ways. First, authorisation expires. Meta's long-lived user access tokens have a documented lifetime measured in weeks, not years; when one lapses, or when the person who authorised it leaves and their account is deactivated, the connector goes quiet. Sometimes it emails you. Sometimes the tab just stops growing and nobody notices for nine days.
Second, schema drift. A platform renames a metric or changes what it counts. The connector adds a column, or worse, keeps the old column name with new semantics. Every formula downstream that referenced column M by position is now wrong.
Third, partial writes. A run times out halfway. You now have a tab with Monday through Wednesday, and a chart that shows a cliff on Thursday that does not exist in reality. The chart is what your director sees.
None of those is a reason to avoid connectors. They are reasons to build a freshness check into the sheet itself, which I will describe in the routine section. If your reporting spans paid and organic, the same reliability questions apply to the whole pipeline — the pattern for stitching those sources together sensibly is covered in combined SEO and ads reporting.
Method Three: Calling the Platform APIs Yourself with Apps Script
The third route is to write the integration inside the spreadsheet. Google Apps Script gives you JavaScript with a built-in HTTP client, a scheduler, and direct access to the sheet's cells. No servers, no deployment, no infrastructure bill. For a certain kind of person this is irresistible, and for a certain kind of requirement it is genuinely the correct answer.
What the script has to do
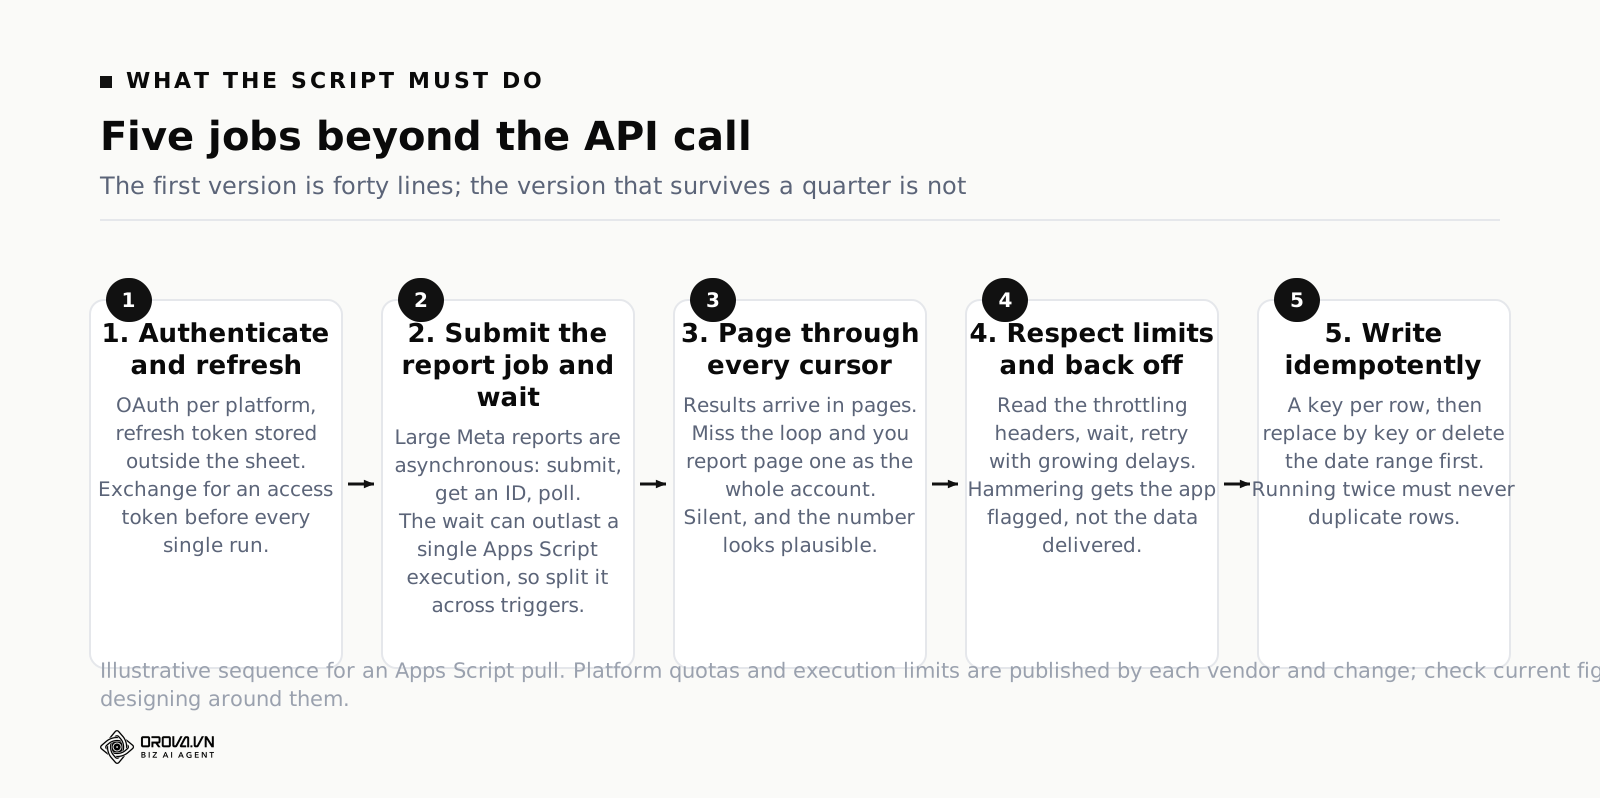
People underestimate this because the first version is forty lines and works. The finished version is not forty lines. A production-grade pull has to handle, at minimum:
- Authentication and refresh. OAuth against each platform, storing a refresh token somewhere that is not a cell in the sheet, and exchanging it for an access token before every run.
- Asynchronous report jobs. Meta's insights endpoint will not hand you a large report synchronously. You submit a job, receive an ID, poll until it reports completion, then fetch the result. Your script now has a wait loop in it.
- Pagination. Results come in pages with cursors. Miss the loop and you silently report the first page as if it were the whole account.
- Rate limits and back-off. Every platform throttles. A correct client reads the throttling headers, waits, and retries with increasing delays rather than hammering and getting the app flagged.
- Partial-failure handling. Account three of seven returns an error. Do you write what you have, roll back, or retry only the failed account? Whatever you choose, the sheet must make it obvious which happened.
- Idempotent writes. Running twice must not duplicate rows. That means a key per row and either a replace-by-key or a delete-then-insert for the affected date range.
Apps Script's own ceilings
The environment has limits of its own, and they are the ones that catch people out because they are invisible until you hit them. Google publishes them on the Apps Script quotas page, they differ between free consumer accounts and Workspace accounts, and they change — so check the current figures rather than trusting a blog post, including this one.
The constraint that bites first is the ceiling on how long a single execution may run. It is measured in minutes, not hours. A polling loop waiting on a large Meta report can burn through it before the report is ready, and your script dies mid-fetch. The standard workaround is to split the job: one trigger submits the report and records the job ID, a later trigger collects it. That is a sensible design, and it also doubles the number of moving parts.
Two more worth knowing: there is a daily cap on outbound HTTP calls, which is generous for one account and tight for an agency looping over thirty; and there is a daily cap on total trigger runtime, which a five-minute-interval script will consume faster than you expect. Both are on the same quotas page.
The part that is not code
Writing it is a weekend. Owning it is the actual commitment. When a platform retires the API version your script targets, the script does not warn you politely — it starts returning errors, or worse, returns a successful response with an empty data array, which your code happily writes as zeros. A chart of zeros looks like a catastrophic performance collapse, and someone will react to it before anyone checks the script.
So the real question for method three is not "can I write this?" It is "if this returns zeros on a Tuesday while I am on a plane, who notices, and can they fix it?" If the answer is nobody, you have not saved money by avoiding a subscription. You have converted a predictable monthly cost into an unpredictable one that arrives at the worst possible moment.
The Three Methods Side by Side
Here is the comparison in one place. Effort ratings are relative judgements, not measured figures.
| Dimension | Manual export | Connector / add-on | Apps Script |
|---|---|---|---|
| Time to first working version | Minutes | An afternoon | Days, honestly |
| Skill required | None | Careful clicking | JavaScript plus API reading |
| Direct cost | None | Monthly, scales with sources | None in cash |
| Ongoing time cost | High, every week, forever | Low, mostly checking | Low until it is very high |
| Who handles API version changes | Not applicable | The vendor | You |
| Row and quota ceilings | Sheet cell limit only | Plan limits plus sheet limit | Script quotas plus sheet limit |
| Custom fields and odd requests | Whatever the UI exports | Whatever the vendor mapped | Anything the API exposes |
| Typical failure | A person is busy | Token expiry, silent stall | Version sunset, empty writes |
| Fix time at 8am | Do it by hand | Re-authorise, or wait on support | Depends who is awake |
| Best fit | One or two accounts, monthly | Several accounts, no developer | Unusual needs, in-house skill |
A pattern worth naming: many teams end up running two of these at once and calling it one system. A connector handles Google and Meta, someone exports TikTok by hand because the connector charges extra for it, and a small script patches a field the connector does not map. That hybrid is not automatically wrong, but it must be written down somewhere, because it is invisible until the person who assembled it is unreachable.
What Actually Breaks, and at What Hour
Every method has a characteristic 8am incident. Knowing them in advance is most of the defence.
Numbers that change after you reported them
This one catches everybody once. Ad platforms restate. Conversions attributed within a lookback window keep arriving for days after the click, so the figure for last Tuesday is different when you read it on Wednesday, on Friday and three weeks later. If your pipeline only ever appends yesterday and never revisits, your sheet permanently holds the earliest, lowest version of every number, and it will not reconcile with the platform UI. If it re-pulls a rolling window, your sheet quietly disagrees with the PDF you sent the client last month.
Neither behaviour is wrong. Not choosing deliberately is wrong. Pick one, write it in a cell at the top of the tab, and keep a frozen snapshot of anything you have externally committed to. If conversions in your business arrive days after the click, this is not a detail — it is the main reason two honest people read the same account and report different numbers.
Timezone and currency
An ad account has a timezone. So does the spreadsheet. So does your business. When they disagree, your Monday contains part of the platform's Sunday, and your weekly totals will be close enough to look right and wrong enough to fail an audit. Set them explicitly and state the choice in the sheet.
Currency is worse, because the failure is invisible. If one account reports in dong and another in dollars and both write into a column called Spend, every sum in that column is meaningless. Any tool doing this properly should refuse to mix currencies in a single total rather than converting silently at an exchange rate nobody chose — a converted number that is wrong is far more dangerous than a blank cell, because a blank cell prompts a question and a wrong number does not.
Naming drift
Campaign names are your join key, and they are edited by humans at will. Someone fixes a typo, and last month's rows stop matching this month's. Two options: join on platform IDs rather than names, which is what the APIs give you and what manual export often does not; or freeze a naming convention and enforce it. The first is more robust and the second is more likely to actually happen.
The sheet getting slow
Ten million cells is the documented hard ceiling, but interactive usability fails long before that. A sheet with volatile formulas across a hundred thousand rows becomes a place people dread opening. The fix is architectural: raw data in a tab nobody opens, an aggregation layer that collapses it to the grain you report at, and a presentation tab built on the aggregate. Never build charts directly on the raw pull.
Mistakes That Make Every Method Worse
Pulling every available field
The field picker offers hundreds of metrics and it is tempting to take them all "in case we need them later". This is the single most common cause of slow, unmaintainable reporting sheets. Every extra column multiplies against every row. Decide what decision the sheet supports, take the fields that inform it, and add more later when a real question demands them.
Overwriting instead of appending
Replacing the sheet's contents each run destroys the one thing a spreadsheet is uniquely good at: keeping a record of what you believed at a point in time. Append with a pull date. It costs nothing and it is the only way to answer "did this number change, or did we make a mistake?"
Formulas that reference cell positions
Anything written as column M rather than as a named header breaks the day a column is inserted, and breaks silently. Use headers, use lookups by name, and put the header row somewhere structural changes cannot shift it.
One person's login owning everything
The connector authorised with a personal account, the script owned by an individual Google account, the sheet in someone's My Drive. All three are the same mistake, and it surfaces on the person's last day. Use a shared drive, an account the organisation controls, and business-level access on the ad platforms rather than a personal login.
No freshness signal
Every sheet that is written to automatically should have a cell at the top saying when it last updated successfully and how many rows arrived. Without it, a stalled pipeline looks identical to a quiet week. With it, the failure is obvious in one glance from anyone who opens the file.
Using the sheet as database and report at once
The raw pull and the thing a human reads should not be the same tab. Mixing them means every refresh risks overwriting formatting and formulas, and every layout change risks corrupting data. Separate them the day you set it up, not after the first accident.
A Weekly Routine That Survives the Person Who Built It
Whichever method you choose, the operational loop is nearly identical. This is a recommended cadence, not a measured one.
- Monday, before anything else: check the freshness cell. Last successful run and row count. Ten seconds. If it is stale, fix that before reading a single number, because everything downstream is a lie until you do.
- Reconcile one figure against the platform. Pick one campaign, one metric, last week's total, and compare it to the platform UI. If it matches, the whole pipeline is probably fine. If it does not, you have found the problem before your director did.
- Read the aggregate tab, not the raw tab. If you find yourself scrolling raw rows to answer a routine question, your aggregation layer is missing something. Add it, rather than scrolling again next week.
- Write one line of commentary. Next to any large movement, type why. Nobody can automate this, and it is what turns a data dump into a report people trust. The habit is the core of SEO Checker: Free Tools and What They Miss.
- Once a month, prune. Delete columns nobody has referenced. Archive tabs older than your reporting horizon. Sheets grow until they are unusable, and nothing shrinks them but a decision.
- Once a quarter, test the bus factor. Ask someone else to re-authorise the connection or run the script from their account, with the documentation you wrote. Whatever they get stuck on is your real single point of failure.
Step six is the one that gets skipped, and it is the one that determines whether your setup survives a resignation.
When a Spreadsheet Stops Being the Right Home
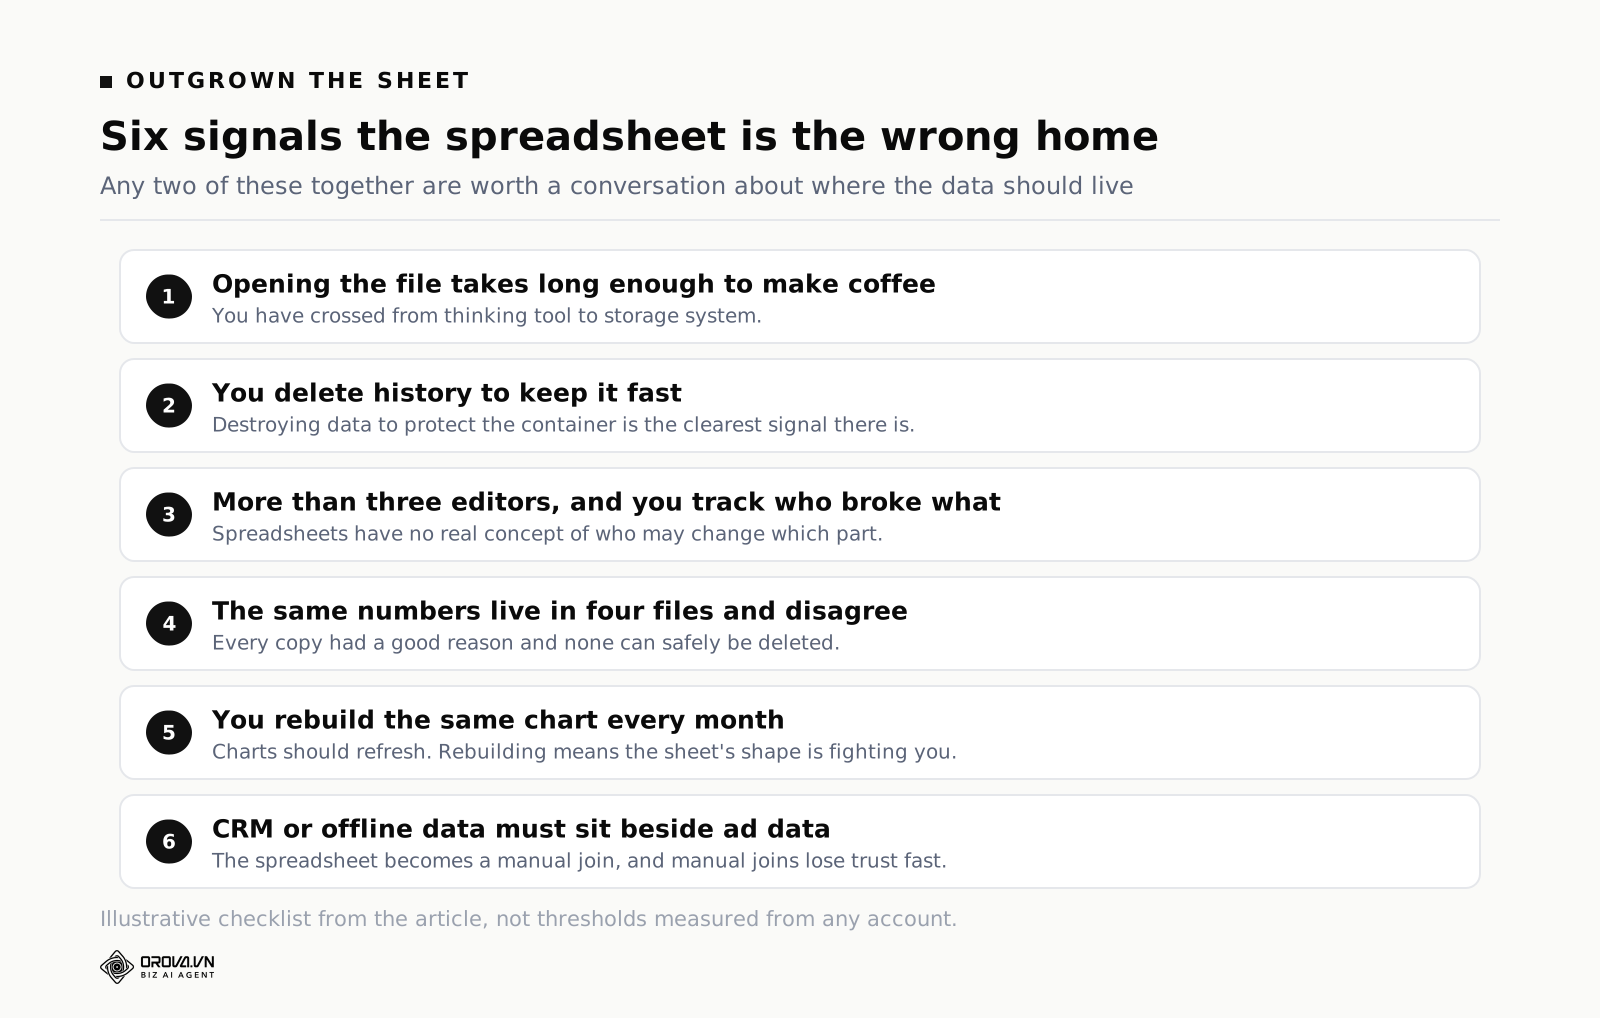
Sheets is excellent at the thing it is for: a flexible surface where a person thinks with numbers. It is not a database and it is not a dashboard, and most reporting pain comes from asking it to be all three at once. Here are the signals it has stopped being the right container.
- Opening the file takes long enough that you make coffee first. You have crossed from thinking tool to storage system.
- You have started deleting history to keep it fast. Deleting data to protect the tool that holds it is the clearest signal there is.
- More than three people edit it and you have started tracking who broke what. Spreadsheets have no meaningful concept of who may change which part.
- The same numbers now live in four files and disagree. Each copy was created for a good reason and none can be deleted.
- You are rebuilding the same chart every month. Charts should refresh; if you are rebuilding, the sheet's shape is fighting you.
- Non-ad data needs to sit alongside ad data. CRM outcomes, offline sales, subscription revenue. The moment the real answer lives in two systems, the spreadsheet becomes a manual join, and manual joins are where reporting credibility goes to die.
The usual next step is to keep the sheet and put a visualisation layer on top, which works well until it does not — the speed and sharing constraints of that approach are laid out in the piece on Looker Studio report speed and sharing limits (Google has renamed Looker Studio back to Data Studio). The alternative is to stop moving files entirely and let the connections live in one place. That is what Orova Insight is for: sixteen source types including Google Ads, Meta Ads, TikTok Ads, GA4, Search Console and Google Sheets itself, with a webhook for anything homegrown, so your CRM or accounting system becomes a normal drag-and-drop source rather than a monthly copy-paste; data syncs daily into one store, reports are built on a canvas with thirty-one chart types and eleven filter controls, and sharing is a link, an embed or a scheduled PDF rather than a file you send. Registration is free with 1,000 quota and no card, which is enough to connect one ad account and see whether the shape suits you.
To be clear about the trade: a platform like that solves the reliability and joining problems and introduces a dependency. Sheets solves nothing automatically and depends on nobody. That is the actual decision, and it is a legitimate one to make either way.
Frequently Asked Questions
Can I connect Facebook Ads to Google Sheets without any paid tool?
Yes, two ways. Schedule an email export from Ads Manager and import the attachment on a rhythm, which is manual but reliable. Or write an Apps Script that calls the Marketing API directly, which is free in cash and costs you the ownership of the code. There is no first-party Meta button that writes into a sheet on a schedule.
Why does my sheet not match Ads Manager?
In order of likelihood: attribution restatement, because the platform has updated figures since you pulled; timezone mismatch between the ad account and the sheet; a different attribution setting or date range than the UI defaults to; deduplication, where a platform counts one result and your sum counts several rows; and only then a genuine pipeline bug. Check the first three before you touch code.
How much history should I keep in the sheet?
Keep the grain you report at for as long as you compare, and keep the raw grain far shorter. Most teams need daily campaign-level data for thirteen to twenty-four months to do year-on-year work, and almost nobody needs two years of ad-level data with three breakdowns. If you need that, you need a database, not a bigger sheet.
Do I need a Meta developer app to use the API?
Yes. Calling the Marketing API means creating an app in Meta's developer console, requesting the relevant advertising permissions, and going through review for anything beyond your own accounts. This is the step people underestimate: the code is a weekend, the approval process is not, and it is why a connector's fee often looks reasonable in retrospect.
Is Google Sheets fine as a data source for a dashboard tool?
For small, stable datasets, yes, and it is a common pattern. It degrades when the sheet is large, when several people edit it, or when the dashboard refreshes frequently — every refresh reads the whole sheet. If your board is slow, suspect the sheet before you blame the dashboard tool.
Which method should an agency with fifteen clients choose?
Almost certainly a connector, and probably not the cheapest one. At that count the manual route consumes a person, and a homegrown script means fifteen sets of credentials, fifteen accounts' worth of rate limits, and one developer whose holiday becomes an operational risk. Price the tool against the salary of the hours it removes, not against zero.
What to Do This Week
Do not rebuild anything yet. Do three small things instead.
First, time the ritual honestly. Next Monday, start a timer when you open the first Ads Manager tab and stop it when the report is ready to send. One measured number ends the argument about whether this is worth fixing, in either direction.
Second, add a freshness cell to whatever sheet you already have — last updated, row count, who to contact. Five minutes, and it will catch a silent failure at some point in the next year.
Third, write down the answer to the 8am question: if the numbers are wrong or missing at eight in the morning on your most important day, who looks at it and what do they check first? If you cannot name a person, that is your answer about which of the three methods you should be on — and it is probably not the one that requires a developer who is not on your team.
Stop Rebuilding the Same Report Every Monday
Whichever method you choose, the honest cost is not the setup, it is the maintenance you keep paying every single week: checking the numbers matched, fixing a renamed campaign, redoing a broken formula right before a client call. That upkeep is the real price tag, and it rarely shows up until months in.
Orova Insight is built to take that weekly upkeep off your plate, pulling your ad numbers into the sheet automatically so nobody has to babysit exports or scripts every Monday morning. If that sounds like time you would rather spend elsewhere, it is worth a look.
Or skip the sheet entirely
Orova Insight syncs ad platforms and Google Sheets into one report that refreshes itself.
Start for free