
Conversion rate optimization: a practical guide with a B2B and SaaS playbook

Conversion rate optimization (CRO) is the practice of increasing the share of website visitors who complete a goal you care about, such as buying, signing up for a trial, or requesting a demo. You measure it with one simple formula: conversion rate = conversions ÷ visitors × 100%. CRO works by finding where visitors get stuck, forming a hypothesis about why, testing a fix, and keeping only the changes that the data supports. Done well, it turns the traffic you already pay for into more customers instead of buying ever more traffic.
Many teams discover CRO the hard way. Traffic climbs, ad spend climbs with it, yet revenue and qualified leads barely move. The usual reflex is to spend even more on ads, which is expensive and rarely fixes the real problem. This guide covers the fundamentals that apply to any website first, then goes deeper into the situations where generic advice breaks down: B2B and SaaS companies with long sales cycles, complex trial flows, and lead quality that matters more than raw volume.
What is conversion rate optimization and how is it calculated?
Conversion rate optimization is the systematic, data-driven process of increasing the percentage of website visitors who take a desired, measurable action. This action could be completing a purchase, filling out a lead capture form, signing up for a software trial, downloading a whitepaper, or requesting a product demo.
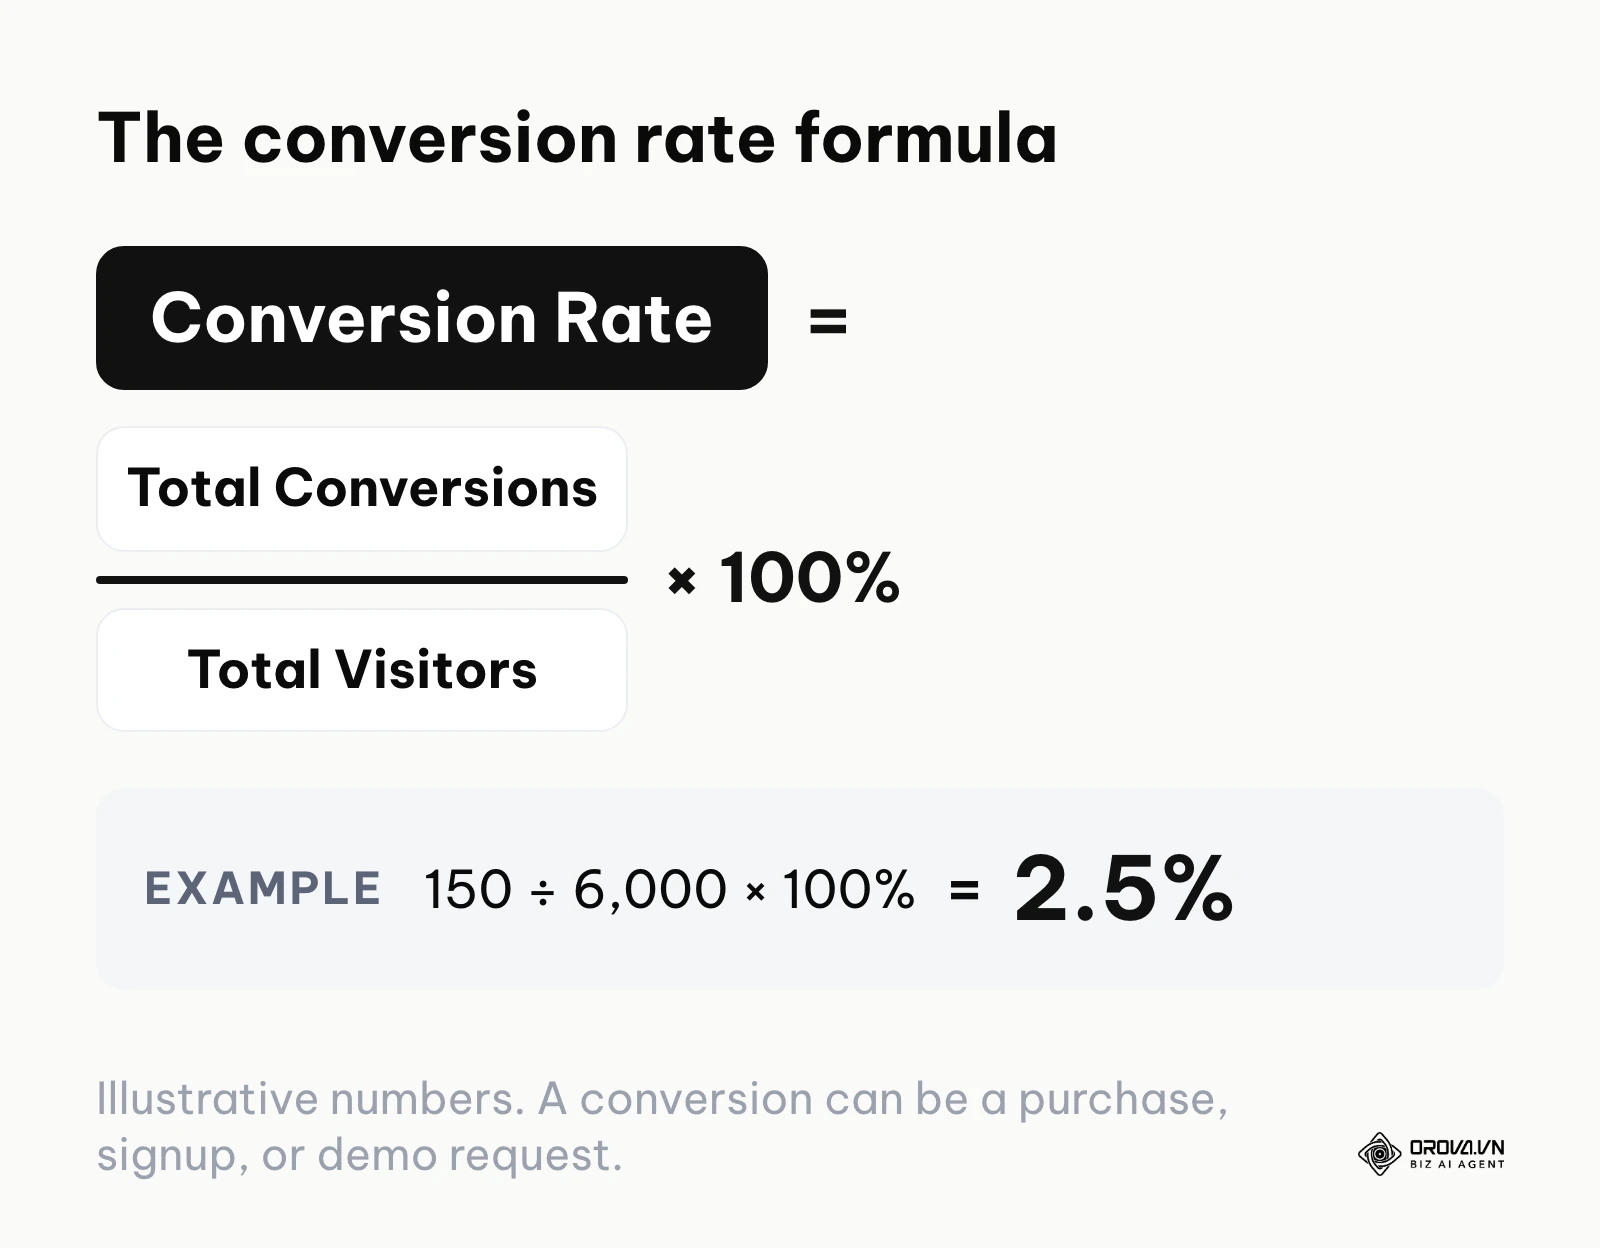
The conversion rate itself is calculated as conversions divided by visitors, multiplied by 100%. Illustrative example: if a landing page receives 6,000 visitors in a month and 150 of them request a demo, the conversion rate is 150 ÷ 6,000 × 100% = 2.5%. If a change lifts that to 180 demo requests from the same 6,000 visitors, the rate becomes 180 ÷ 6,000 × 100% = 3%, and you have gained 30 extra leads without paying for a single extra visit. There is no universal "good" conversion rate; it varies widely by industry, offer, traffic source, and what you count as a conversion, so the most useful benchmark is your own rate over time.
This practice matters most for businesses that already have a steady stream of traffic. If you are spending money to acquire visitors, improving your conversion rate is one of the most direct ways to lower customer acquisition cost. However, CRO should not be your first priority if your company has not yet found product-market fit, or if your website gets so little traffic that patterns are hard to see. Without enough data, optimization efforts become guesses.
Why B2B and SaaS companies need a different approach
For B2B and SaaS organizations, the stakes are significantly higher than in traditional retail. You are not trying to convince a user to buy a cheap pair of shoes on impulse. You are asking teams to commit to long-term contracts, change their internal workflows, and trust you with their sensitive data. This requires a much deeper level of trust building, friction reduction, and precise messaging.
Preparation: The CRO Foundation for Startups and Enterprises
Before you can run a single test or change a button color, you need to build a rock-solid data foundation. You simply cannot optimize what you cannot accurately measure. The biggest mistake companies make is jumping straight into testing without having reliable analytics tracking in place. Your foundation must consist of quantitative tools to tell you what is happening, and qualitative tools to tell you why it is happening.
| Requirement | Example tools or sources | Relative setup effort |
|---|---|---|
| Quantitative analytics | Google Analytics 4, Mixpanel, Amplitude | Highest: custom events and funnels need planning and QA |
| Qualitative tracking | Hotjar, Microsoft Clarity | Low: usually a tracking snippet plus privacy settings |
| Testing engine | VWO, Optimizely | Medium: install, QA on key pages, agree on test rules |
| Customer feedback | On-site surveys, exit polls, customer interviews | Low to medium: depends on how many questions you ask |
| Dedicated budget and owner | Internal approval | Varies by organization size |
One note on testing tools: Google Optimize, which many older guides still recommend, was discontinued by Google in 2023, so pick a currently supported testing platform instead.
Establishing this foundation is non-negotiable. You need to make sure every crucial interaction on your website is tracked accurately. If you run paid campaigns, understanding what a conversion API is helps when setting up server-side tracking, which keeps conversion data more complete when browsers or ad blockers limit client-side scripts. Once your data collection is reliable, you can move on to the actual optimization work.
The 6-Step Conversion Rate Optimization Framework
Successful optimization is never a one-time project; it is a continuous, looping process of discovery and refinement. This framework is designed to remove guesswork from your marketing strategy and replace it with evidence.
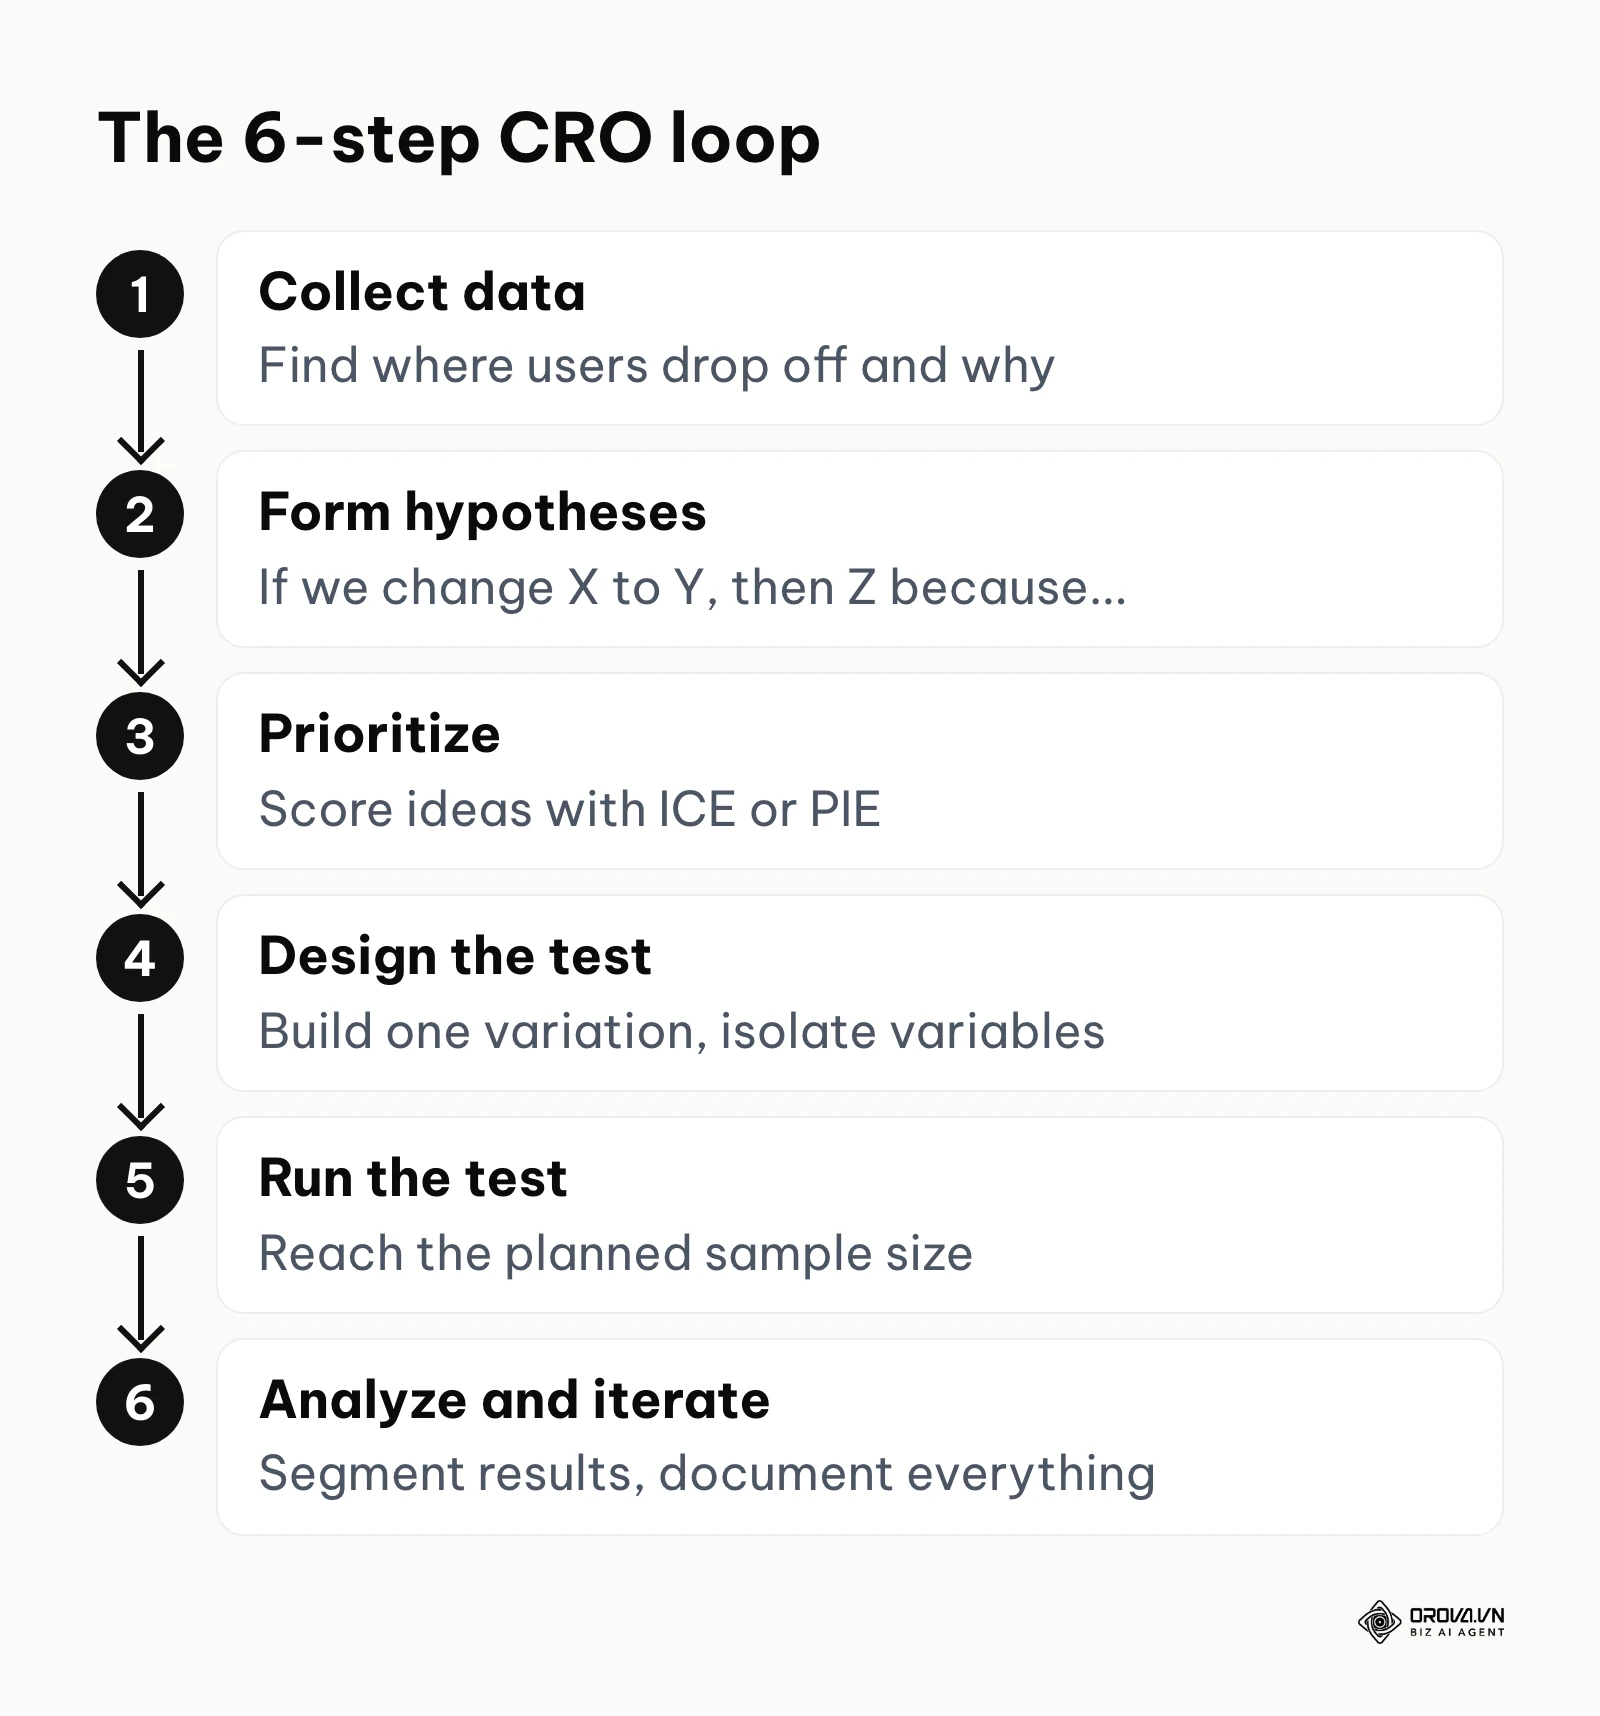
Step 1: Data Collection and Auditing
The first step is completely passive. You must collect enough data to understand the current reality of your website's performance. Start by opening your quantitative analytics platform and navigating to your funnel exploration reports. Look for the exact pages or specific form fields where the largest percentage of users are abandoning their journey.
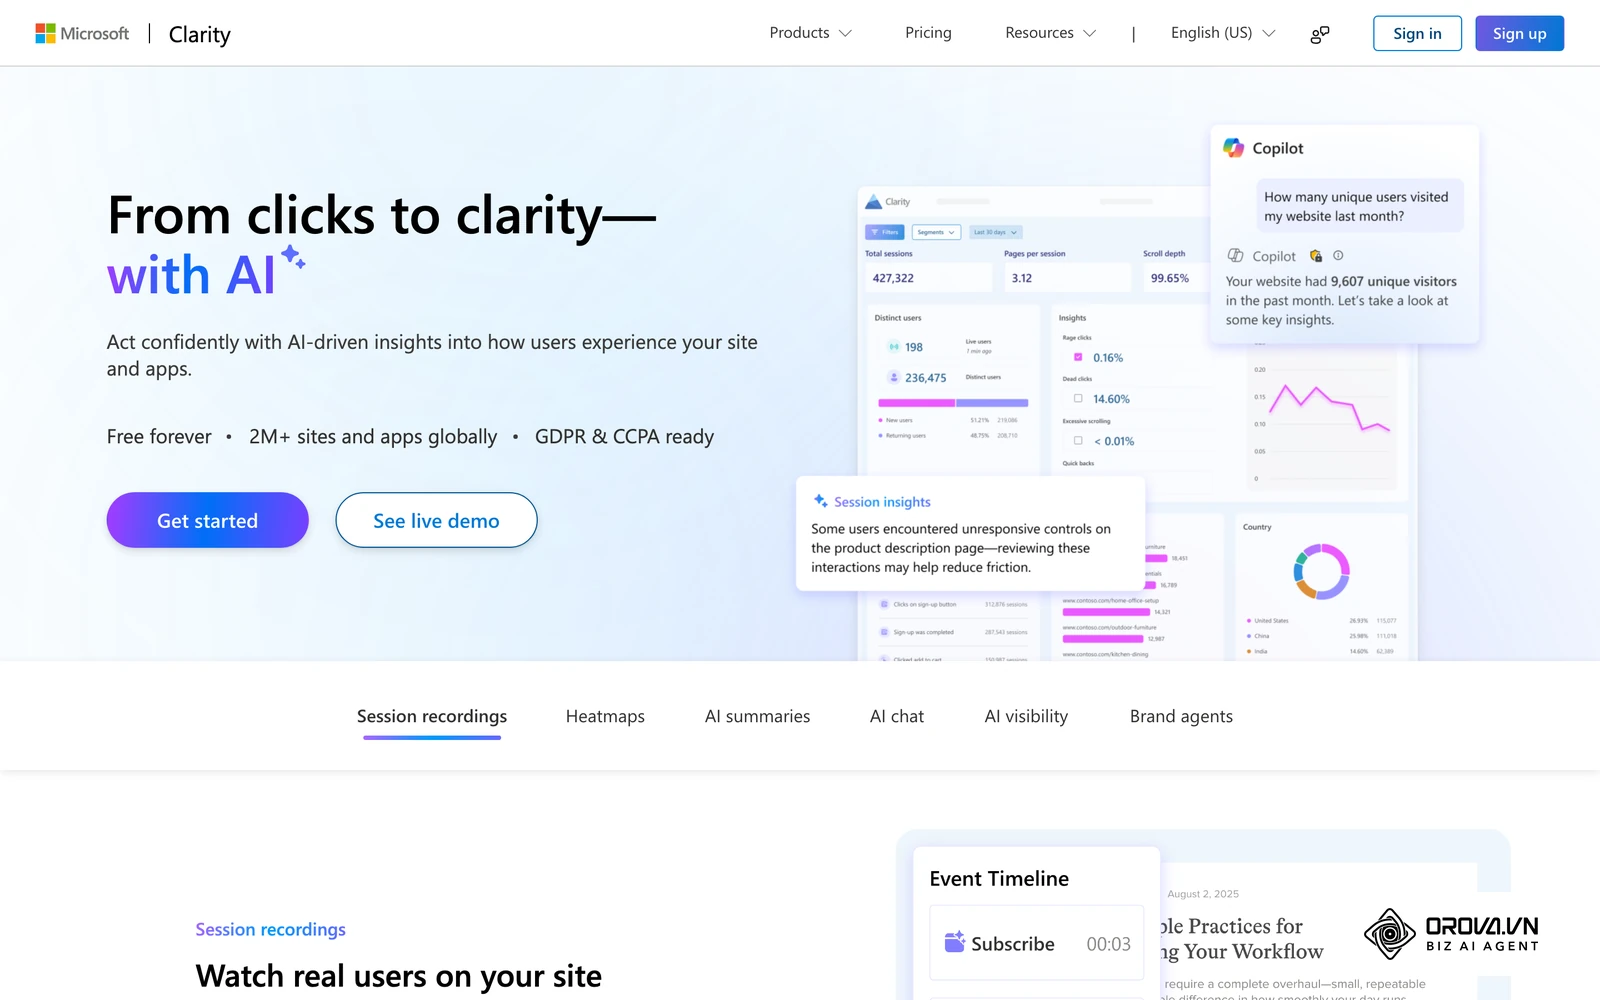
Once you identify the "where," you must use your qualitative tools to uncover the "why." Watch session recordings of users navigating the problematic pages. Look for signs of frustration, such as rapid mouse movements, rage-clicking on non-clickable elements, or users repeatedly scrolling up and down as if searching for missing information.
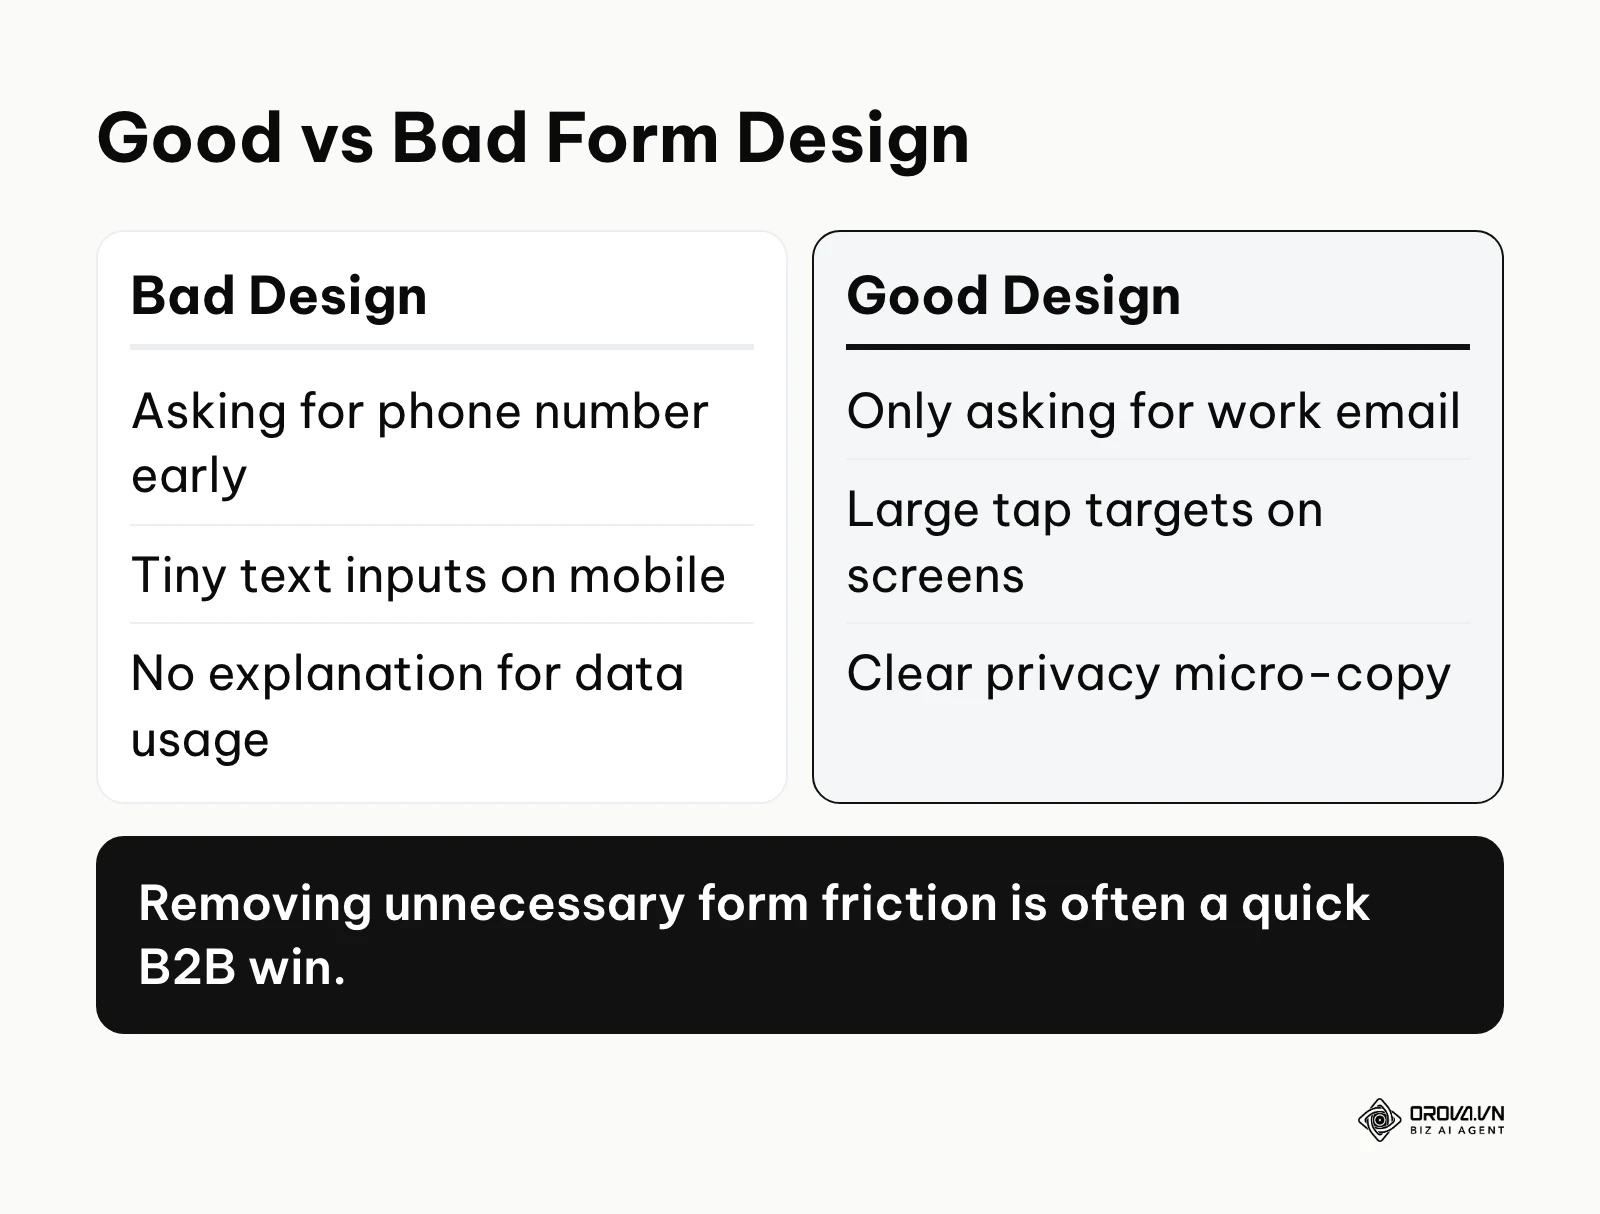
Illustrative example: A mid-sized B2B SaaS company offering project management software noticed high traffic to their enterprise pricing page but very low demo request signups. They installed session recording tools, set up a custom funnel in Google Analytics tracking the individual form fields, and initiated targeted user exit polls. The data revealed users were dropping off precisely at the mandatory "Company Phone Number" field. They initially made the field optional, but the drop-off remained stubbornly high. The fix was removing the field entirely and using clear micro-copy explaining that communication would happen strictly via email first. After the change ran long enough to compare against the previous period, the form completion rate rose and the database stopped filling up with fake phone numbers.
If you are doing this step correctly, you will easily generate a list of specific, proven friction points. A common error here is relying exclusively on numerical data while ignoring qualitative user feedback, leading to fixes that address symptoms rather than the root cause.
Step 2: Hypothesis Generation and AI Prompting
With your list of friction points in hand, you must formulate educated guesses on how to fix them. A strong hypothesis follows a strict structure: "If we change [Element] to [Variation], then [Expected Result] because [Rationale based on data]."
In the modern workflow, AI is very useful for accelerating this step. Instead of manually reading through hundreds of open-ended exit poll responses, you can feed anonymized raw data into a generative AI model to extract themes and draft hypotheses quickly, then have a human check them against the source data. The same idea applies to the ads that send traffic to your pages, as covered in this guide to AI ads.
You can use this exact prompt structure in your AI tool of choice:
Role: You are an expert Conversion Rate Optimizer and UX Researcher. Task: Analyze the following customer feedback and exit poll data from our software pricing page. Data: [Paste your raw survey responses or transcript data here] Instructions: (1) Identify the top 3 recurring friction points or anxieties preventing users from signing up. (2) Formulate 3 testable A/B testing hypotheses following the structure: "If we change [X] to [Y], then [Z] because [Rationale]." (3) Suggest one radical redesign concept that addresses the core underlying objection found in the data.
Signs you are doing this right include having hypotheses that are directly tied to user pain points, rather than just random aesthetic changes. The most common mistake is testing ideas based purely on what a competitor is doing, without evidence that your users share the same preferences.
Step 3: Prioritizing A/B Tests with Frameworks
Marketing teams often have dozens of ideas but limited engineering resources. To solve this, you must learn how to prioritize a/b tests mathematically to ensure you are not wasting traffic on low-impact changes. The most popular frameworks for this are PIE (Potential, Importance, Ease) and ICE (Impact, Confidence, Ease).
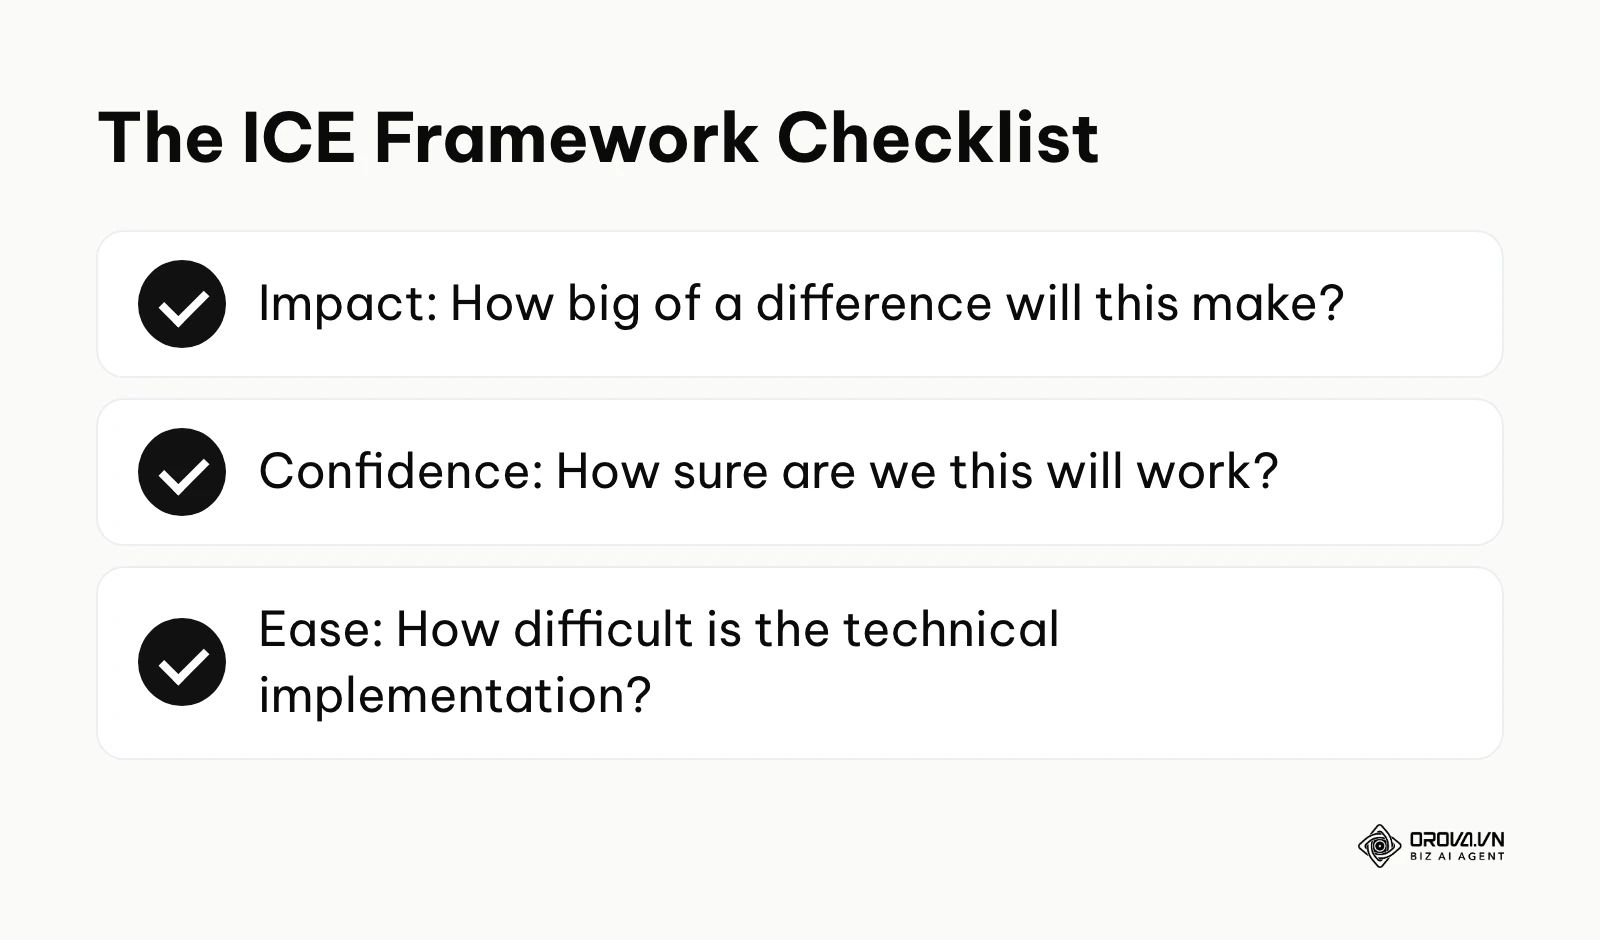
You evaluate every hypothesis on a scale of 1 to 10 for each criterion, then add the three scores together. This reduces emotional bias in the decision-making process. You can copy the table below into any spreadsheet and replace the illustrative scores with your own.
| Idea Description | Impact (1-10) | Confidence (1-10) | Ease (1-10) | Total Score | Priority |
|---|---|---|---|---|---|
| Remove "Phone" from trial form | 8 | 9 | 9 | 26 | High |
| Add trusted logos near CTA button | 6 | 7 | 8 | 21 | Medium |
| Complete redesign of Pricing Page | 9 | 6 | 2 | 17 | Low |
| Add live chat widget to checkout | 7 | 8 | 5 | 20 | Medium |
If you use this framework properly, your team will stop arguing over subjective opinions and start executing the tasks with the highest scores. The biggest trap at this stage is prioritizing based on the Highest Paid Person's Opinion (HIPPO) rather than the framework's strict scoring system.
Step 4: Test Design and Asset Creation
Once your top priority test is selected, you must build the actual variation. For B2B and SaaS, this often involves significant changes to copywriting, form structures, or value propositions rather than just swapping button colors. Your test variations will often rely heavily on persuasive seo content writing to effectively communicate your value proposition clearly and concisely.
When designing the test, you must ensure that you are isolating variables. If you change the headline, the button color, and the hero image all at the same time, you will never know which specific change caused the increase or decrease in conversions.
Illustrative example: A fintech startup needed to optimize their mobile onboarding flow for a new corporate investment application. They mapped out the user journey, simplified the identity verification screen, and created two distinct variations: one with a visual progress bar and one without. The testing tool initially reported highly skewed data because the tracking snippet was not firing correctly on older mobile devices. After developers patched the tracking implementation, the test ran smoothly. The variation with the progress bar clearly outperformed the control, leading to a much higher volume of fully verified corporate accounts ready to fund their wallets on the dashboard.
Step 5: Test Execution and Statistical Significance
This is where the actual mathematics come into play. You launch your test using your testing engine, routing 50% of your traffic to the original design and 50% to your new variation.
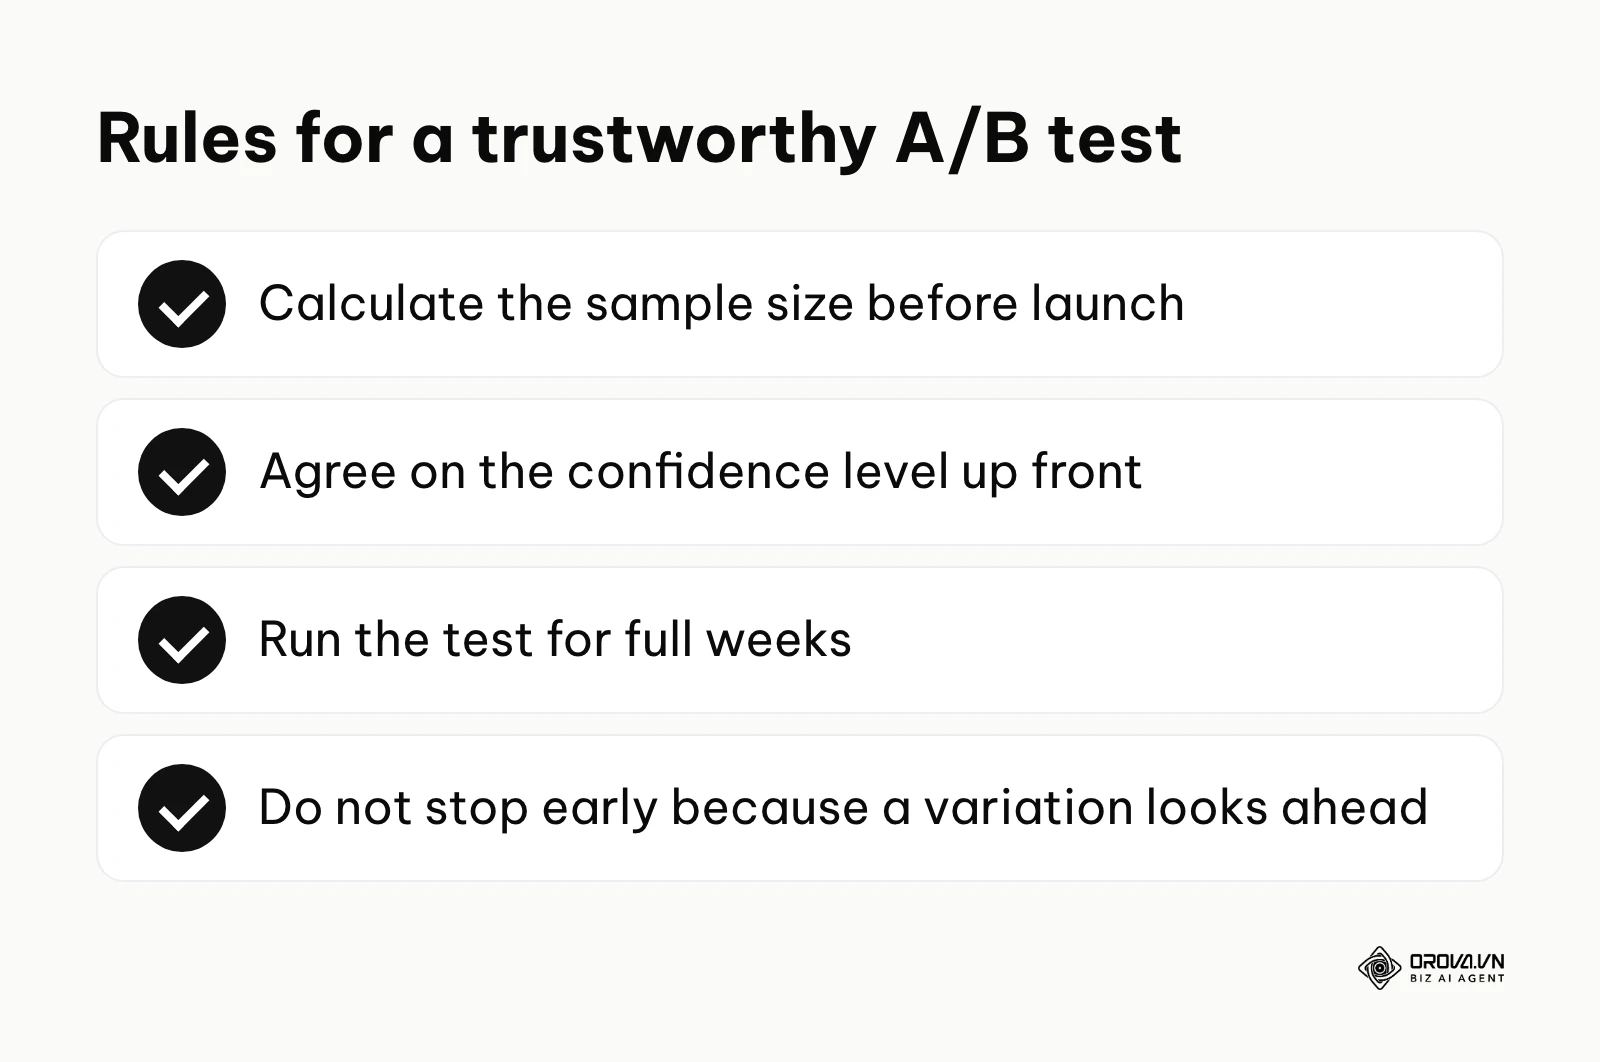
The most critical rule here is to decide the sample size and the confidence level before you launch, then let the test run until it reaches that sample. Use the sample size calculator built into your testing tool, or any reputable statistics calculator, with your baseline conversion rate and the smallest lift you care about detecting. How long the test takes depends on your traffic volume and baseline rate, but it should run for full weeks so weekday and weekend behavior are both represented. If you stop a test after a few days because the variation looks like it is winning, you risk shipping a change that was only random noise and that may hurt results later.
Step 6: Post-Test Analysis and Iteration
When the test concludes, you must analyze the results deeply. If the variation won, you deploy it permanently to 100% of your traffic. If it lost, you have still gained valuable insights into what your audience does not respond to.
Crucially, you should segment your test data. Sometimes a variation might lose overall, but when you filter the data, you discover that it increased conversions massively for mobile users while tanking performance for desktop users. This tells you that your next step is to create device-specific experiences. A common mistake here is deleting the data from failed tests; you should meticulously document every failure in a central repository so future team members do not repeat the same mistakes.
Discover Orova.vn – a Biz AI Agent platform with OROVA SEO, a complete solution for every website. The system supports search engine optimization from A to Z with features including keyword research, writing new SEO-ready articles, optimizing existing content, rank tracking, plus competitor analysis and in-depth technical analysis. Sign up today to experience OROVA SEO completely free (offer valid through July 7, 2027).
Deep Dive: Analyzing CRO Strategies Beyond eCommerce
Optimizing a website that sells twenty-dollar t-shirts is fundamentally different from optimizing a website that sells fifty-thousand-dollar enterprise software contracts. eCommerce optimization is highly transactional and relies on urgency, discounts, and frictionless checkout flows. B2B and SaaS optimization is relational; it relies on building authority, answering complex technical objections, and managing a sales cycle that can span several months.
A warning that applies to both worlds: fake urgency and fake scarcity, such as a countdown timer that resets on every visit or a "only 2 spots left" message that is never true, may lift clicks briefly but erode trust once buyers notice, and in many markets they can breach consumer protection rules. Use urgency only when a deadline or limit is real.
The SaaS Trial Signup Flow Optimization
For SaaS companies, the primary battleground is the trial signup flow. The debate constantly rages between removing all friction (asking only for an email address) versus adding intentional friction (requiring a work email, company size, and credit card upfront).
| Strategy | Best For | Weaknesses |
|---|---|---|
| Frictionless (Email Only) | Product-Led Growth (PLG) models, simple tools | High volume of low-quality, tire-kicking users |
| Intentional Friction | Complex enterprise tools, sales-led motions | Significantly lower overall conversion volume |
| Freemium Model | Products with strong viral loops and network effects | High infrastructure costs to support free users |
| Demo Request Only | Highly customized software requiring setup | Alienates users who want to explore independently |
The right choice depends entirely on your product's complexity. If your software requires a developer to integrate an API before it provides value, a frictionless signup will result in thousands of abandoned, empty accounts.
B2B Lead Capture and Pipeline Quality
In B2B lead generation, a higher conversion rate is not always a good thing. If you optimize a landing page to capture as many leads as possible by removing all qualifying questions, your marketing conversion rate will skyrocket. However, your sales team will spend their days calling students, retirees, and unqualified prospects, ultimately decreasing your actual closed-won revenue.
Illustrative example: An enterprise cybersecurity firm wanted to increase demo requests generated from their highly technical blog posts. They implemented a sticky sidebar form, added in-line text links promoting a whitepaper, and A/B tested a short contact form versus a very long, detailed landing page form. The short form generated a massive spike in leads, but the sales team immediately complained about poor lead quality. The fix involved actively reverting to a multi-step form that asked strict qualifying questions upfront regarding company size and budget, intentionally sacrificing raw conversion rate volume for lead quality. The sales team saw a dramatic shift in their daily queues, spending their mornings talking to high-intent executives instead of unqualified students doing research for term papers.
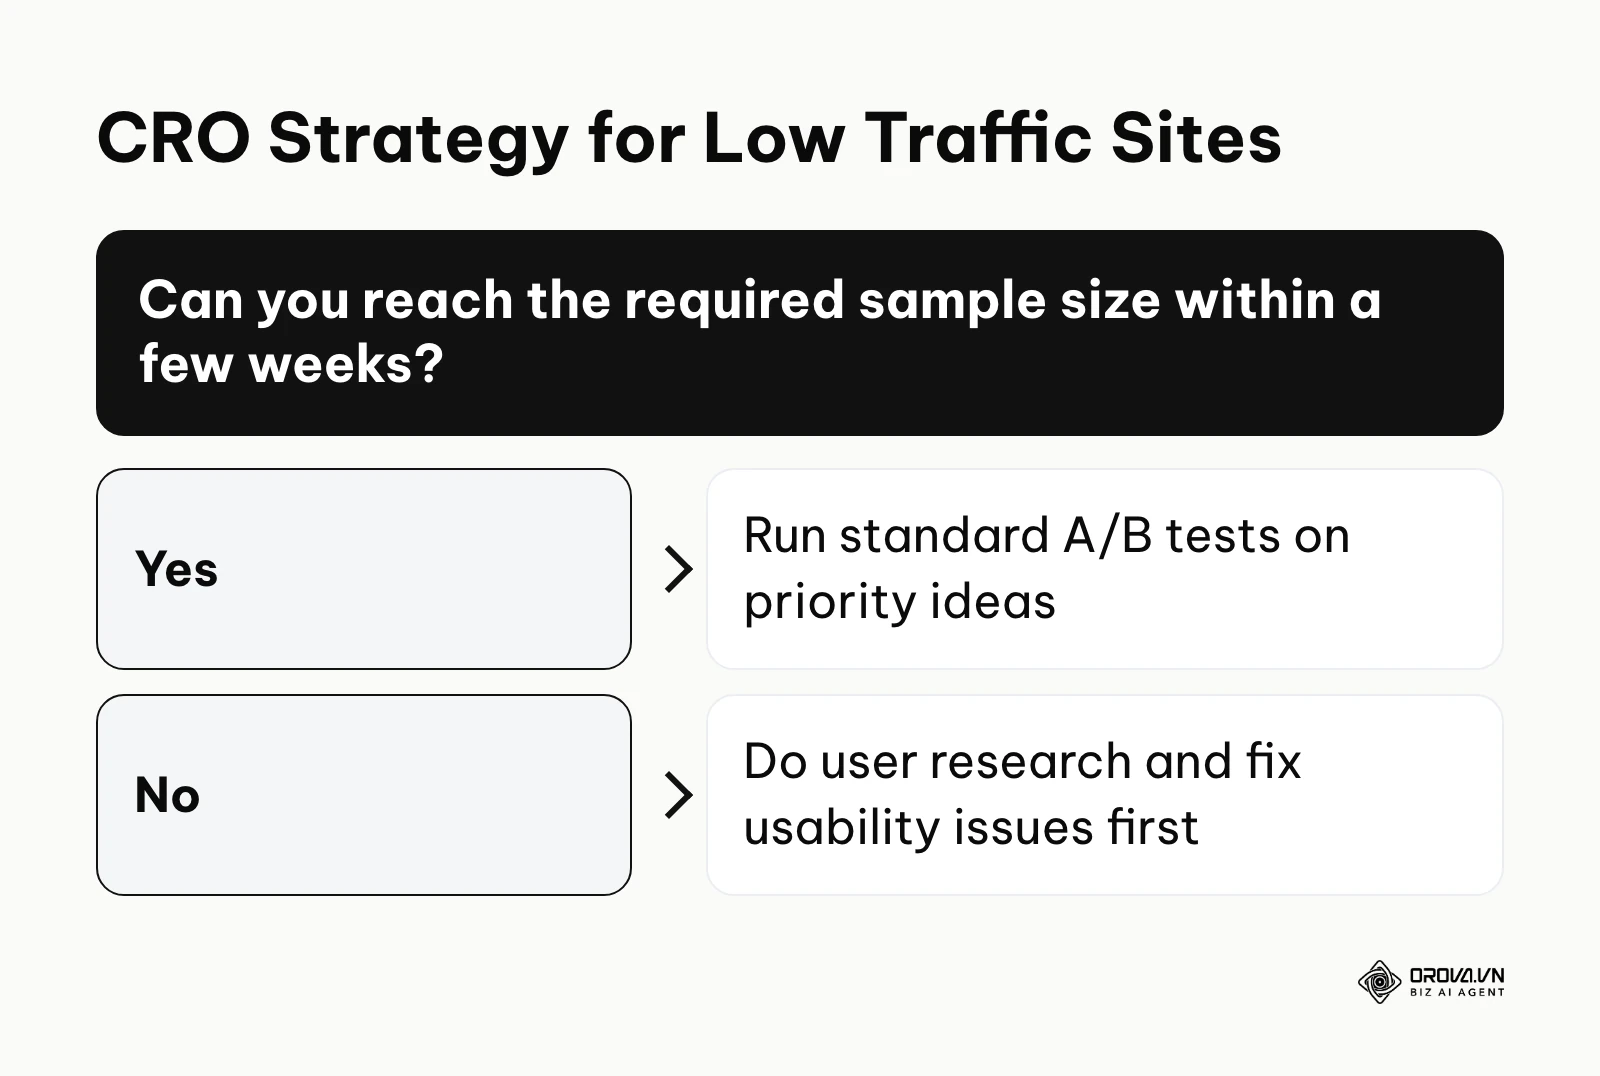
If your website traffic is currently too low to reach statistical significance for A/B testing—a common issue when looking for conversion rate optimization tools for startups—you must pivot your strategy. Stop trying to run tests and instead focus purely on qualitative user research, conducting deep customer interviews, and fixing obvious usability bugs.
Measuring CRO Success: Metrics That Matter in B2B and SaaS
You must measure success across the entire customer lifecycle, not just at the very first touchpoint. B2B optimization requires tracking both macro-conversions (the ultimate goal, like a signed contract) and micro-conversions (smaller steps, like watching a video or clicking to the pricing page).
| Metric | Meaning | Warning sign to watch for |
|---|---|---|
| Form abandonment rate | Percentage of users who start filling a form but leave | Rising over time, or drop-off concentrated on one field |
| MQL to SQL ratio | How many marketing leads are accepted by sales | Falling right after a change that raised form conversions |
| Trial to paid rate | Percentage of trial users who become paying customers | Lower than your own past cohorts, or falling as signups grow |
| Time to value (TTV) | How fast a new user experiences the product's core benefit | Most new accounts never reach the first key action |
If paid media feeds these funnels, connect your CRO results to spend as well: the ROAS formula shows how a better conversion rate changes the revenue you get back from every ad dollar.
You must give your optimization efforts time to mature. While an eCommerce store might see a revenue increase on the same day they launch a winning test, a B2B company might not see the revenue impact of a better lead form until the three-month sales cycle naturally concludes.
10 Common UX Mistakes Ruining Your Conversion Rate Optimization
Before you invest heavily in testing, make sure the pages you want to optimize are healthy and attract the right search intent; this SEO audit case study shows how technical and content issues are found and prioritized. Once the right traffic is flowing, you can address these ten frequent usability errors. These are quick wins that you can fix immediately without needing a team of developers, and they often provide a better return on investment than complex testing.
1. Vague Value Propositions Above the Fold Users make a judgment about your website in milliseconds. If your main headline says something abstract like "Empowering the Digital Future," no one knows what you actually sell. You must state exactly what the product is, who it is for, and what pain it solves before the user has to scroll down.
2. Too Many Form Fields (The B2B Killer) Every extra input field you add to a form tends to reduce the likelihood of completion. B2B marketers often greedily ask for job titles, employee counts, and phone numbers just to download a simple PDF. You must audit your forms and ruthlessly delete any field that is not strictly necessary for the immediate next step in the sales process.
3. Lack of Contextual Social Proof Putting a generic carousel of testimonials on your homepage is fine, but it is not enough. You must place specific social proof directly next to high-friction areas. If a user is looking at your enterprise pricing tier, place a quote from a similar enterprise customer right next to the purchase button to alleviate their specific anxieties.
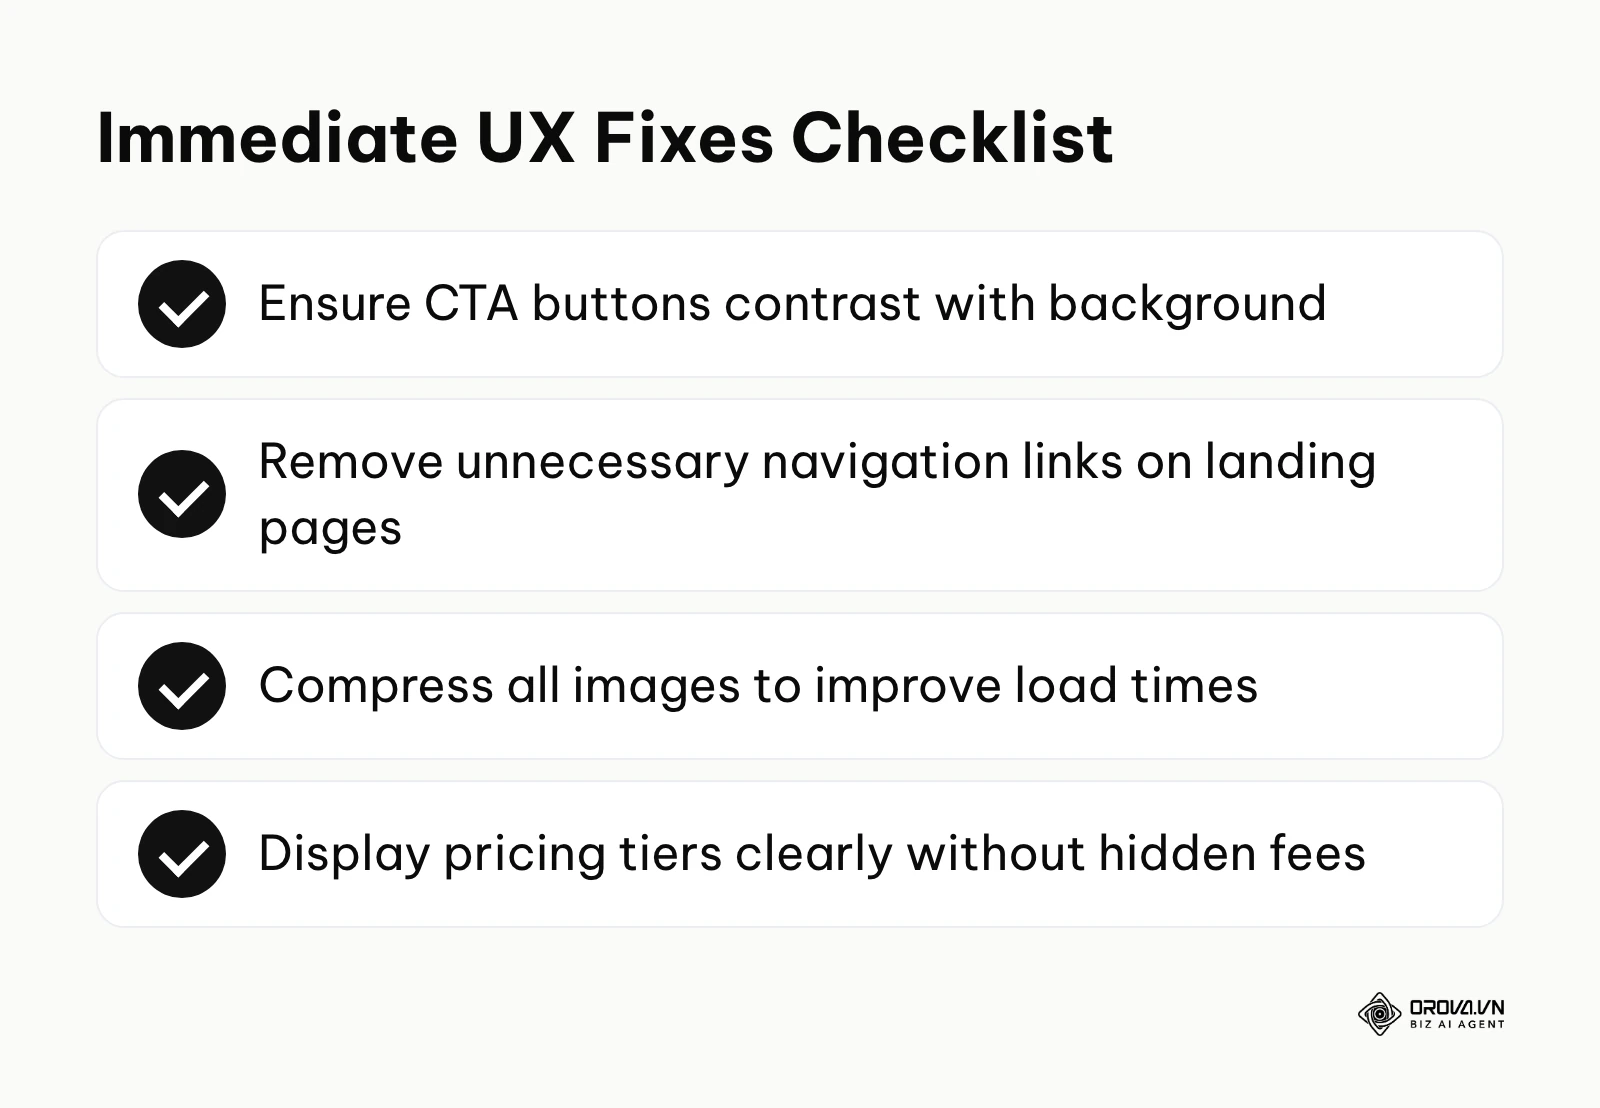
4. Poor Mobile Responsiveness on Complex Elements While B2B traffic is heavily desktop-oriented, a significant portion of initial research happens on mobile devices. If your massive comparison tables or multi-step lead forms break down on smaller screens, executives will abandon the site. You must test your critical conversion paths on actual mobile devices, not just browser emulators.
5. Hidden or Confusing SaaS Pricing Nothing frustrates a software buyer more than having to jump through hoops just to find a rough price estimate. Hiding your pricing behind a mandatory "Contact Sales" wall when your competitors offer transparent tiers will cost you leads. If your pricing is highly customized, provide starting ranges or interactive calculators to set baseline expectations.
6. The Paradox of Choice in Navigation If your landing page has a primary call to action, but also features a massive header menu with twenty different links, social media icons, and a footer full of distractions, users will get lost. Landing pages designed for conversion must strip away all unnecessary navigation elements, forcing the user to focus entirely on the main offer.
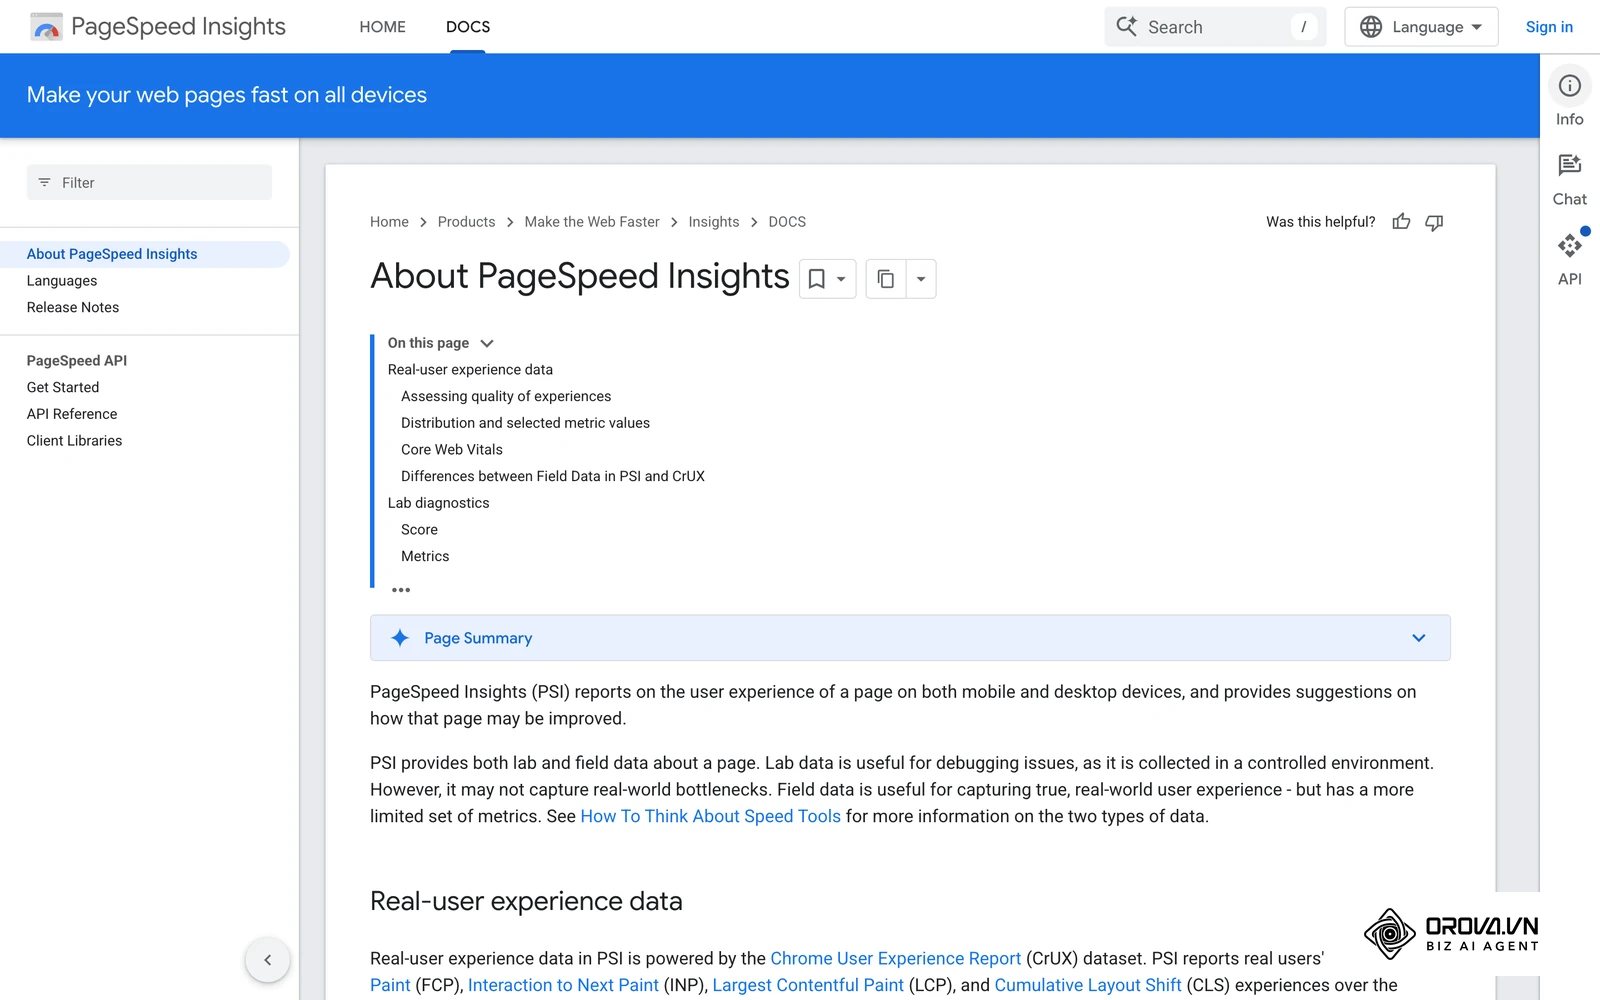
7. Sluggish Page Load Speeds Users will not wait for heavy javascript animations or uncompressed images to load. A delay of just a few seconds will cause bounce rates to spike, destroying your conversion rate before the user even sees your offer. You must compress assets, defer non-essential scripts, and use a content delivery network, then check key landing pages regularly with a tool such as PageSpeed Insights.
8. Weak or Invisible Calls to Action (CTAs) If your main conversion button blends into the background color of your website, or if it uses passive language like "Submit" or "Click Here," it will be ignored. Your buttons must use high-contrast colors and employ action-oriented, value-driven text, such as "Start Your Free Trial" or "Get Your Custom Audit."
9. Forcing Account Creation Too Early If you require users to create a complex account with a secure password before they can even browse your catalog or read the details of your service, they will leave. You must allow users to explore and build intent before asking them to commit to the friction of account creation.
10. Ignoring the Power of Micro-copy The tiny snippets of text around your forms and buttons matter immensely. Adding a simple line of micro-copy like "No credit card required" under a trial signup button or "We hate spam too" under an email field can noticeably reduce user anxiety, and it is one of the cheapest things to test.
With OROVA.VN and the OROVA SEO module, you put an end to the exhausting days of manual work for good. Instead of struggling for hours to write articles and compile reports, the entire process is now optimized and completed in just 5 minutes.
Where conversion rate optimization is heading in the next few years: the author's take
These are opinions, not forecasts with numbers attached. They are based on signals I can see today and what I think teams should prepare for over the next two to three years.
AI will take over most of the variation-building work
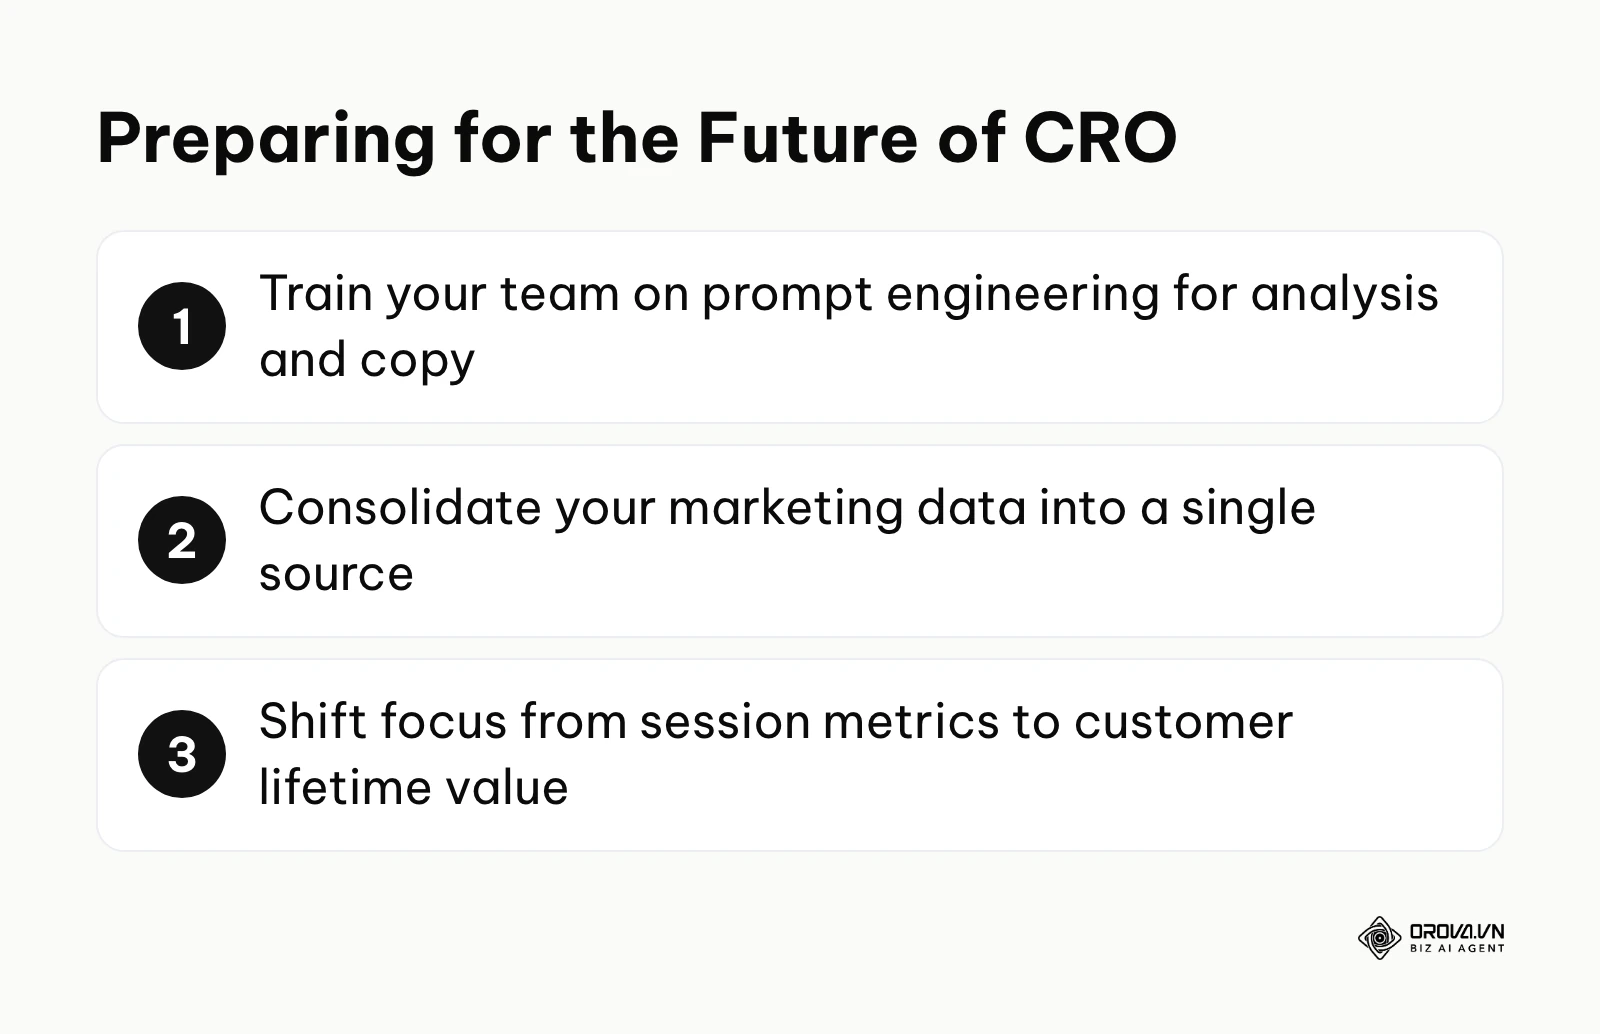
I think the slowest part of CRO, writing and building variations, is the part AI will change first. The signal today is clear: AI tools can already draft headline, copy, and layout variations in seconds. Over the next two to three years, my read is that teams will test more variations at once and spend less time producing them, while humans move into the role of editors who set the guardrails, check brand and legal accuracy, and decide what is worth testing. To prepare, train your team on prompt engineering for analysis and copy, and write down your brand rules so an AI has clear boundaries.
Personalization will compete with the single "winning" page
My read is that the classic A/B test, where everyone is split between two versions to find one winner, will increasingly sit alongside personalization that adapts a page to the visitor's source, industry, or behavior. Many testing platforms already offer some form of targeting or personalization. I expect more teams to ask "which version works best for this segment?" rather than "which version works best on average?" To prepare, consolidate your marketing data into a single source, because personalization is only as good as the data behind it.
SEO and CRO teams will share one set of goals
I think the wall between the people who drive traffic and the people who convert it will keep getting thinner. You cannot optimize a page well if the visitors arriving have the wrong intent, and content that ranks but never converts is a cost. In the next few years, I expect more teams to judge content by downstream results, such as qualified pipeline and retained customers, not just visits. To prepare, shift your focus from session metrics to customer lifetime value, and make sure your content team can see conversion data for the pages they write.
Frequently asked questions about conversion rate optimization
How much traffic do I need for A/B testing?
There is no single magic number. What matters is the number of conversions on the page you test, your baseline conversion rate, and the smallest improvement you want to detect. Plug those into a sample size calculator before you launch: if the required sample would take many months to collect, the test is not practical. In low-traffic situations, focus on qualitative user research and fixing obvious usability issues instead of running split tests.
What is a good conversion rate?
It depends on your industry, offer, traffic source, and how you define a conversion, so published averages are a weak guide. A free newsletter signup will naturally convert at a higher rate than a demo request for enterprise software. The most reliable benchmark is your own historical rate for the same page and traffic source, tracked consistently over time.
How does AI change the CRO landscape?
AI fundamentally accelerates the data analysis phase. Instead of spending hours reading through hundreds of survey responses or manually identifying patterns in heatmap data, AI can process vast amounts of unstructured feedback and quickly draft a list of testing hypotheses for a human to review and prioritize. Furthermore, AI copywriting tools can quickly produce dozens of compelling variations for headlines and calls to action, significantly speeding up the test creation process.
Should we test pricing on our SaaS website?
Testing your actual price points is incredibly risky and can anger existing customers if they discover different users are paying different amounts for the same software. Instead of testing the price itself, you should test how the pricing is presented. Experiment with annual versus monthly billing toggles, the order of your pricing tiers, or the specific features highlighted in your premium plans. In many cases, clear and transparent pricing presentation matters as much to buyers as the exact amount.
Why did my winning A/B test not increase overall revenue?
This is a very common scenario. If you optimize a button to make it highly clickable by using misleading text or clickbait, your micro-conversion rate will skyrocket. However, when those users realize the next step does not match their expectations, they will abandon the process immediately. A winning test only translates into revenue if the change genuinely improves the user experience and matches what the next step actually delivers.
How do I get leadership buy-in for a CRO budget?
Do not pitch optimization as a way to make the website look prettier. You must frame the conversation entirely around return on investment (ROI). Show leadership exactly how much money the company is currently spending on paid traffic, and use the conversion rate formula to show how a small lift in conversion rate, at the same traffic and spend, would lower customer acquisition cost and add revenue. Start with one small, well-documented test so leadership can see the process work before you ask for a larger budget.
Where to Start?
Feeling overwhelmed by data and frameworks is normal. The key is to start small and build momentum based on your current situation.
If you are a brand new startup with minimal traffic: Do not buy expensive A/B testing software. Your very first step should be to install a free session recording tool and watch exactly how your first few hundred visitors interact with your site. Focus entirely on identifying broken links, confusing navigation, and technical errors that are preventing users from understanding your core value proposition.
If you are an established company with messy data: Stop launching new marketing campaigns immediately. Dedicate one full afternoon to conducting a comprehensive audit of your analytics setup. Walk through your core conversion funnel yourself and ensure that every single step is tracking accurately. You cannot optimize your website if your baseline data is fundamentally flawed or double-counting conversions.
If you have a large marketing team but no formal process: Your immediate priority is to stop testing random ideas based on executive opinions. Implement the ICE or PIE framework in a shared spreadsheet today. Force every team member to submit their optimization ideas through this scoring system, and commit to only executing the highest-scoring tasks. This discipline turns a stream of opinions into a repeatable process.
About the author

Builder of Orova
Nguyễn Đỗ Trọng Ân has 8 years of experience in marketing, including 6 years managing market development across Asia. He builds Orova, a Biz AI Agent that never sleeps: it plans, runs and optimizes work for businesses.
Run your business with AI Agents
Orova is the always-on Biz AI Agent — it plans, runs, and optimizes the work for you.
Save time, unlock productivity.