
What Are Core Web Vitals? A Practical Guide for Non-Developers
Core web vitals are three Google metrics that measure how a page feels to real visitors: Largest Contentful Paint (LCP) for loading, Interaction to Next Paint (INP) for responsiveness, and Cumulative Layout Shift (CLS) for visual stability. A page passes when, at the 75th percentile of real-user visits, LCP is 2.5 seconds or less, INP is 200 milliseconds or less, and CLS is 0.1 or less. Imagine you spend months crafting a great article, only to notice visitors leaving before they read a single paragraph because the page loads slowly, freezes on taps, or jumps around. That is the problem these metrics describe. This guide explains each metric in plain language, shows the difference between field data and lab scores, and walks non-developers through practical fixes step by step, so you can turn red warnings into passing scores and build a technical foundation that serves both visitors and search engines.
What Are Core Web Vitals?
Core Web Vitals are a specific set of standardized performance metrics introduced by Google to measure the real-world user experience of a webpage. They evaluate loading speed, interactivity, and visual stability, and they form part of the page experience signals Google Search considers. Unlike generic speed tests, they focus on how humans perceive page performance.
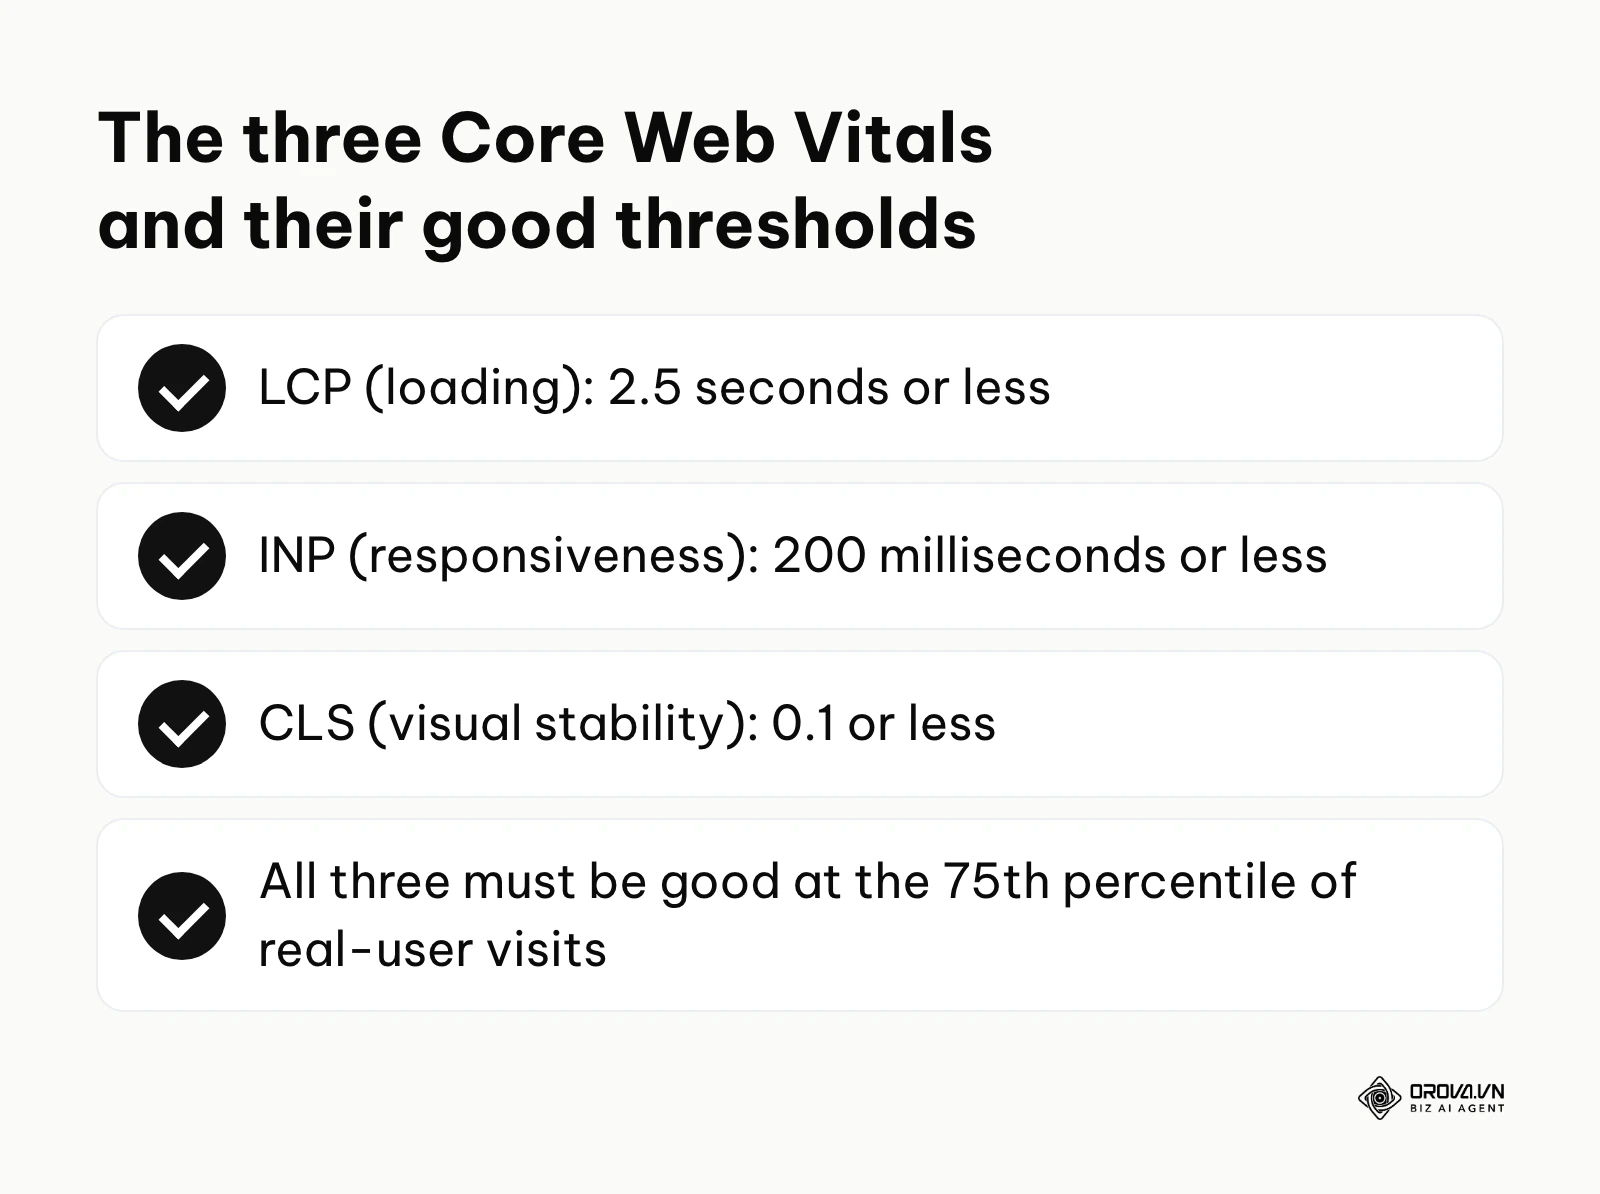
The current set has three metrics, and each has a "good" threshold published by Google: LCP of 2.5 seconds or less, INP of 200 milliseconds or less, and CLS of 0.1 or less. A page passes the assessment only when all three are good at the 75th percentile of real-user visits, meaning at least three out of four visits meet the target. INP replaced First Input Delay (FID) as a Core Web Vital in March 2024, so any guide that still teaches FID as a current metric is out of date.
The name originates from Google's broader Web Vitals initiative, which was designed to provide unified, simplified guidance for quality signals. The "Core" subset represents the absolute most critical, user-centric metrics that apply to all web pages across the internet. It is easy to confuse these metrics with older testing standards, so understanding the distinctions is vital.
| Concept | How it differs | Real-world example |
|---|---|---|
| Page experience | A broader set of signals that also includes HTTPS and avoiding intrusive interstitials. | A site with great speed but annoying pop-ups fails the broader Page Experience test. |
| Traditional Page Load Time | Measures when all files finish downloading, regardless of visibility. | A page takes ten seconds to fully load, but the main text is visible in one second. |
| Lighthouse Score | A lab-based simulation score out of 100 for general performance. | A staging site scores 99 in Lighthouse but fails real-world tests due to slow user devices. |
Think of a busy restaurant. Traditional speed metrics only measure how fast the chef cooks the meal in the hidden kitchen. These modern user experience metrics measure how quickly the waiter actually brings it to your table, whether the waiter interrupts your deep conversation to ask questions, and if someone violently bumps your table while you are trying to take a bite.
The Significance of Core Web Vitals
These metrics exist to solve a massive problem for everyday internet users: the frustrating unpredictability of browsing the modern web. For years, users suffered through pages that took forever to display the main article, buttons that completely ignored taps, and paragraphs that suddenly jumped off the screen just as you started reading them. By standardizing these measurements, Google created a universal language for developers, marketers, and business owners to align on what exactly constitutes a "good" experience.
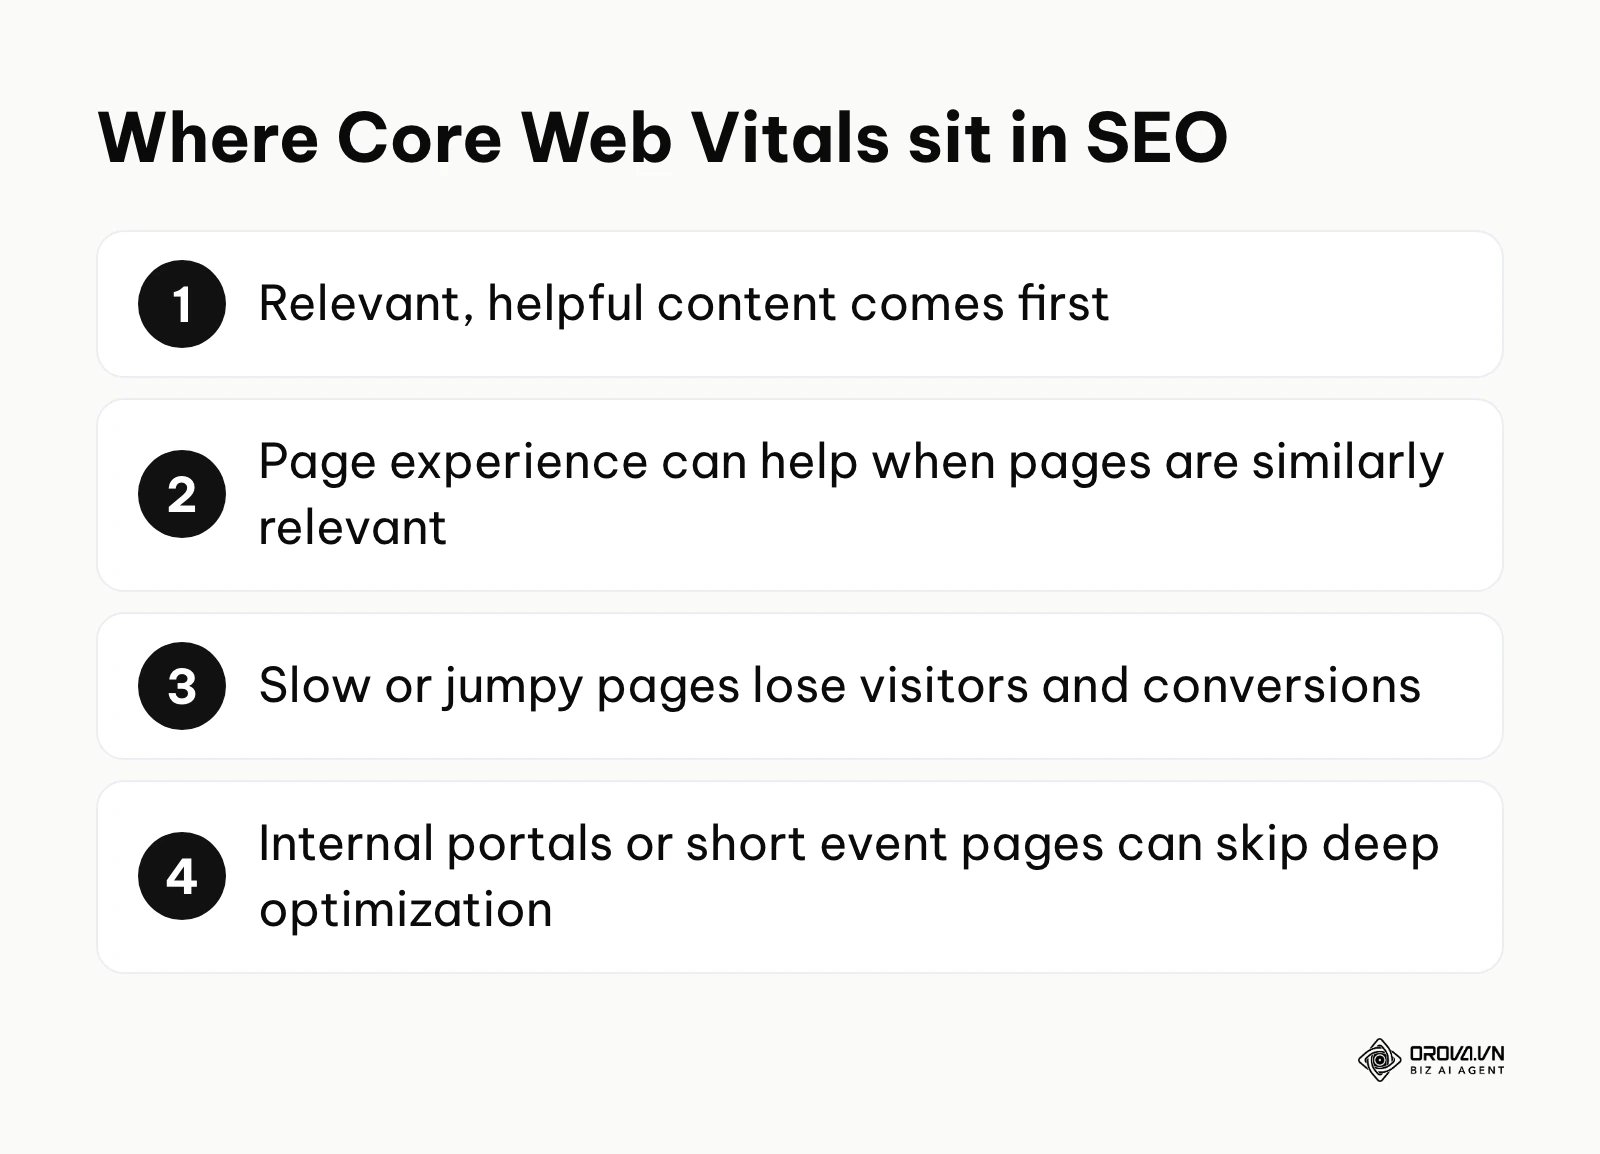
In the bigger picture of search engine optimization, these performance metrics sit firmly in the middle of the user journey. First, you must have high-quality content to answer the user's query. Then, the technical infrastructure must deliver that content smoothly. If you are new to how search works, start with what SEO is and how rankings are earned, because Core Web Vitals only make sense as one layer on top of relevant content. Google has said that these metrics are part of its page experience signals, but relevant, helpful content still matters more; a slow page with the best answer can still outrank a fast page with a weak one. Where competing pages are similarly relevant, a better experience can help, and it always helps the visitors who do arrive.
If you choose to ignore these warnings, you stand to lose more than a possible ranking edge. You lose the trust of your potential customers. Visitors who give up on a slow or jumpy page rarely come back. Furthermore, poor interactivity directly harms your conversion rates. If a user tries to add a product to their cart and the button does not respond instantly, they will often assume the site is broken and leave for a competitor.
When you don't need it yet: If you are running a closed internal corporate portal accessed exclusively by employees on high-speed office networks, heavily optimizing these specific metrics is often a complete waste of resources. Similarly, if your website is a temporary, single-page landing page for a three-day offline event with absolutely zero reliance on organic search traffic, you should skip this complex optimization. Instead, focus your efforts on functional testing and ensuring the server can handle short bursts of direct traffic, rather than chasing perfect automated performance scores.
The Value and Benefits of Core Web Vitals
The effort required to achieve green scores across the board is substantial, but the return on investment is equally impressive. The value generated from this technical optimization can be broadly categorized into two distinct layers: the macro value for the business entity and the practical benefits for the person implementing the changes.
Value for the Business
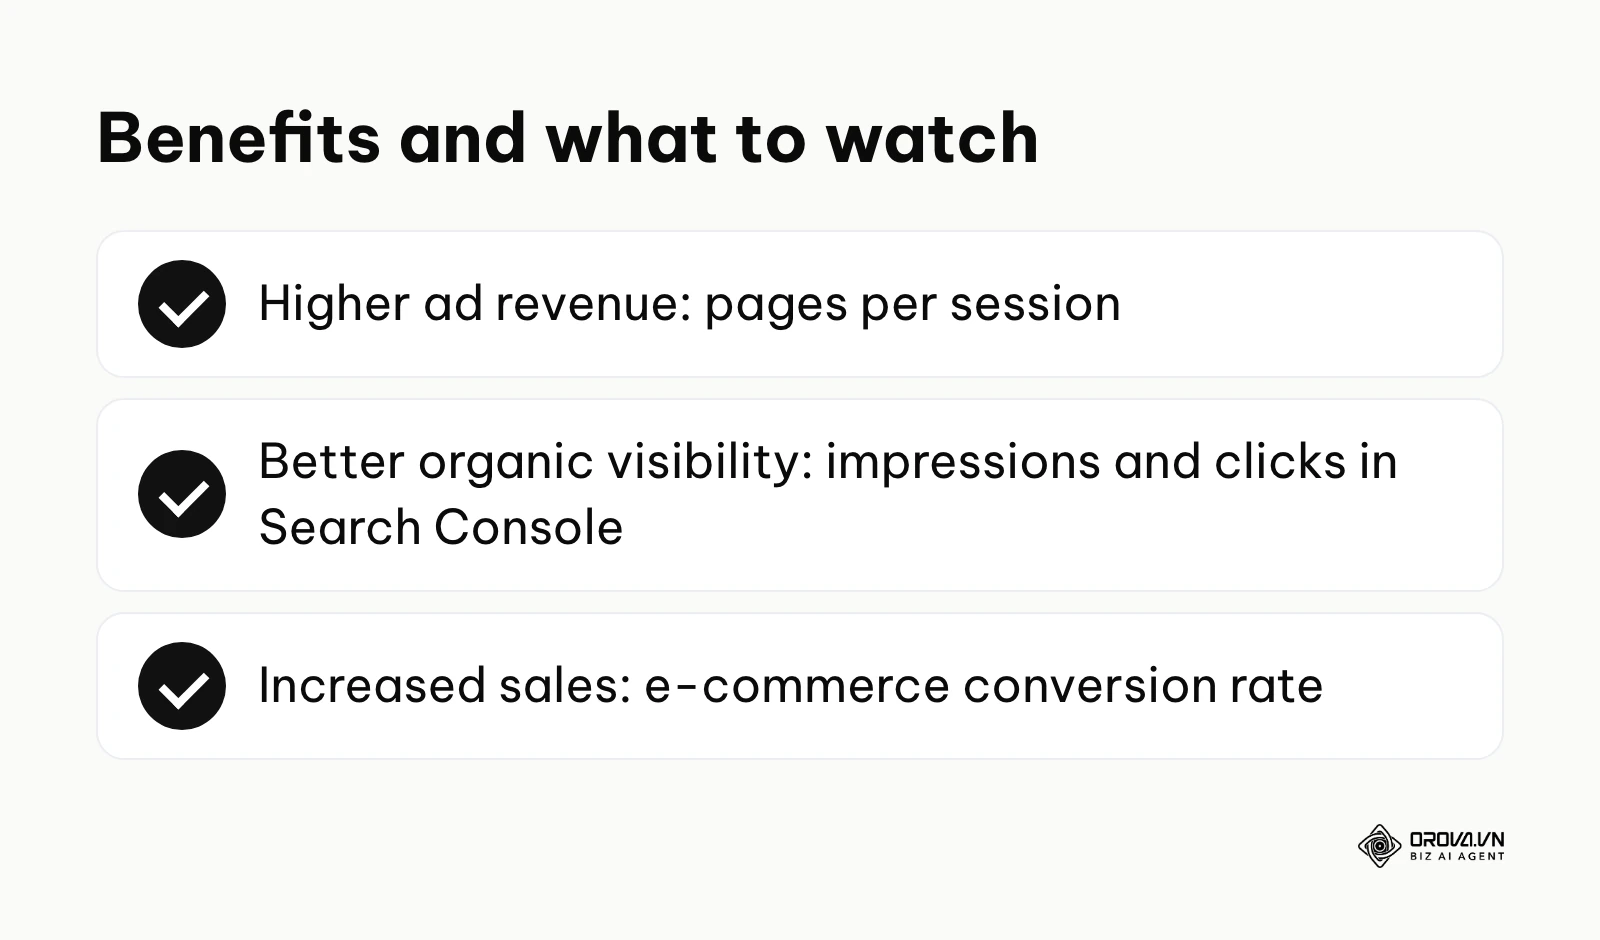
For business owners and executives, technical optimization translates directly into increased revenue and reduced risk. A faster website tends to keep users engaged longer, which can mean more page views, more ad impressions, and fewer abandoned checkouts. Balancing technical speed and conversion rate optimization ensures you do not lose hard-earned sales at the final checkout step simply because a script failed to load. Additionally, a technically sound website gives your content a stable foundation, so marketing results are not undermined by avoidable technical problems.
Benefits for the Implementer
For the SEO specialist, marketing manager, or web developer working in the trenches, achieving passing scores removes a massive layer of daily anxiety. It provides clear, undeniable proof to management that your technical initiatives are working. You no longer have to debate whether a page feels fast enough; you simply point to the green metrics in your dashboard. It also drastically reduces the time spent debugging vague user complaints about the site feeling "clunky" or "broken".
Illustrative example: An e-commerce mid-sized retailer managed by an in-house SEO specialist faced unexplainably high bounce rates on product pages. First, they audited their templates and found a massive hero banner loading late. They moved the image out of a heavy JavaScript slider, converted it to a modern format, and added a specific preload tag in the header. Initially, the image quality dropped too much causing complaints from the design team, which they fixed by adjusting the compression ratio to a safe 85%. Ultimately, the visual load time became visibly instantaneous, and users completely stopped clicking away before the main product appeared.
| Benefit | Measured by which metric | Where to check it |
|---|---|---|
| Higher ad revenue | Pages per session | Your analytics tool |
| Better organic visibility | Impressions and clicks | Google Search Console Performance report |
| Increased sales | E-commerce conversion rate | Your analytics tool or store dashboard |
Discover Orova.vn – a Biz AI Agent platform with OROVA SEO, a complete solution for every website. The system supports search engine optimization from A to Z with features including keyword research, writing new SEO-ready articles, optimizing existing content, rank tracking, plus competitor analysis and in-depth technical analysis. Sign up today to experience OROVA SEO completely free (offer valid through July 7, 2027).
How Core Web Vitals Work
To truly master how to improve core web vitals, you must understand the anatomy of a webpage load. A webpage is not a single picture that appears all at once; it is a complex assembly of hundreds of individual text files, images, and scripts that the browser must download, parse, and paint onto the screen in real-time. When you enter a URL, the browser races against the clock to build the visual experience. The core metrics measure specific, critical milestones during this chaotic assembly process.
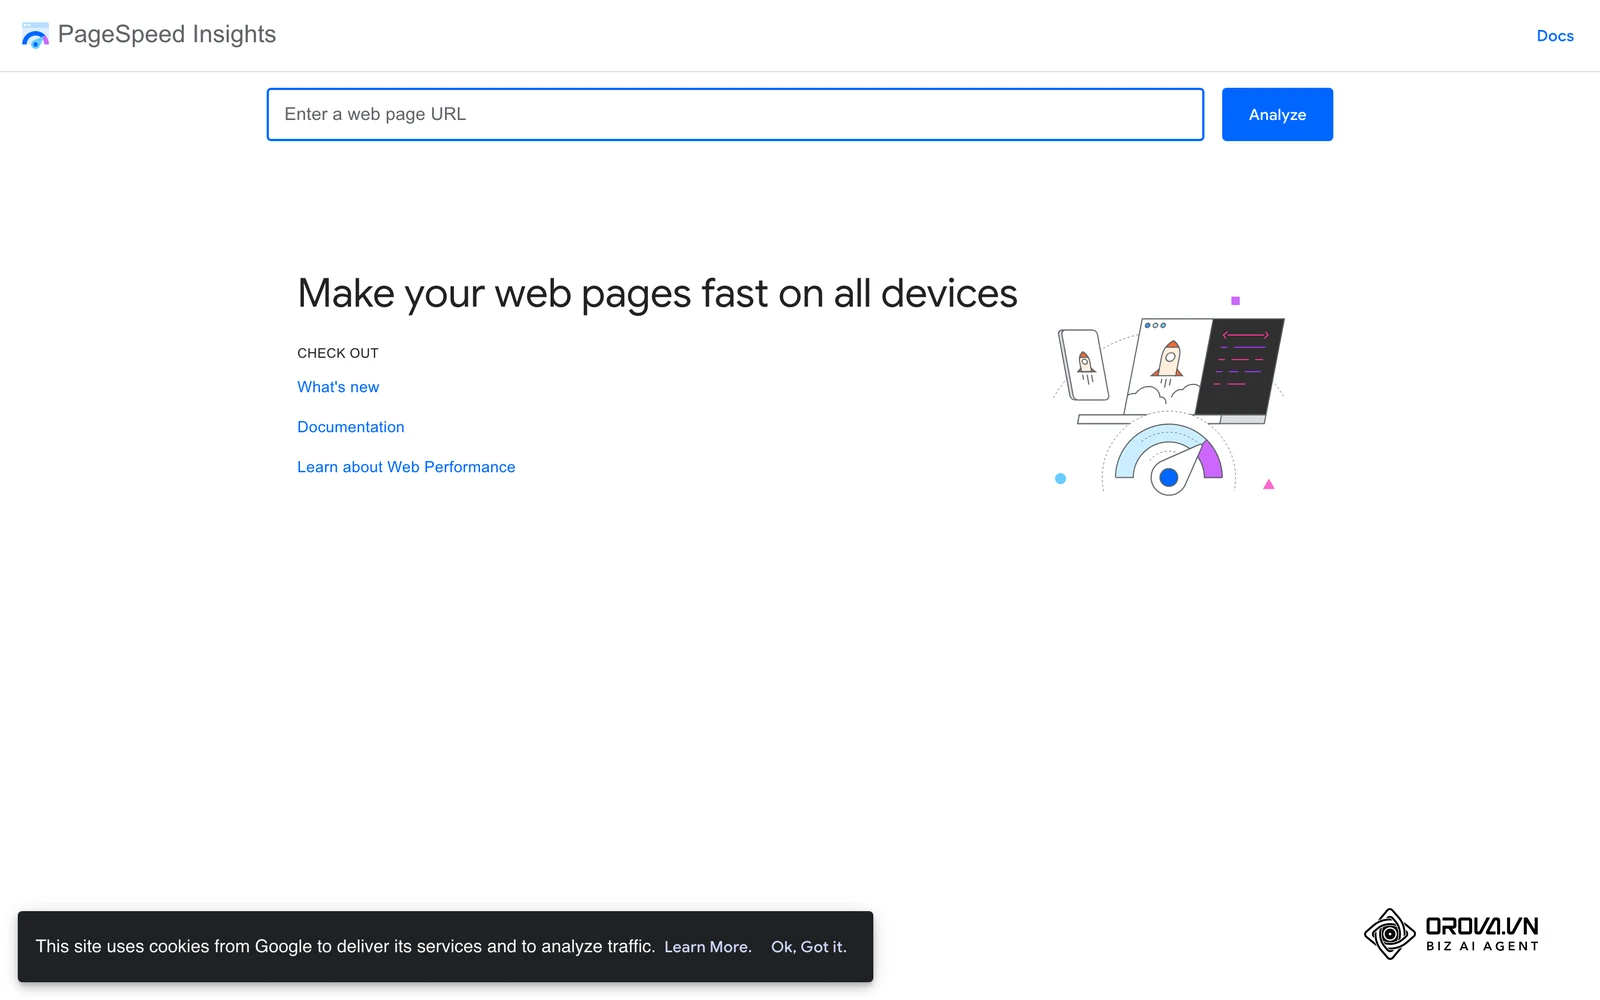
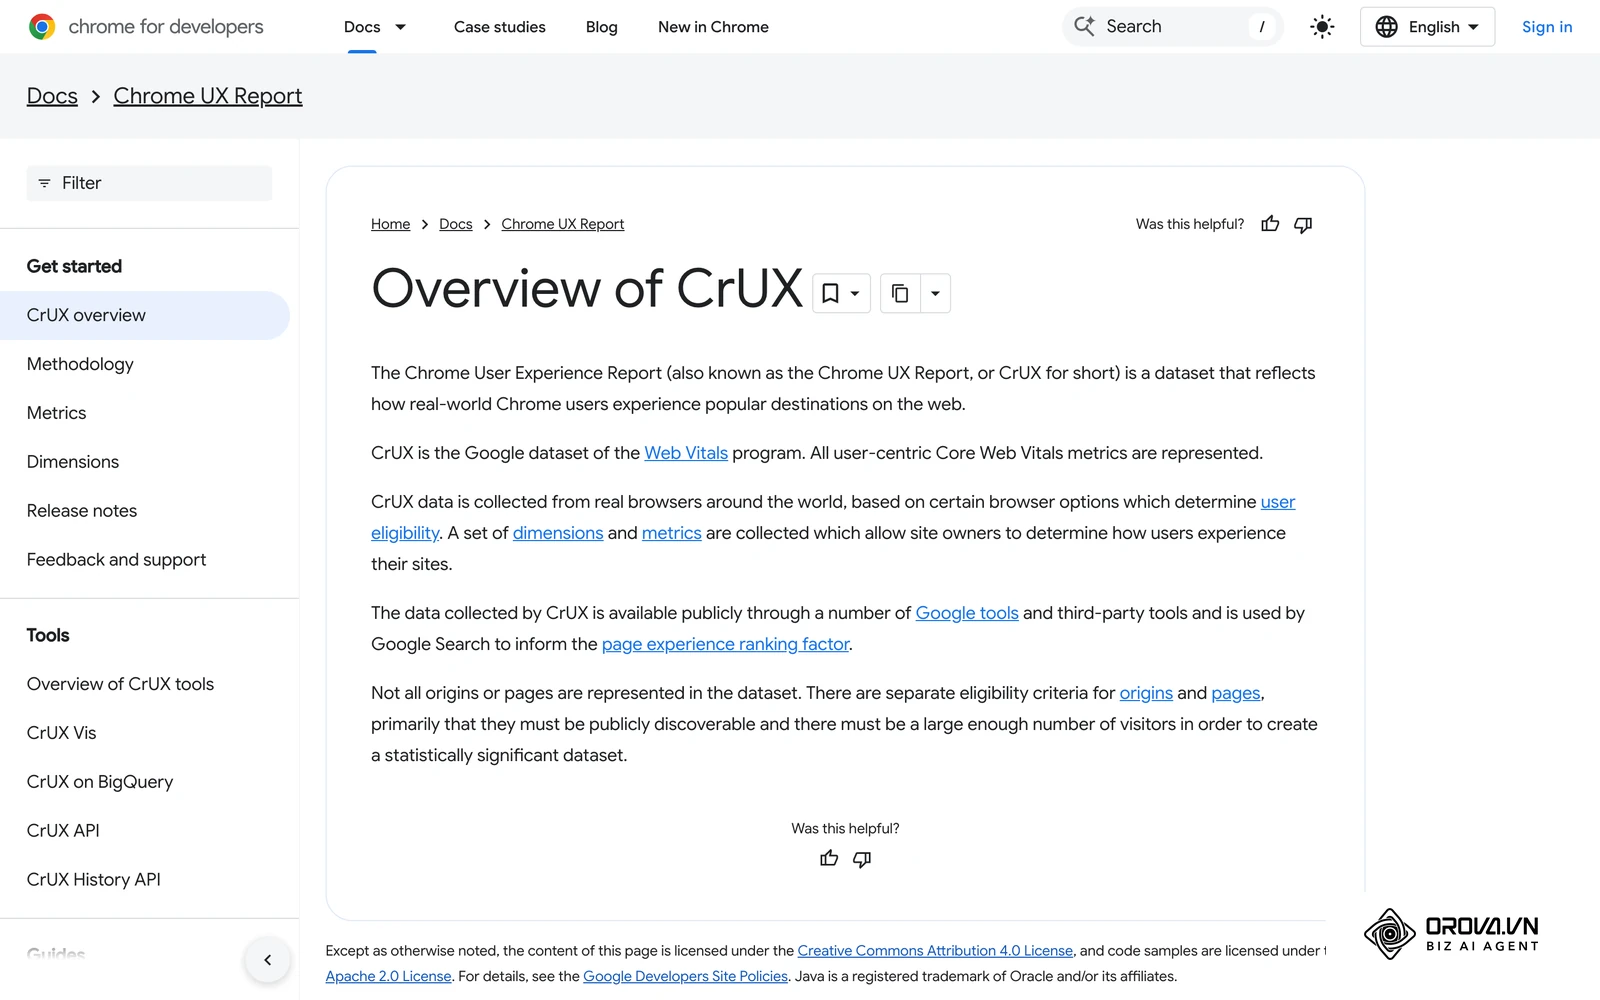
There are two ways to measure them, and mixing them up causes most of the confusion. Field data comes from real Chrome users visiting your site and is collected in the Chrome User Experience Report (CrUX) over a rolling 28-day window; this is what Search Console shows and what the pass or fail assessment uses, judged at the 75th percentile. Lab data comes from a simulated test, such as Lighthouse, run on one device with one network setting. Lab tests are ideal for debugging and checking a fix before release, but they cannot measure INP directly because no real person is interacting with the page, so lab tools use proxies such as Total Blocking Time instead.
Largest Contentful Paint (LCP)
The Largest Contentful Paint measures absolute loading performance. Specifically, it tracks exactly how long it takes for the single largest text block or image element visible within the user's initial screen area to fully render.
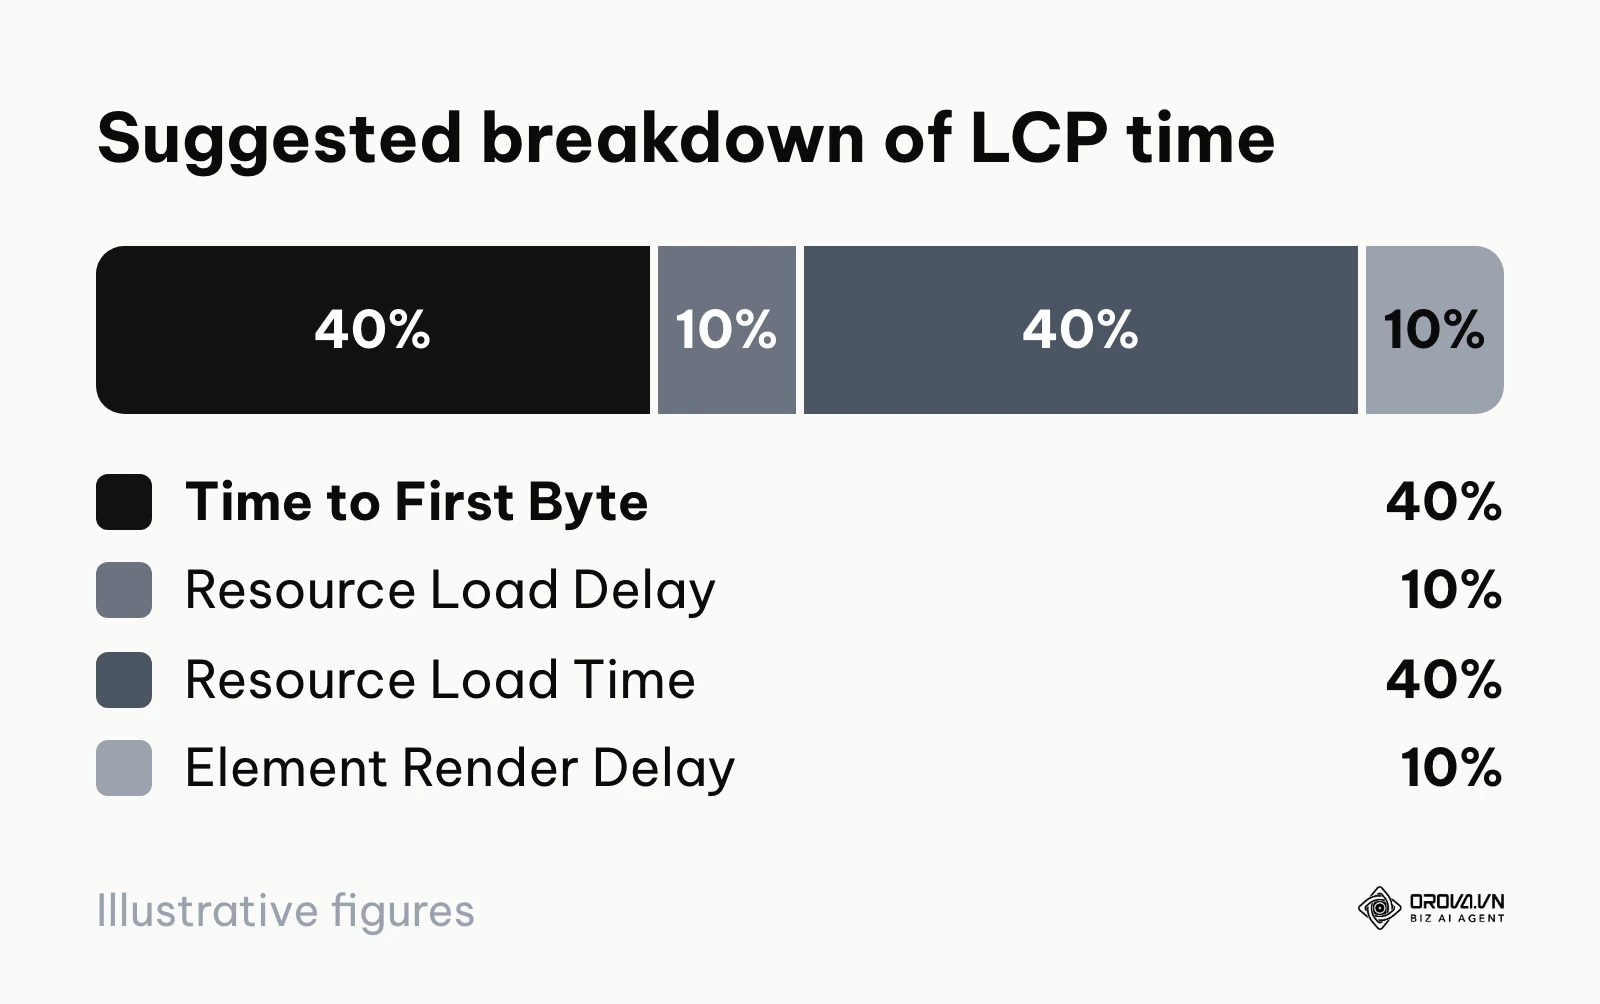
What it does: It answers the user's most urgent subconscious question: "Is this page actually loading anything useful?" A fast LCP reassures the user that the site is functioning and content is on the way. Inputs: The main inputs affecting this metric are your server response time, the physical file size of the largest asset (usually a hero banner or an H1 heading), and the priority assigned to that asset in the HTML code. Outputs: The output is a simple time measurement in seconds. A score of 2.5 seconds or less is considered good, while anything over 4.0 seconds is poor. Google's web.dev guidance breaks LCP into four parts and suggests that, on a well-optimized page, roughly 40% of the time goes to server response (Time to First Byte), roughly 40% to loading the resource itself, and under 10% each to the resource load delay and the element render delay. Common breaking points: The most frequent reason sites fail this check is lazy-loading the hero image. Lazy-loading is a great technique for images far down the page, but applying it to the main image forces the browser to wait unnecessarily before painting the most critical element. Heavy reliance on client-side rendering (where JavaScript builds the HTML) also severely delays this metric.
Cumulative Layout Shift (CLS)
Cumulative Layout Shift measures visual stability. It calculates how much the visible content unexpectedly moves around the screen while the page is still loading and rendering new elements.
What it does: It prevents the intensely frustrating experience of trying to tap a link or read a sentence, only to have the text suddenly pushed down the screen by a late-loading advertisement or an unoptimized image. Inputs: The inputs are the dimensions of images, embedded videos, dynamic advertisements, and injected promotional banners. The browser needs to know exactly how much space these items will take up before they finish downloading. Outputs: The output is a score starting from zero. A score of zero means absolutely no shifting occurred. A score of 0.1 or less is considered good, meaning the shifts were barely noticeable, while anything above 0.25 is poor. Common breaking points: Failing to include explicit width and height attributes in image tags is the number one cause of layout shifts. When the browser does not know the image dimensions, it assumes the image takes up zero space. When the image finally downloads, the browser is forced to shove all surrounding text out of the way to make room. Dynamically injecting newsletter signup forms above existing content is another frequent offender.
Interaction to Next Paint (INP)
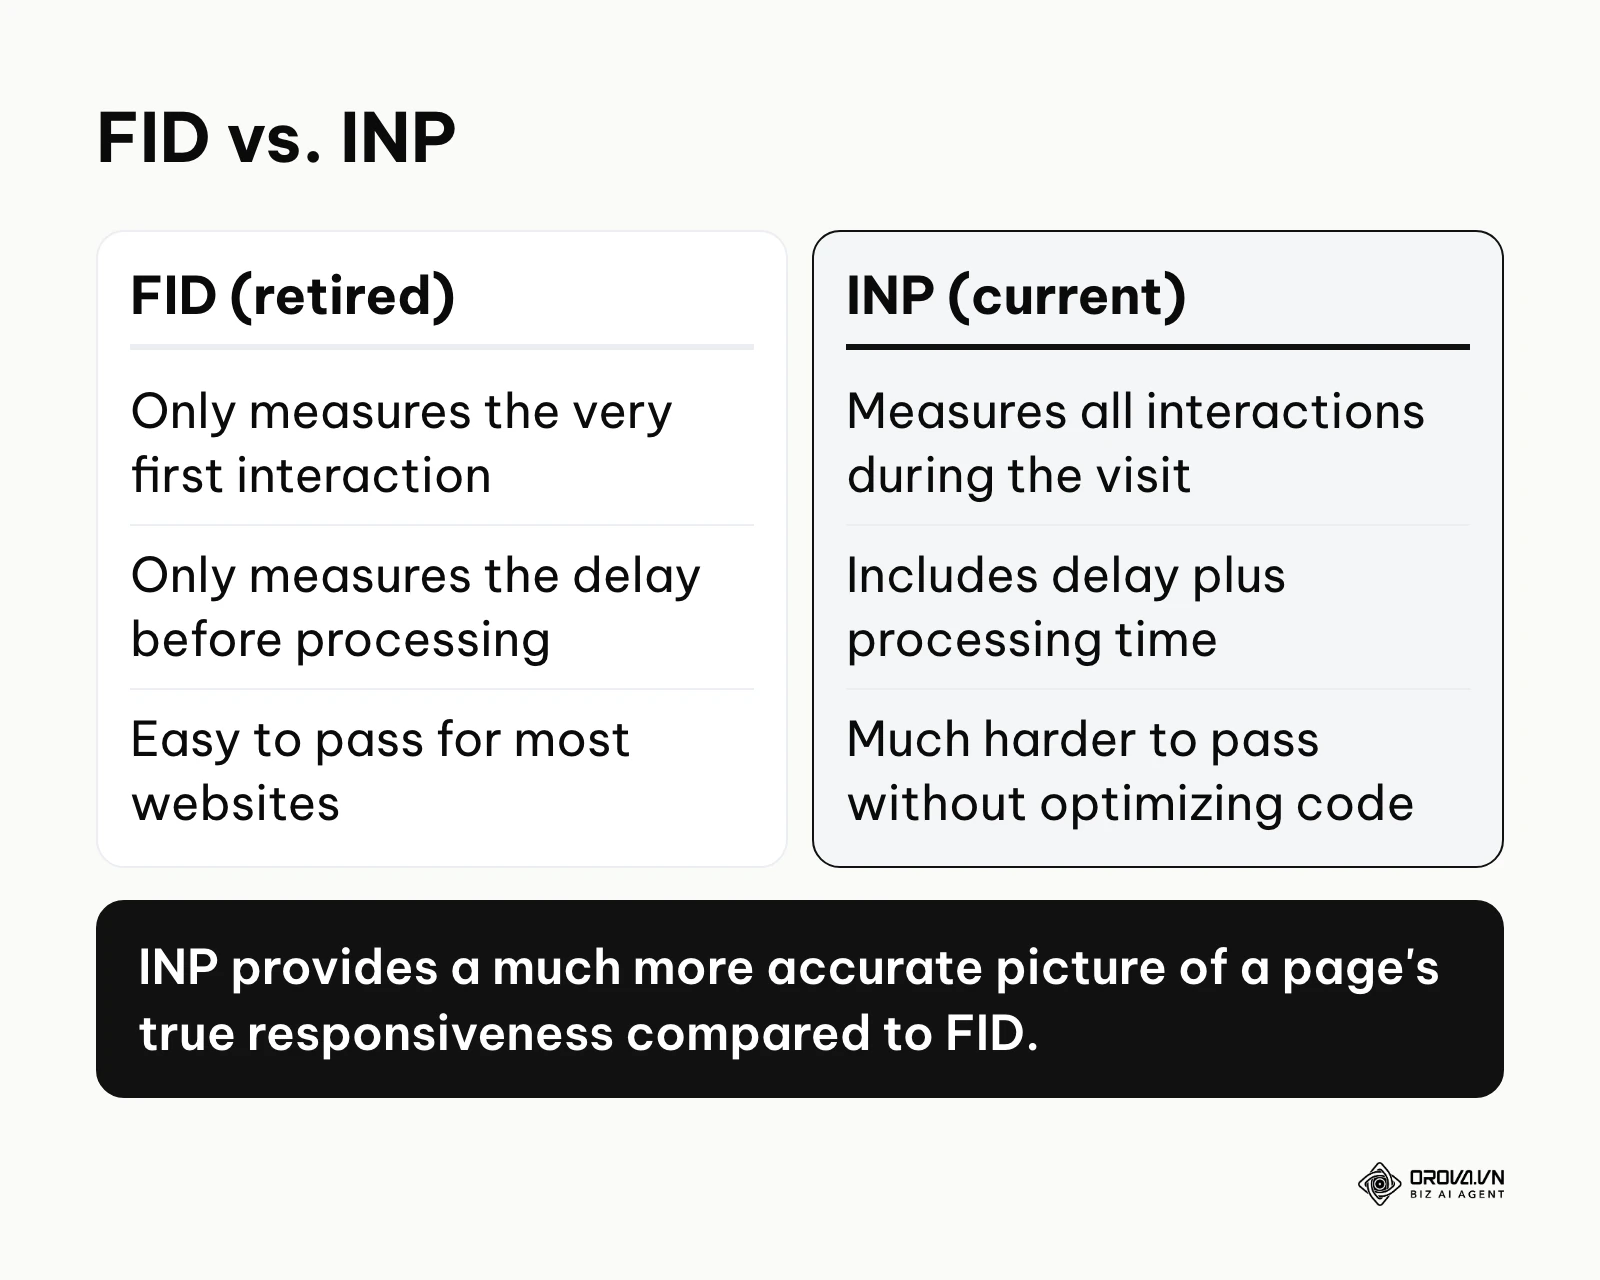
Interaction to Next Paint is the newest of the three and arguably the most complex to optimize. It replaced First Input Delay (FID) in March 2024: FID only measured the delay before the browser started handling the very first interaction, while INP looks at the full time until the screen visibly updates, across interactions throughout the visit. It measures the overall responsiveness of a page to user interactions, such as mouse clicks, touchscreen taps, and keyboard presses throughout the entire lifespan of the user's visit.
What it does: It ensures that when a user attempts to interact with your site, the interface responds immediately with visual feedback. If a user clicks an accordion menu, the menu should open instantly, not freeze for a second while the browser struggles to process background tasks.Inputs: The primary inputs are the volume and complexity of JavaScript running on your page. This includes your own interactive scripts, but more often, it involves massive third-party scripts like analytics trackers, live chat widgets, and marketing pixels. Outputs: The output is measured in milliseconds. A score of 200 milliseconds or less is good, while anything over 500 milliseconds indicates a severely degraded, laggy experience. Common breaking points: The browser operates on a single main thread. If that main thread is busy executing a massive, unoptimized JavaScript bundle, it simply cannot process the user's tap event until that long task finishes. Heavy third-party tracking scripts are notorious for monopolizing the main thread and causing massive interaction delays. Deep interaction to next paint optimization requires chunking these scripts and yielding control back to the main browser thread frequently.
Illustrative example: A SaaS startup managed by a single technical marketer experienced lagging buttons on their pricing page. They used the performance profiler in developer tools to identify a heavy live chat script causing severe delays. They configured Google Tag Manager to delay the script execution entirely until the user scrolled, and chunked their main interactive bundle into smaller files. The chat tool completely failed to load on old Safari browsers initially, which they fixed by adding a fallback timeout script. Consequently, the interactive buttons responded immediately upon touch, allowing visitors to expand pricing tiers without any frustrating freezes.
| Metric | Primary focus area | Good (75th percentile) | Poor |
|---|---|---|---|
| LCP | Loading speed | 2.5 seconds or less | Over 4.0 seconds |
| INP | Interactive responsiveness | 200 milliseconds or less | Over 500 milliseconds |
| CLS | Visual layout stability | 0.1 or less | Over 0.25 |
What to Do to Adapt and Start
Transitioning a failing website into a high-performance asset requires distinct approaches depending on your technical expertise and your role within the organization. A small business owner using a visual page builder needs entirely different advice than a seasoned agency developer.
For WordPress Site Owners
If you manage a WordPress site and do not know how to code, do not panic. You can resolve the vast majority of performance issues by utilizing high-quality caching and optimization plugins without ever touching a single line of PHP.
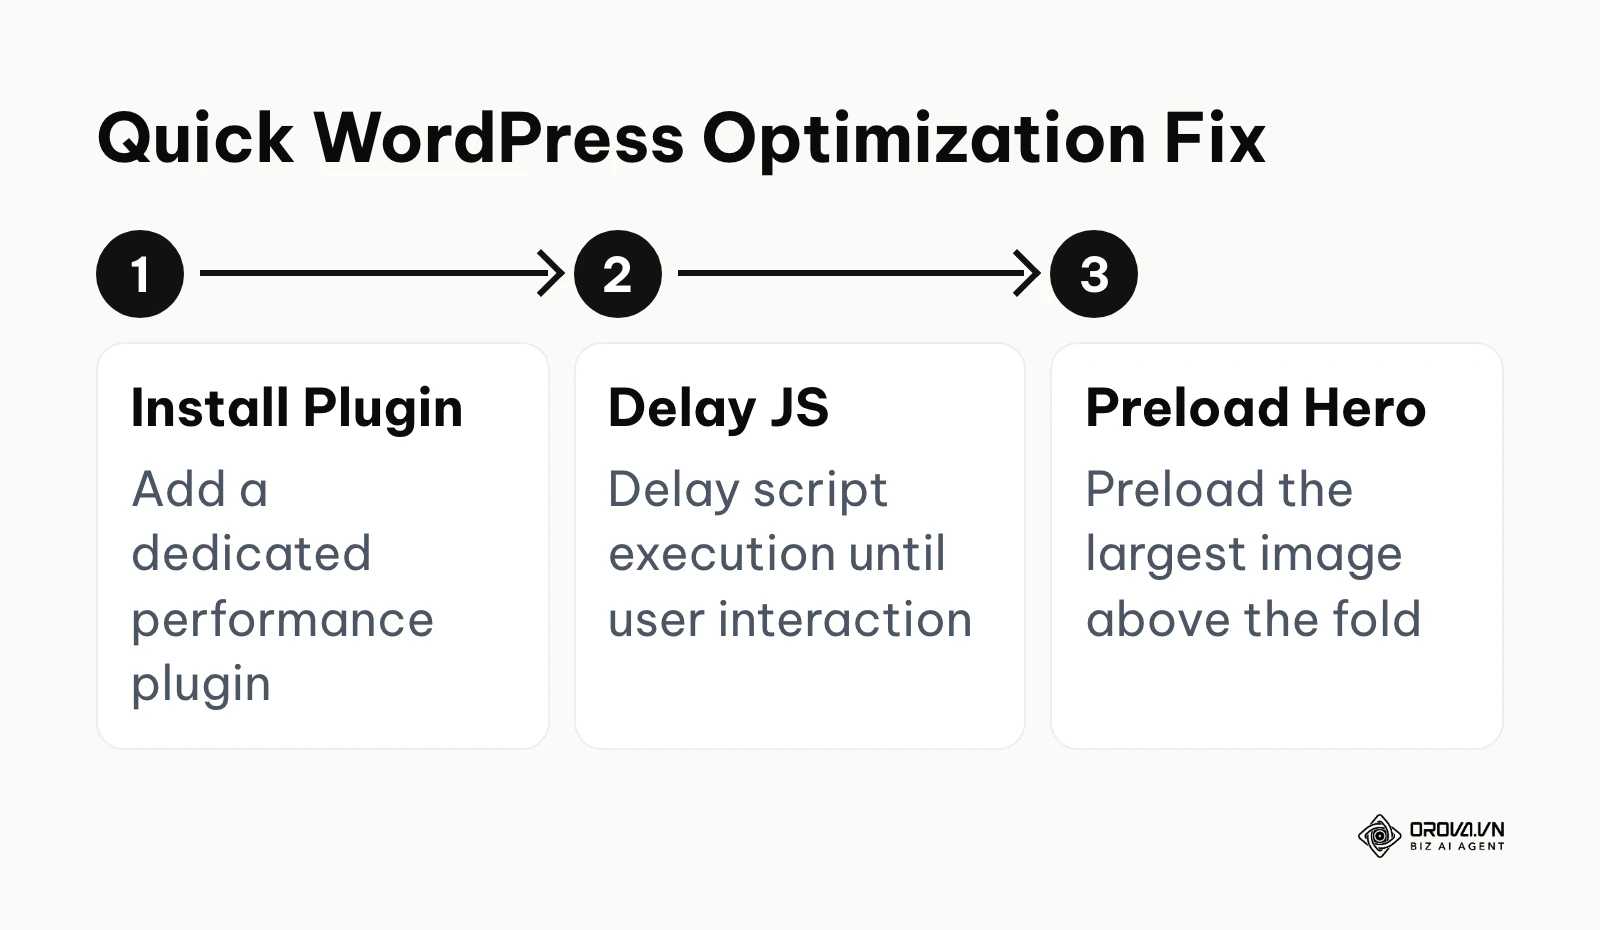
- Install one performance plugin: Plugins such as WP Rocket or Perfmatters bundle the settings below in one place. Whatever you choose, run only one optimization plugin at a time.
- Delay JavaScript execution: This is often one of the most effective settings for INP problems. Configure your plugin to delay the execution of non-critical scripts (like chat widgets and analytics) until the user actually interacts with the page (scrolls or moves the mouse).
- Preload critical assets: Identify the exact image that triggers your LCP warning in PageSpeed Insights. Paste the URL of that image into the preloading section of your caching plugin to force the browser to fetch it immediately.
- Remove unused CSS: Enable the feature to generate critical CSS and strip out unused styles. This vastly reduces the initial payload the browser has to parse.
Illustrative example: A local plumbing service website maintained by a freelance web designer struggled with severe layout shifts. They started by installing a caching plugin and then added explicit width and height attributes to all service images across the site. A hurdle emerged when a dynamic third-party booking widget kept pushing the footer down unpredictably; they resolved this by placing the widget inside a fixed-height container CSS div. The final result was a perfectly stable page where mobile users no longer misclicked the contact button by accident.
For In-house SEO Managers
As an in-house manager, your role is less about writing code and more about triaging errors and managing developer resources efficiently. You must stop handing developers massive lists of minor warnings and start prioritizing the highest-impact fixes.
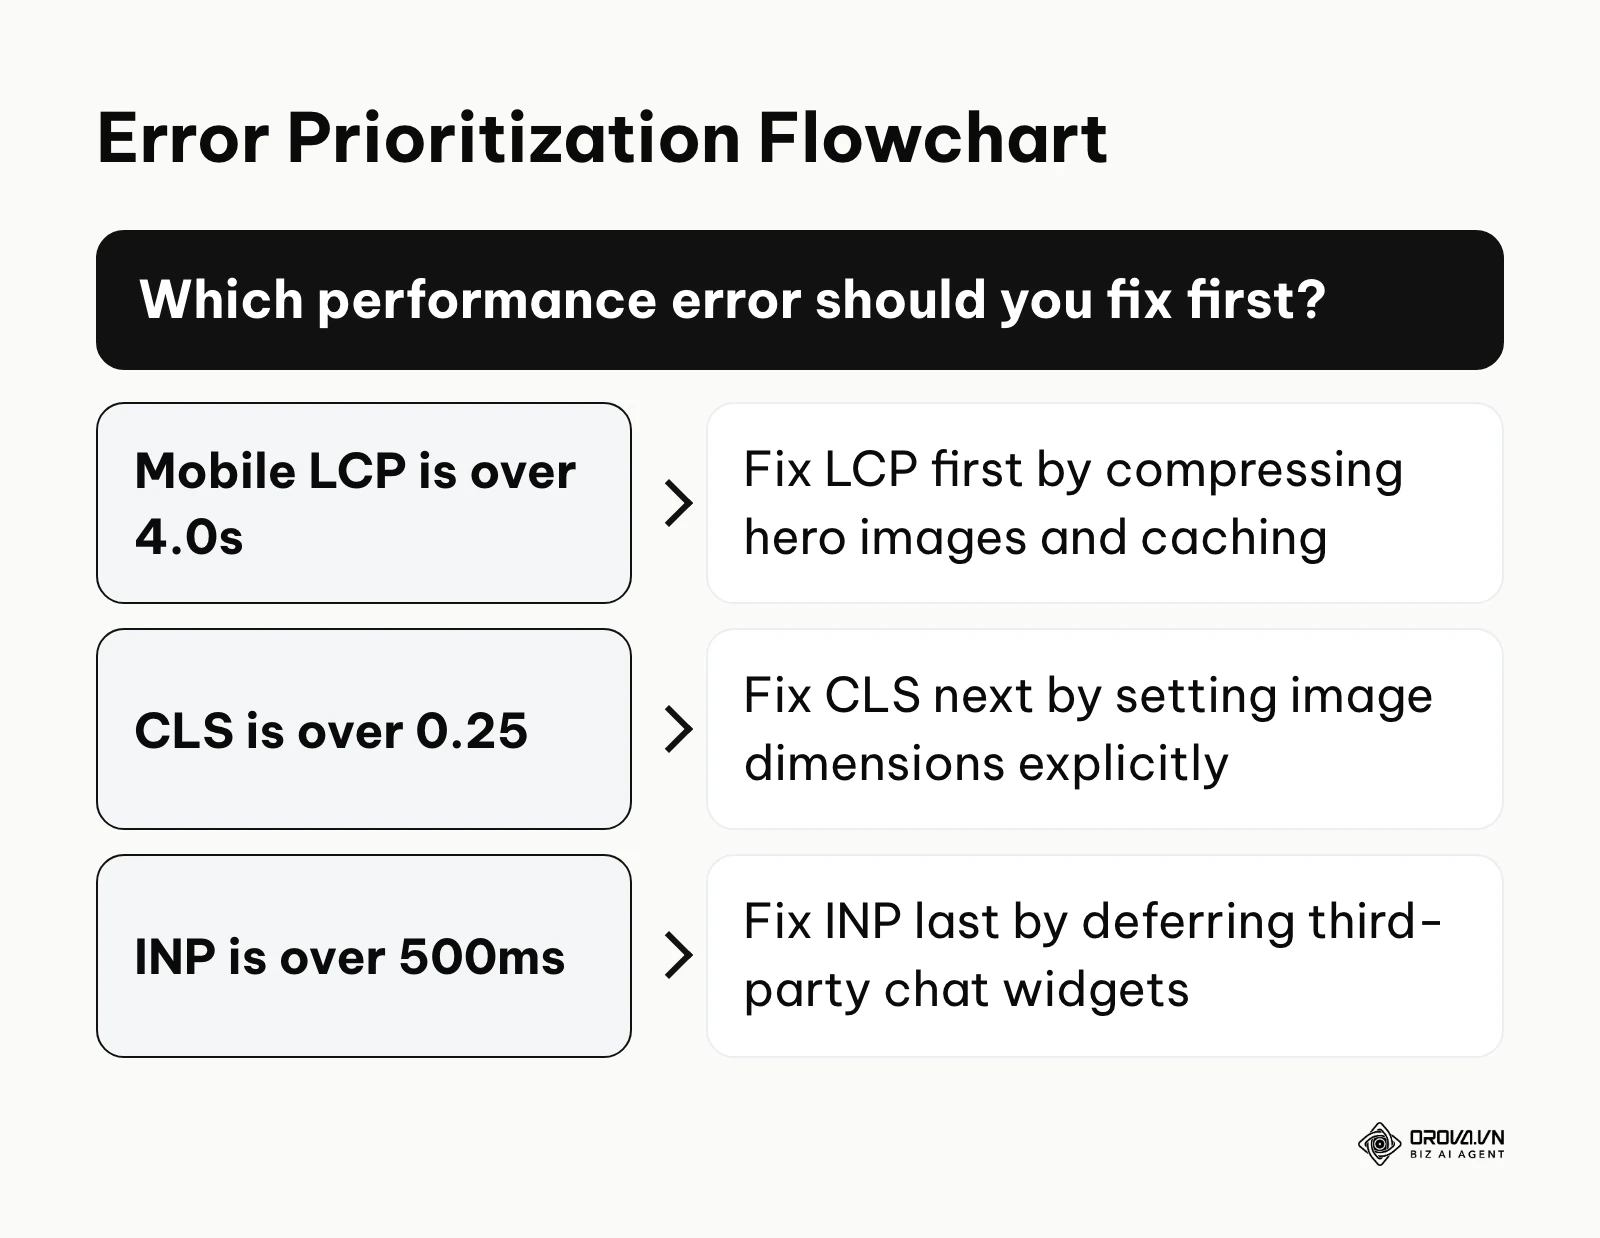
- Group URLs by template: Errors rarely happen on just one page. They happen across entire templates (e.g., all blog posts, all product pages). The Core Web Vitals report in Google Search Console already groups similar URLs, so use those groups to identify the template causing the failure.
- Triage based on severity: As a default order, fix LCP first, as it affects the initial impression. Fix CLS second. Leave INP for last, as it usually requires the most complex engineering effort. If one metric is far into the poor range, move it to the front.
- Audit third-party tags: Sit down with the marketing team and ruthlessly audit Google Tag Manager. Remove any marketing pixels or tracking scripts that are no longer actively being used.
- Create specific tickets: Do not simply tell developers to "fix the speed." Create precise tickets like "Preload the main product image on the WooCommerce single product template to resolve the 4.5s LCP error."
For Agencies and Freelancers
If you are optimizing sites for clients, you need to build a scalable, repeatable process that proves the value of your ongoing retainer work.
- Establish a performance baseline: Before touching anything, record the exact scores for the homepage, a category page, and a single post. Document this in a shared spreadsheet, as part of the same baseline you would build in a step-by-step SEO audit case study.
- Automate tracking: Use the PageSpeed Insights API connected to a Google Sheets template to pull scores automatically every week. This creates a historical log of performance degradation over time.
- Implement performance budgets: Set strict limits on image sizes and script payloads. If a client attempts to upload a 5MB uncompressed image to their blog, the system should automatically compress it or reject it. Before diving into code, make sure the robots.txt file isn't accidentally blocking the CSS and JavaScript files Google needs to render the page.
Common Mistakes and How to Avoid Them
| Mistake | Severe Consequence | How to Avoid |
|---|---|---|
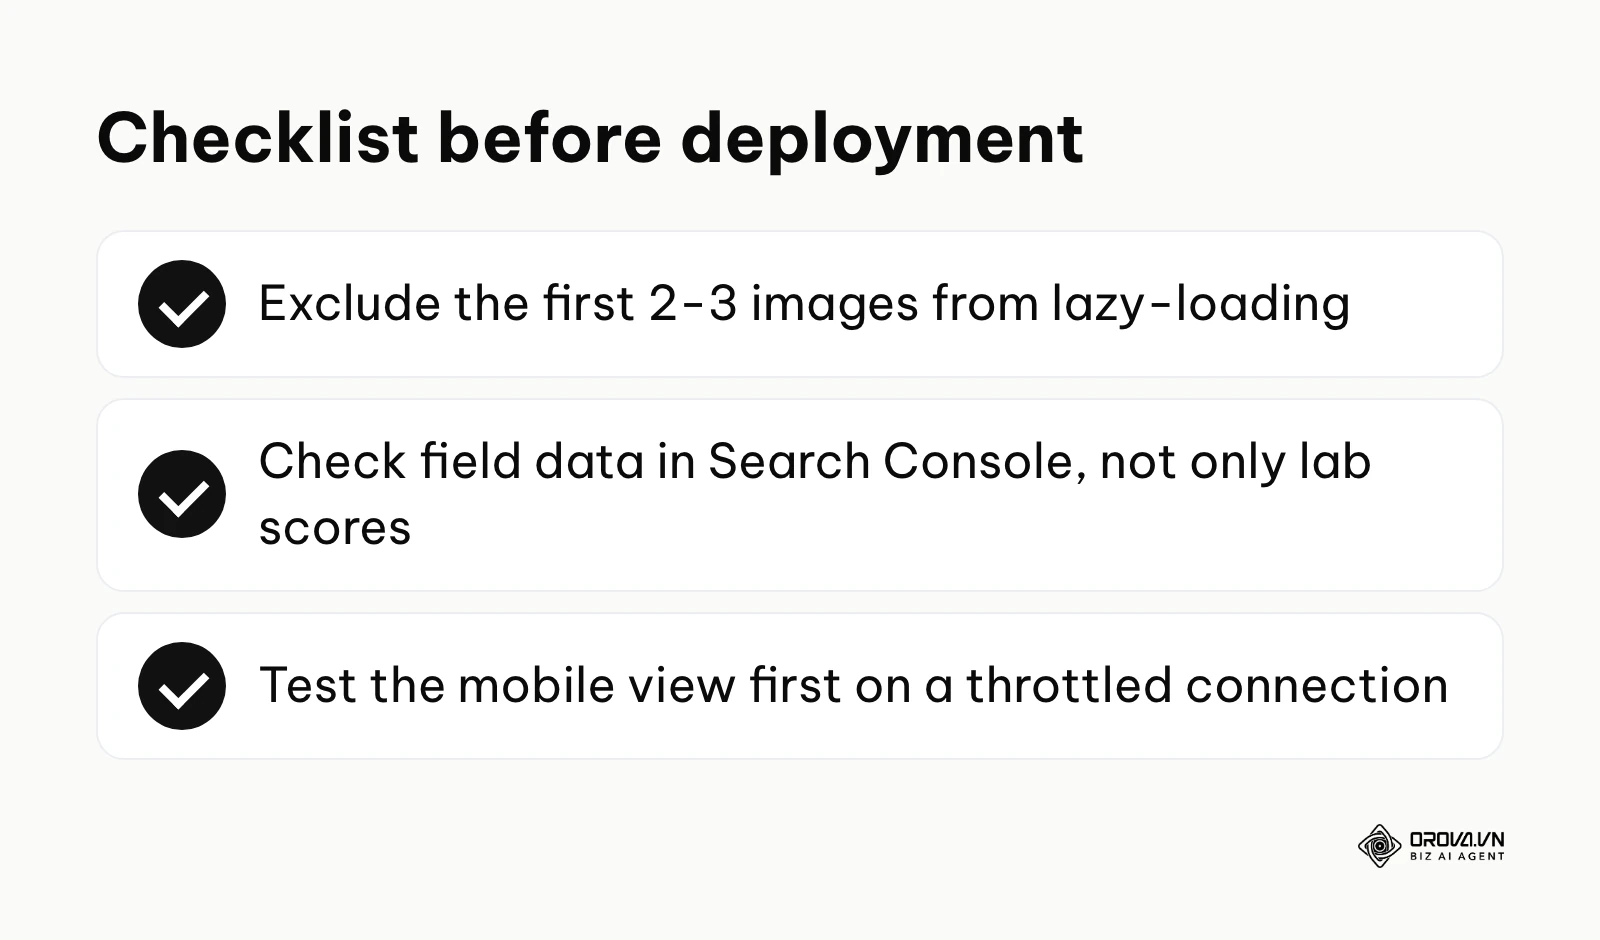
| Lazy-loading everything | Destroys the LCP score entirely | Exclude the first 2-3 images on the page from being lazy-loaded. |
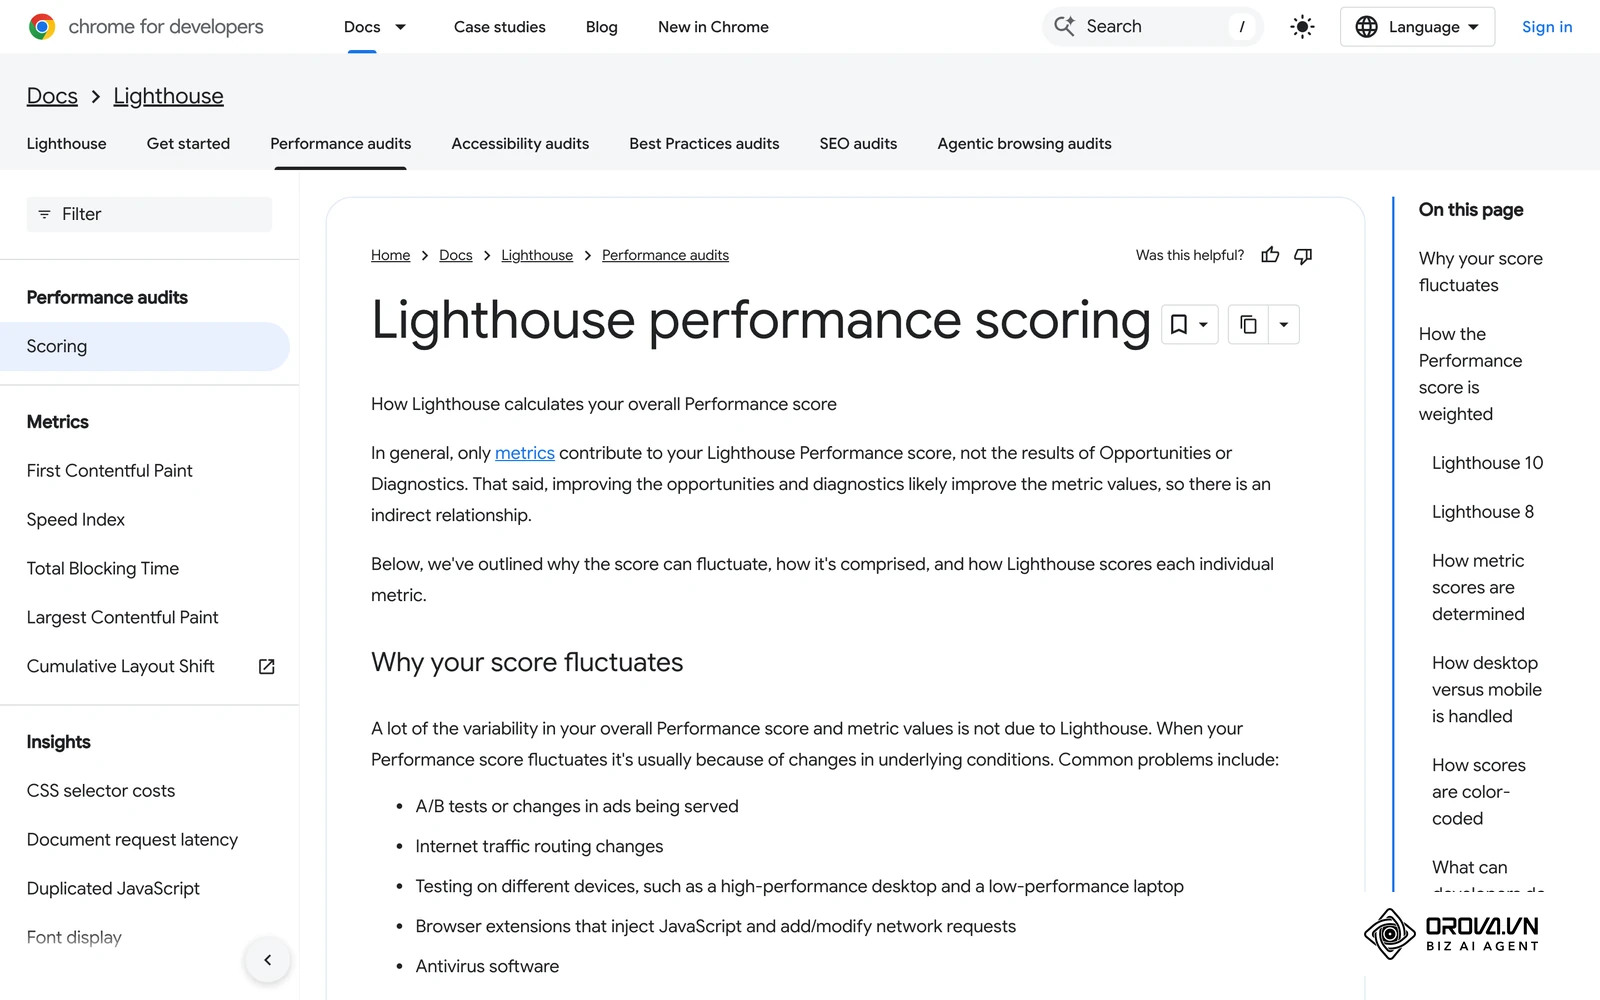
| Relying only on Lab data | Surprised by ranking drops | Always check the Field Data section in Search Console for real user metrics. |
| Ignoring mobile testing | Missing what most visitors experience | Google indexes the mobile version first, so test the mobile view first, using a throttled mobile connection. |
With OROVA.VN and the OROVA SEO module, you put an end to the exhausting days of manual work for good. Instead of struggling for hours to write articles and compile reports, the entire process is now optimized and completed in just 5 minutes.
Where Core Web Vitals Are Heading in the Next Few Years: The Author's Take
The metrics have already changed once, when INP replaced FID, so I do not treat the current set as permanent. Here is how I read the signals today.
Expectations will rise faster than the thresholds
I think the published thresholds may stay stable for a while, but what users tolerate is moving faster. Mobile networks keep improving and competing sites keep getting lighter, so a page that only scrapes past "good" today may feel slow next to its rivals in two or three years. My suggestion is to treat the thresholds as a floor rather than a goal: keep the hero image light, cache aggressively, and leave yourself a margin instead of aiming for the bare pass.
AI will take over more of the routine fixing
My read is that performance tooling will shift from pointing out problems to applying more of the routine fixes on its own: compressing images, choosing formats, deferring scripts, and serving lighter code to slower devices. I would not expect it to remove the need for judgment, because someone still has to decide which third-party scripts are worth their cost. To prepare, document which scripts and plugins exist on your site and why, so an automated tool, or a person, has clear rules to work with.
Measurement will lean more on your own data
I believe privacy changes and script blocking will make some third-party measurement scripts less reliable over time, which makes it harder to see detailed real-user data beyond what Google's own report shows. I expect more teams to collect basic performance timings themselves, on their own servers, alongside Search Console. Start small now: record LCP, INP, and CLS for your key templates in a way you own, so you are not relying on a single external view of your site.
Frequently Asked Questions
Why is PageSpeed Insights green but Google Search Console red?
This is the most common point of confusion for website owners. The green score you see in PageSpeed Insights is usually the Lighthouse lab score, a simulated test on one device and one network setting. Google Search Console, however, relies on field data collected from real Chrome users over the previous 28 days, many of them on older phones and slower connections. When the two disagree, trust the field data for judging real experience; it is what the Core Web Vitals assessment is based on. Use lab data to find and test fixes.
Does converting all images to WebP guarantee a good LCP score?
No, it does not guarantee a passing score. While modern image formats like WebP or AVIF are significantly smaller in file size than traditional JPEGs, they only solve the download speed portion of the equation. If your highly compressed WebP image is hidden behind a complex JavaScript slider that takes three seconds to execute, your LCP will still be terrible. You must combine modern formats with proper prioritization, ensuring the hero image is discovered early in the HTML document.
How can I improve INP when my site requires heavy third-party tracking?
Improving interactivity while maintaining complex marketing stacks is incredibly challenging. The most effective strategy is implementing delayed script execution. You do not need to load the live chat widget or the heavy analytics heat-mapping tool the millisecond the user arrives. Configure your tag manager or optimization plugin to wait until the user scrolls down the page or moves their mouse before firing these heavy scripts. This keeps the main thread entirely clear for the critical first few seconds of interaction.
Do we still need Core Web Vitals when AI answers user queries directly?
Yes. Even as AI engines summarize information and provide direct answers in search results, they still rely on web pages for source material, and a page that loads reliably is easier for any crawler to fetch. More importantly, when users do click through an AI citation to read the full source or make a purchase, a poor, shifting, laggy experience will still drive them away immediately, destroying your conversion rates regardless of how they found your site.
What is the fastest way to fix CLS on dynamic ads?
The absolute fastest way to stop layout shifts caused by dynamic advertising networks like Google AdSense is to reserve the exact pixel space for the ad before it loads. Wrap your ad insertion code in a CSS <div> container and assign it a fixed minimum height (for example, min-height: 250px;). Even if the ad takes several seconds to download, the browser will leave a blank white box of the correct size, preventing the surrounding text from violently jumping when the ad finally appears.
Where to Start?
Diving into technical optimization can feel like staring at a massive, tangled wall of wires. Knowing exactly what to do first depends entirely on the current state of your website and your historical optimization efforts. Learning how to use Google Search Console for SEO is your first step toward understanding your real-world performance baseline.
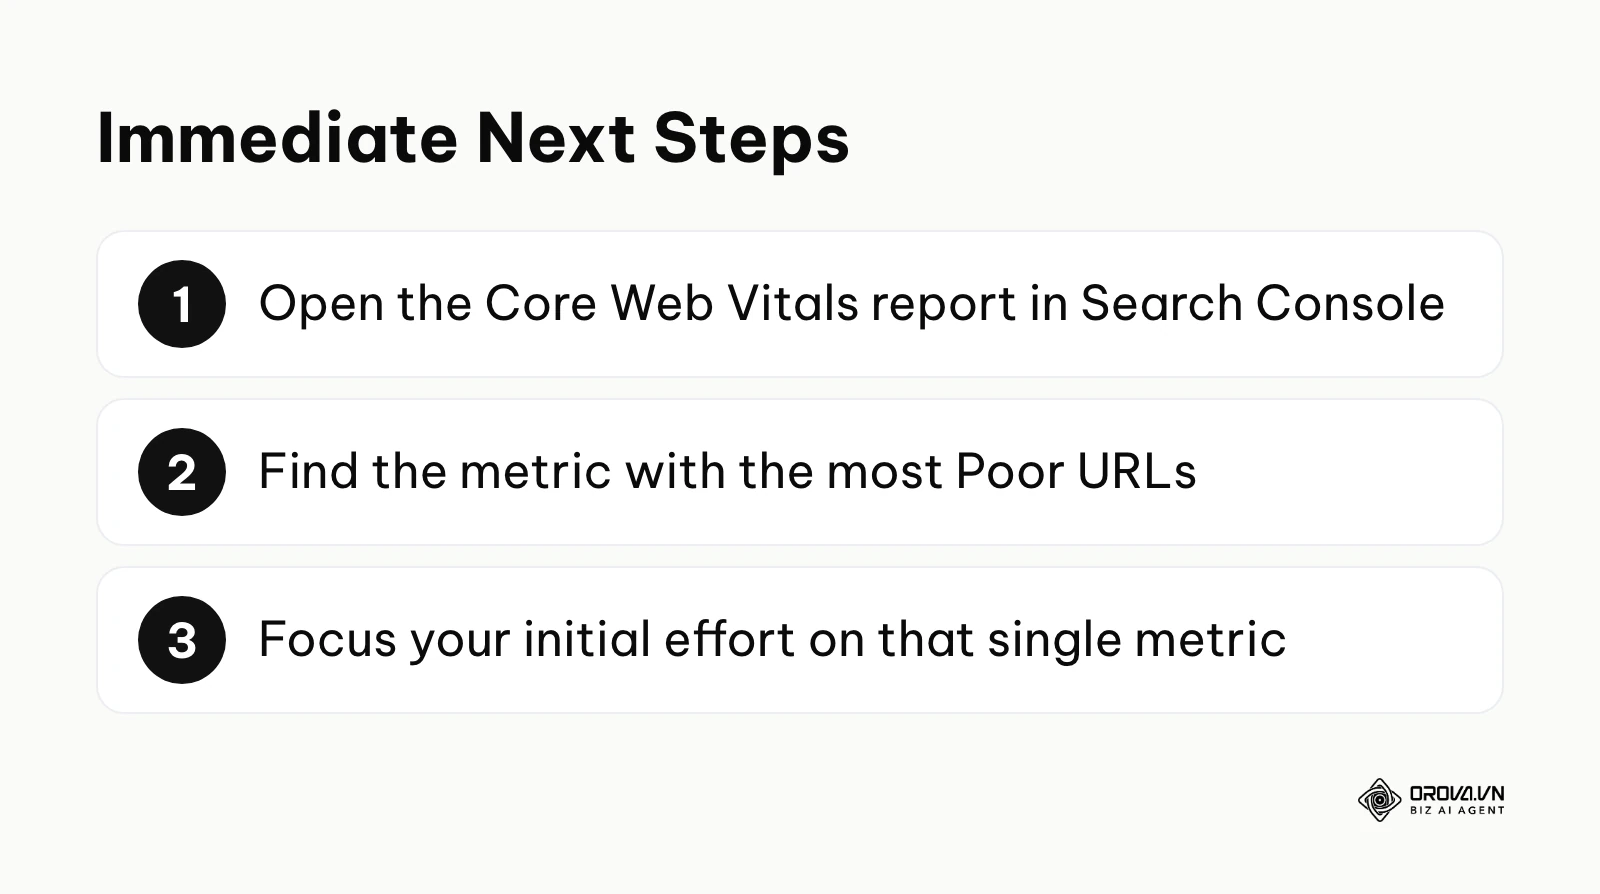
If you have done nothing yet: Your absolute first step is to establish a baseline using real user data. Do not start blindly installing plugins or deleting images. Log directly into your Google Search Console account and navigate to the Core Web Vitals report located in the left-hand sidebar. This dashboard aggregates the real experiences of your actual visitors over the last 28 days. Identify which specific metric (LCP, CLS, or INP) has the highest number of "Poor" URLs and focus your entire initial effort on understanding that single metric.
If you have disjointed, random efforts: If you previously installed three different caching plugins and compressed a few random images but never saw improvements, your first step is a massive cleanup. Having multiple optimization plugins running simultaneously often causes severe code conflicts, ironically slowing your site down further. Spend one afternoon deactivating and completely deleting all redundant optimization tools. Select one well-supported solution and configure it slowly, testing your scores after enabling each individual setting to isolate what helps and what hurts.
If you optimized but are not measuring results: If your development team recently deployed a major performance overhaul but you are unsure if it worked, your immediate task is to set up a continuous monitoring workflow. The 28-day window in Search Console makes it slow to reflect changes. Set up a Google Sheets template connected to the PageSpeed Insights API to automatically pull the lab data of your top five most important landing pages every Monday morning, or use one of the SEO tools that track site health on a schedule. This ensures that when a marketing manager accidentally uploads a massive uncompressed banner, you catch the performance regression within days, not months.
About the author

Builder of Orova
Nguyễn Đỗ Trọng Ân has 8 years of experience in marketing, including 6 years managing market development across Asia. He builds Orova, a Biz AI Agent that never sleeps: it plans, runs and optimizes work for businesses.
Run your business with AI Agents
Orova is the always-on Biz AI Agent — it plans, runs, and optimizes the work for you.
Save time, unlock productivity.