
Google Search Console for SEO: 8 Practical Workflows

Using google search console for seo means treating Google's free reporting tool as your diagnostic desk: it shows which queries bring impressions and clicks, which pages Google has indexed or skipped, and which technical problems block rankings. Many site owners stop at verifying a domain and glancing at the traffic line. That approach wastes the vast majority of the platform's potential. When you only look at basic vanity metrics, you miss the underlying technical barriers preventing your site from scaling, and you leave highly profitable long-tail keywords hidden in the raw data.
To truly master the organic search landscape, you need to move beyond staring at total clicks. This advanced playbook breaks down the exact technical workflows, custom filtering techniques, and automated reporting frameworks that senior professionals use. By shifting your approach from passive observation to proactive diagnosis, you will learn how to uncover hidden traffic opportunities, resolve complex indexation bottlenecks, and build a resilient search presence that survives algorithmic volatility.
What is Google Search Console for SEO?
Google Search Console is the definitive, free communication channel established between your website infrastructure and Google's crawling systems. It is engineered to help webmasters, digital marketers, and developers monitor precise indexation health, analyze organic search traffic patterns, and systematically resolve technical ranking barriers. You should view it as a diagnostic instrument rather than a web analytics platform: it reports what happened on Google Search, not what visitors did on your site.
Preparation: What You Need Before Diving In
Before executing advanced diagnostic workflows, you must establish a flawless foundational setup. Many data interpretation errors stem from incorrect property configurations or missing administrative permissions. If your data foundation is fractured, every subsequent analysis will lead you in the wrong direction.
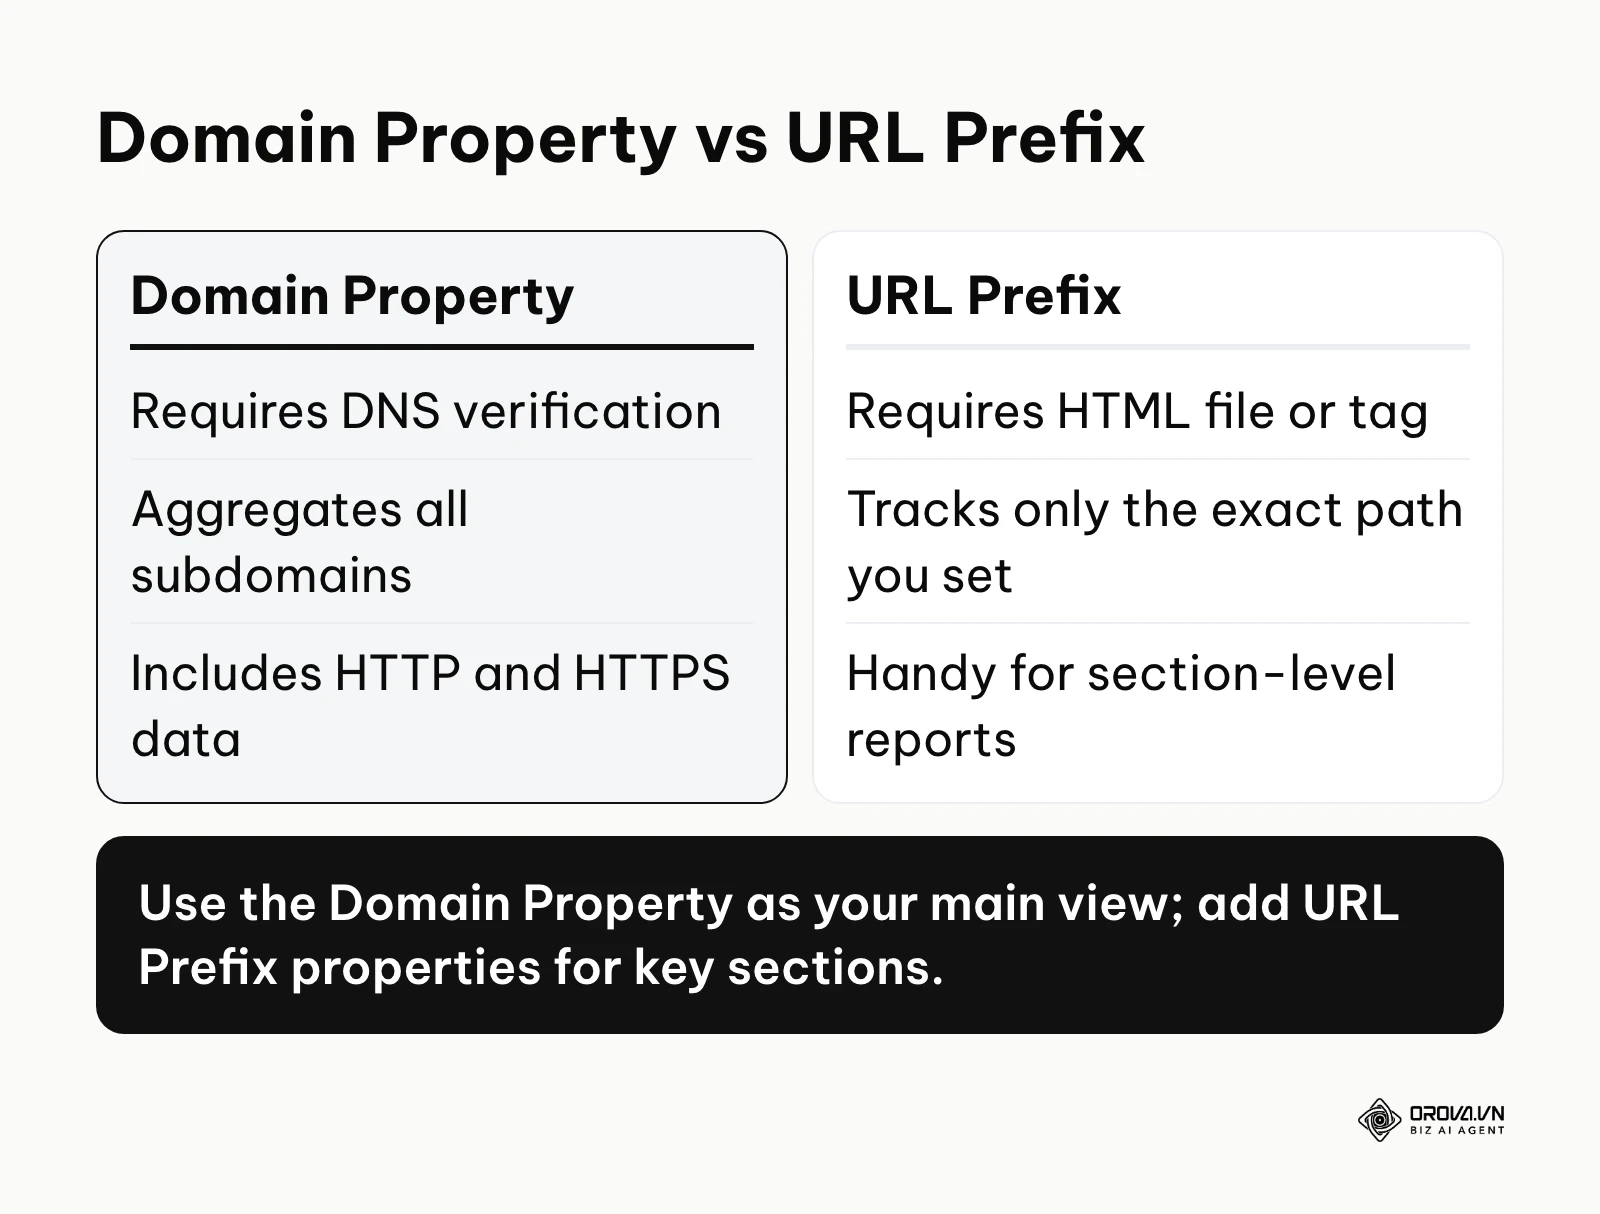
The most critical decision during setup is choosing between a Domain Property and a URL Prefix property. A Domain Property aggregates all data across your entire digital footprint, including HTTP, HTTPS, WWW, non-WWW variations, and all subdomains. This provides a holistic, untampered view of your overall search performance. Conversely, a URL Prefix property tracks only the exact match path you specify.
A clear, logical URL structure makes both property types easier to read. Many teams verify both: the Domain Property serves as the primary analysis view, while extra URL Prefix properties for key sections (such as /blog/ or a country folder) make section-level reporting and some older tools and integrations simpler. Also make sure you have Owner or Full user permission, because restricted users can view data but cannot take actions such as submitting sitemaps or requesting indexing.
Advanced Workflows: Mastering Google Search Console
Navigating the interface casually will not yield significant growth. The true power of this platform is unlocked when you apply rigorous, systematic workflows to specific technical and content challenges.
Step 1: Establishing a Daily, Weekly, and Monthly SEO Routine
Without a standardized operational routine, you will either miss critical technical errors until they destroy your traffic, or you will drown in irrelevant daily data fluctuations. Establishing a predictable rhythm is the hallmark of a professional search strategy.
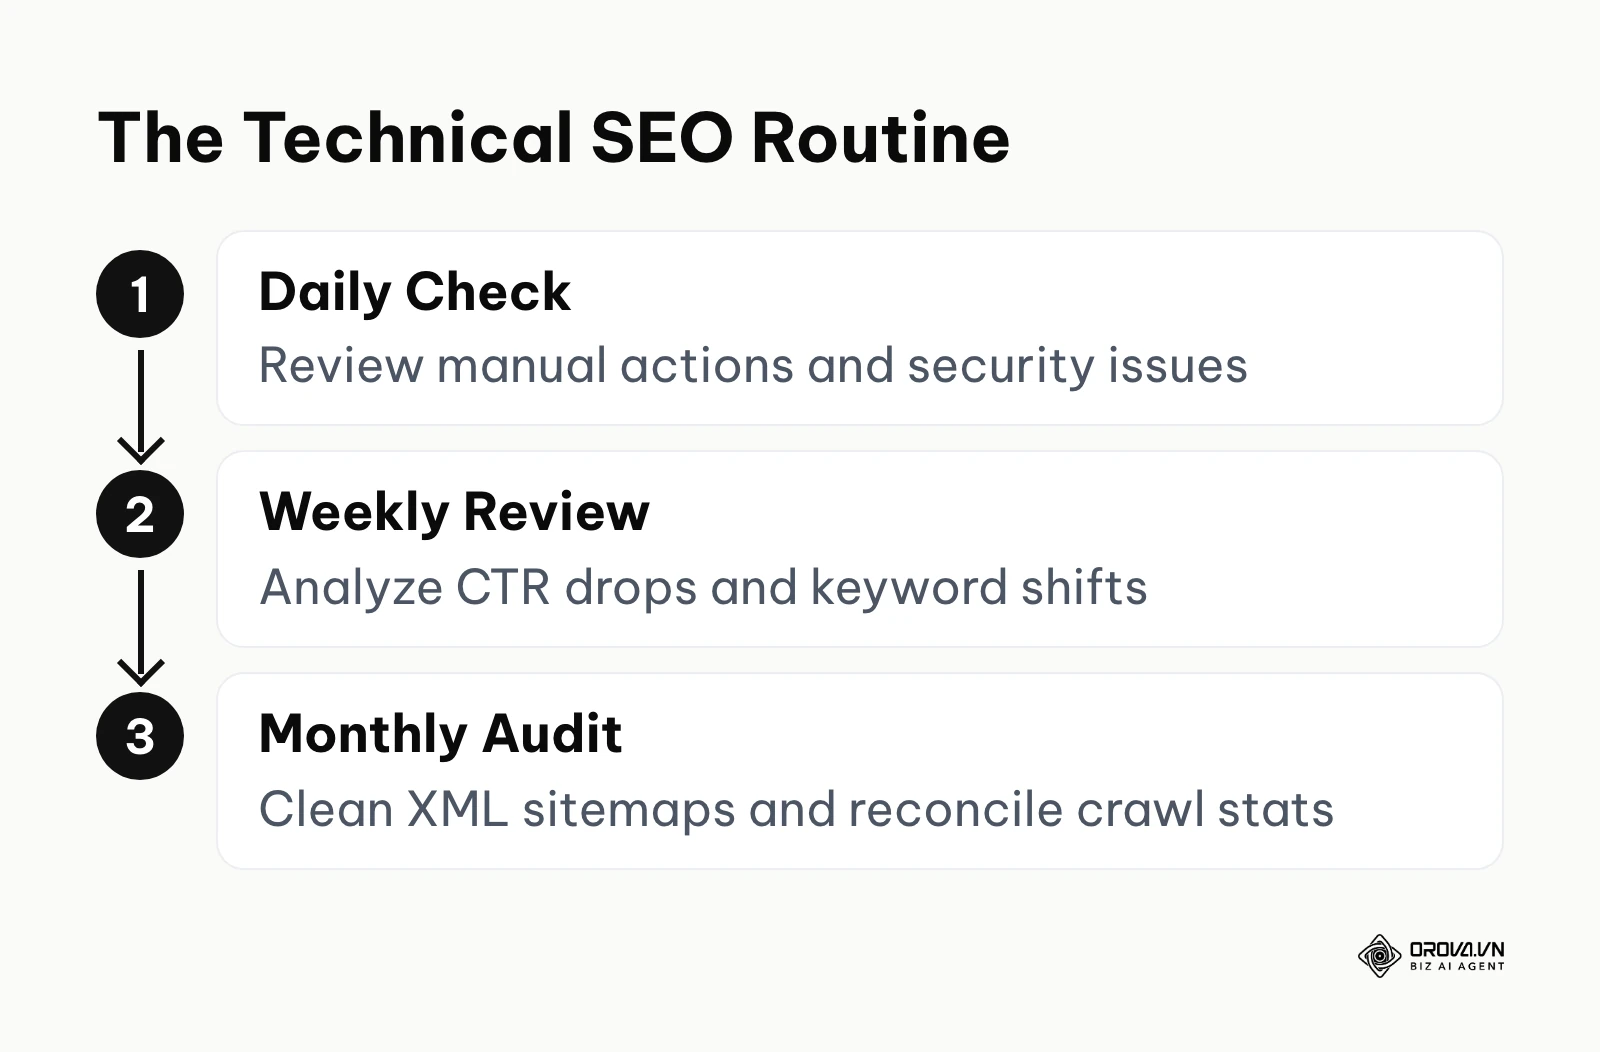
Your daily task requires less than five minutes but is absolutely critical: checking the "Security & Manual Actions" tab. A manual action implies a human reviewer at Google has penalized your site, requiring immediate, drop-everything attention to rectify. Next, quickly scan the "Page indexing" report for sudden, massive spikes in "Not found (404)" or "Server error (5xx)". A sharp vertical line here usually indicates a broken deployment or a server crash overnight.
Weekly tasks involve deeper performance analysis. Open the Performance report, apply a Date Compare filter for the last 7 days versus the previous period, and sort by Click-Through Rate (CTR) differences. You are looking for significant CTR drops on your top 10 highest-traffic pages. A sudden drop in CTR without a drop in average position often indicates that a competitor has written a better meta description, or the search engine has changed the visual layout of the results page by inserting an AI overview or video carousel. This insight is essential when you plan broader SEO adjustments.
Monthly tasks focus on deep architectural hygiene. Audit your submitted XML sitemaps to ensure that obsolete, redirected, or permanently deleted URLs have been fully purged from the file. Cross-reference the Page indexing report with a full SEO audit crawl to ensure your server's crawl budget is being allocated strictly to your most valuable pages, rather than being wasted on paginated archives or infinite filter combinations. The sign of a healthy routine is a predictable, steady indexation graph without unexplainable spikes in the excluded category. A common mistake at this stage is ignoring the email alerts Search Console sends about new issues, assuming they are promotional messages.
Step 2: Extracting Long-Tail Queries Using Regex
The default filtering capabilities in the native interface are highly restrictive, usually forcing you to search for exact strings or simple containing words. By utilizing Regular Expressions (Regex), you can unlock a goldmine of highly specific, long-tail search intents that complement what dedicated keyword research tools show you, because these are queries Google already associates with your site.
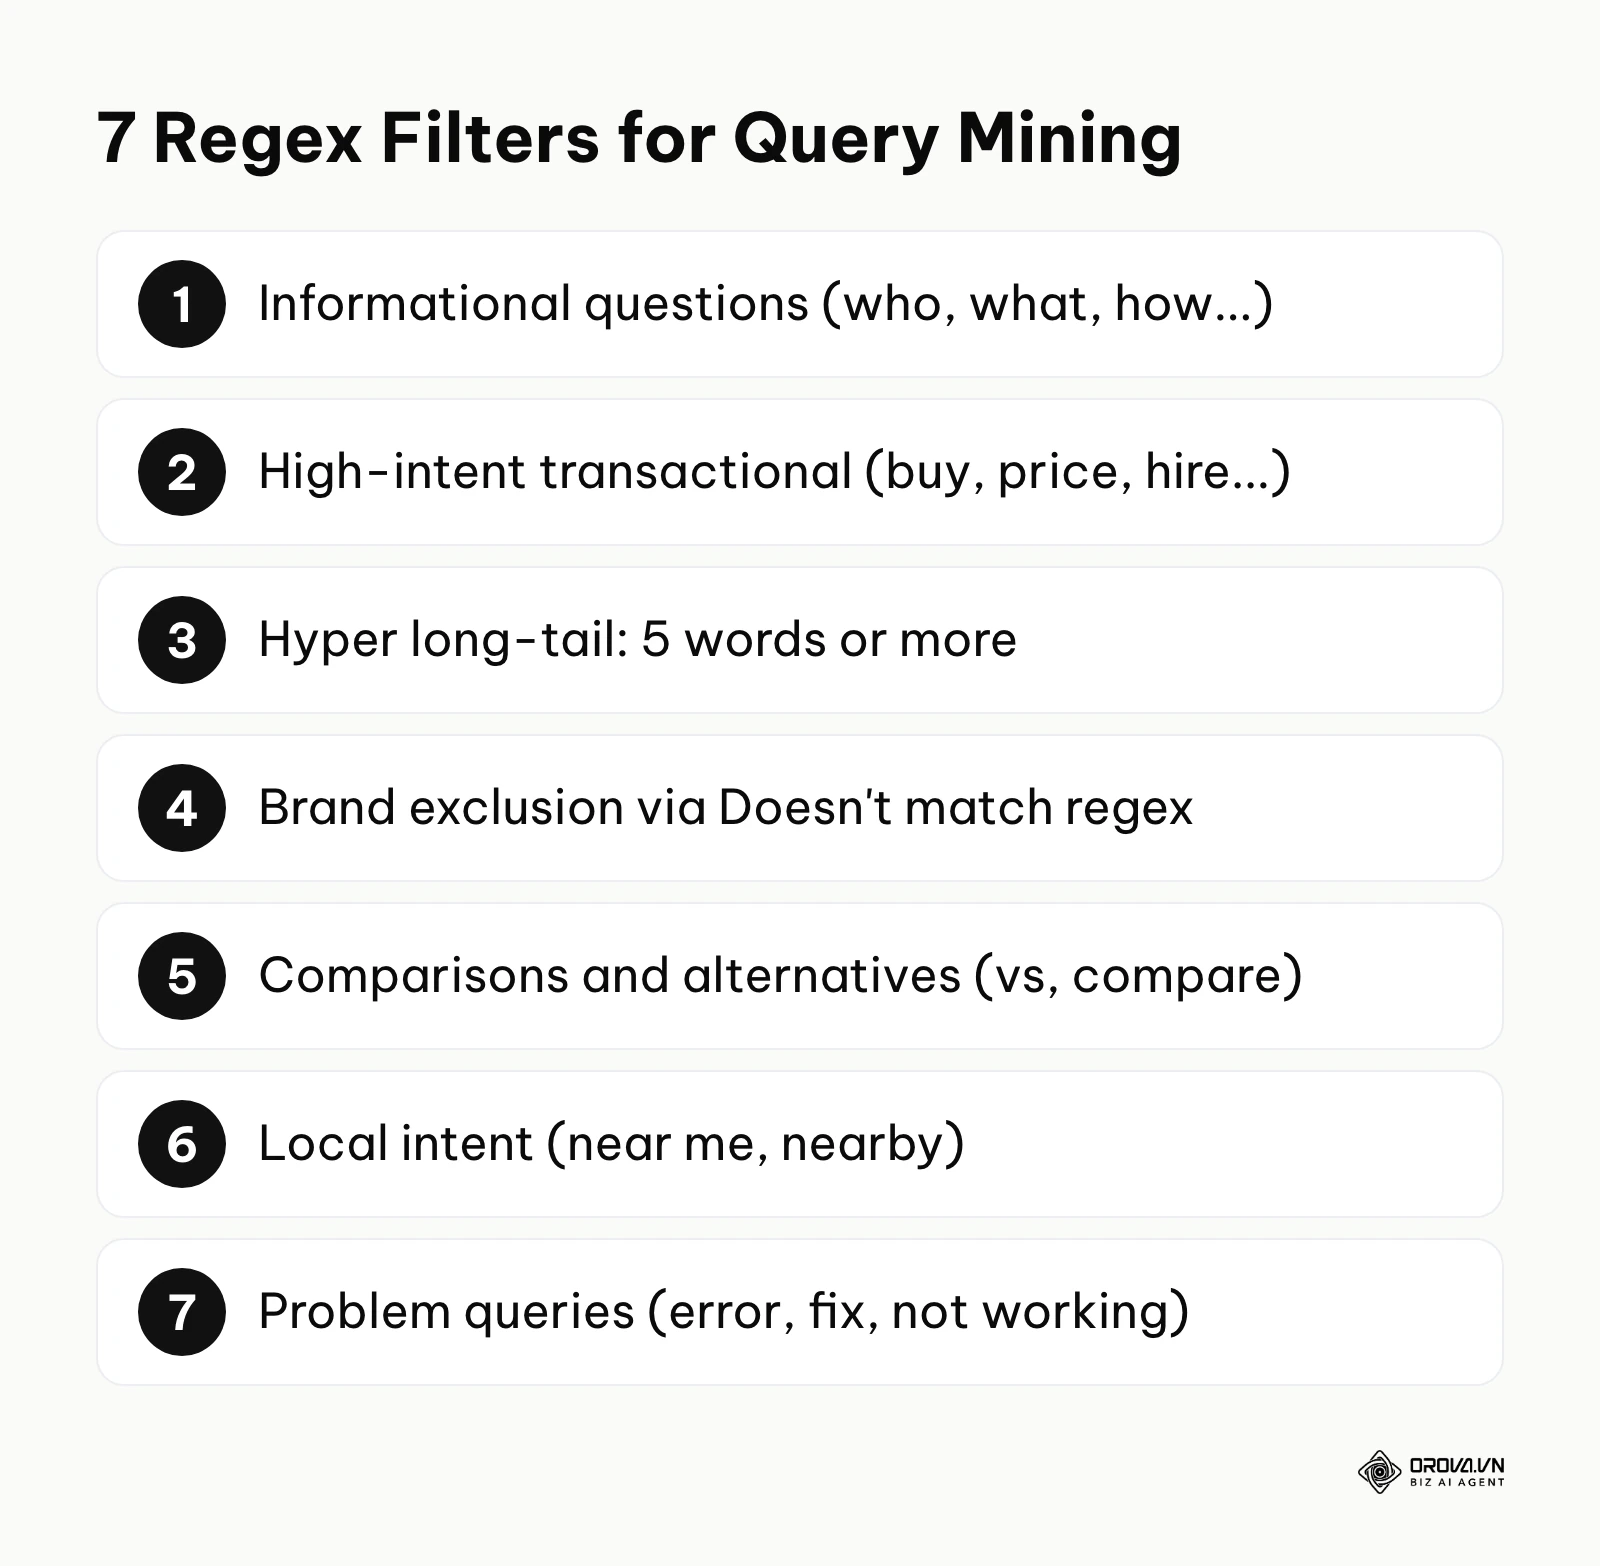
Regex allows you to create complex pattern-matching rules to filter thousands of queries instantly. To apply this, open the Performance report, add a Query filter, choose Custom (regex), then pick either Matches regex or Doesn't match regex. Search Console uses the RE2 regex syntax, which does not support lookaheads such as (?!...), so exclusions are done with the Doesn't match regex option. Here is a cheat sheet for extracting high-value query clusters:
- Informational Questions: ^(who|what|where|when|why|how|is|are|can)[\s] This pattern forces the query to begin exactly with a question word followed by a space, filtering out noise and isolating users seeking educational content.
- High-Intent Transactional: .(buy|price|cost|discount|hire|agency|services). This pattern captures users at the very bottom of the funnel who are actively looking to spend money or hire a service.
- Hyper Long-Tail (5 words or more): ([^ ]+ ){4,} This brilliant string counts the spaces between words. Queries with five or more words often have incredibly low competition and highly specific conversion intent.
- Brand Exclusion (use Doesn't match regex): yourbrand|your brand|yourbrnd Replace these with your company name and its common misspellings. This isolates non-branded organic growth, so you can see whether you are capturing new demand rather than relying on brand awareness.
- Comparisons and Alternatives: \b(vs|versus|alternative|alternatives|compare|comparison)\b These queries show buyers weighing options, which is a strong signal for comparison pages.
- Local Intent: near me|nearby|\b(in|around) [a-z]+$ Useful for businesses with physical locations to see which areas people search from.
- Problem Queries: \b(error|not working|fix|problem|issue)\b These reveal troubleshooting intent that support articles and FAQ pages can answer.
Illustrative example:
- Context: An in-house content manager for a mid-sized financial software company was tasked with identifying new topic clusters for the upcoming quarter to capture top-of-funnel traffic.
- Steps taken: They opened the Performance report, set the date range to the last six months, and applied the informational question Regex filter ^(who|what|where|when|why|how)[\s]. They then exported the list and sorted it by high impressions but low clicks to find topics where the site was visible but not compelling enough to earn the visit.
- Hiccups and solutions: The initial export was heavily skewed because many question queries included the company's brand name, which did not represent new market capture. Because Search Console's regex does not support lookaheads, they kept the question filter, exported the rows, and removed every query containing the brand name with a second pass in their spreadsheet.
- Results: They successfully extracted a perfectly clean list of 140 informational, non-branded questions. These queries were mapped into a new FAQ hub, which generated a steady stream of net-new organic sessions within three months.
Step 3: Troubleshooting "Discovered: Currently Not Indexed"
Of all the statuses in the Page indexing report, "Discovered - currently not indexed" is arguably the most frustrating for webmasters. It explicitly means that the automated crawler found the URL, knew it existed, but actively decided not to crawl and index it at that specific moment. This is rarely a bug; it is a symptom of underlying architectural or quality issues.
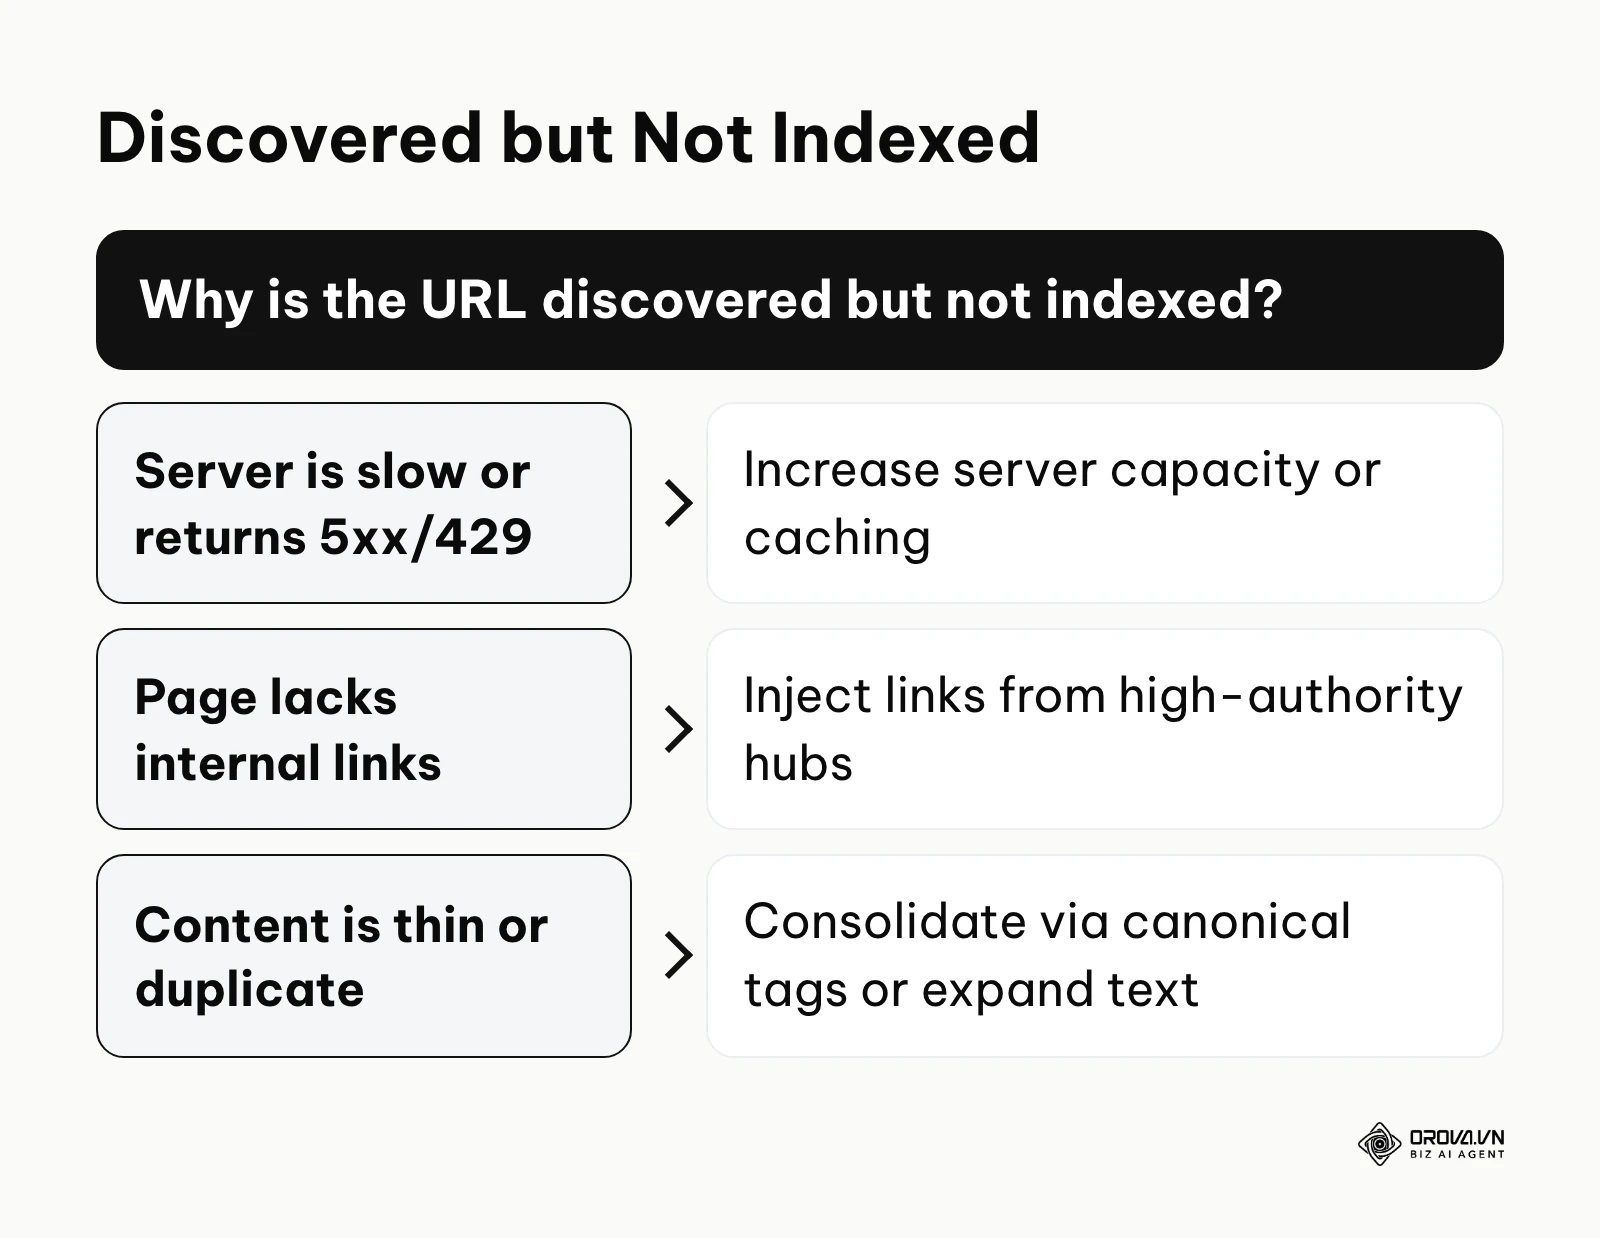
Google's crawl budget documentation explains that how much Google crawls depends on how much your server can handle and how much demand there is for your URLs. When a URL is discovered but ignored, it generally means the server was responding too slowly, or the crawler determined the content was not important enough to prioritize over billions of other pages on the web.
To resolve this, you must attack the problem from three angles. First, improve the internal linking architecture. URLs that are buried five clicks deep from the homepage or exist as orphan pages without any inbound internal links are naturally deprioritized. Injecting contextual links from high-authority hub pages passes essential signals to the crawler. Second, dramatically upgrade the content quality. Thin, templated pages with overlapping content are frequently skipped to save computational resources. Third, verify your server's log files to ensure the server is not inadvertently returning a "429 Too Many Requests" status code when the bot attempts a heavy crawl. A major error here is clicking "Validate fix" without actually changing the internal linking or content depth; validation is then likely to fail. Requesting indexing URL by URL does not solve this either: the URL Inspection tool has a daily limit on indexing requests, and a request does not guarantee indexing.
Illustrative example:
- Context: A technical SEO lead for a massive e-commerce marketplace was dealing with an inventory system that generated thousands of new product SKUs daily, but noticed a massive backlog in the indexing report.
- Steps taken: They analyzed the "Discovered - currently not indexed" bucket and noticed a pattern: all unindexed URLs were deep-level product variants. They addressed this by adding dynamic "Related Products" recommendation blocks to highly crawled category pages, ensuring new SKUs received immediate internal links. They also submitted a dedicated, temporary XML sitemap containing exclusively the unindexed URLs.
- Hiccups and solutions: The initial internal linking fix failed to yield results because the recommendation blocks relied heavily on client-side JavaScript that the crawler was not rendering efficiently. They resolved this bottleneck by transitioning the recommendation module to Server-Side Rendering (SSR).
- Results: Following the SSR deployment, the backlog of unindexed URLs plummeted by 65% within two weeks, and the new inventory began actively appearing in search results and driving sales.
Step 4: Optimizing for E-commerce and Merchant Listings
For businesses operating online stores, relying solely on standard blue-link organic traffic is a severe disadvantage. The visual nature of modern search results means that optimizing the "Shopping" section within your dashboard is paramount for revenue generation. E-commerce sites must feed precise, structured data directly into the search engine's product graph.
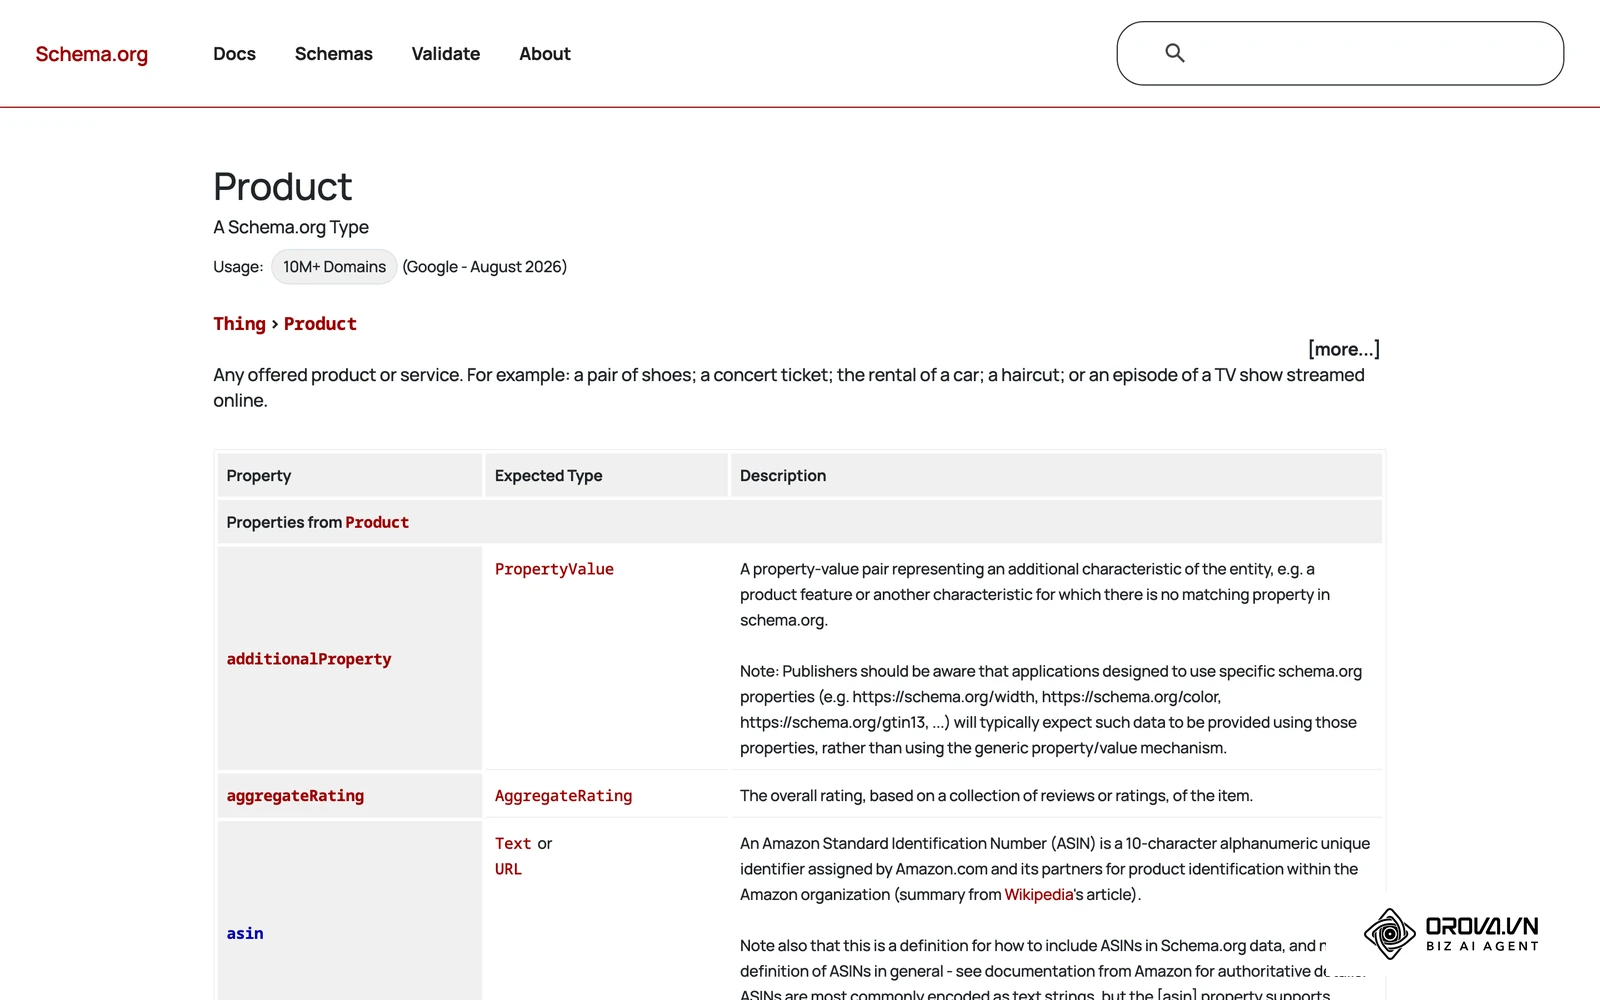
Start with the "Product snippets" and "Merchant listings" reports in the Shopping section of the Search Console menu. They show whether Google can read your product structured data, which affects eligibility for richer product results with price, review stars and availability. If you also use Google Merchant Center, keep the product data there consistent with what your pages show.
You must look for and instantly resolve critical warnings regarding missing price, missing availability, or incomplete review schema markup. Fixing these structured data errors affects whether your products can show as rich results, which tend to stand out more than plain text listings. A good sign is when the "Valid" items count in your Product snippets report is close to your number of live product pages. A serious error in this workflow is hardcoding structured data into the HTML so that it drifts out of sync with your real prices and stock, which can cause mismatches and cost you rich result eligibility.
Step 5: Bypassing the 1,000-Row Limit with Data Studio
The Search Console web interface shows and exports at most 1,000 rows per table. While this is sufficient for a local bakery, it is entirely inadequate for an enterprise publication or a large e-commerce site dealing with hundreds of thousands of unique queries every month. To perform deep data analysis, you must bypass this frontend limitation.
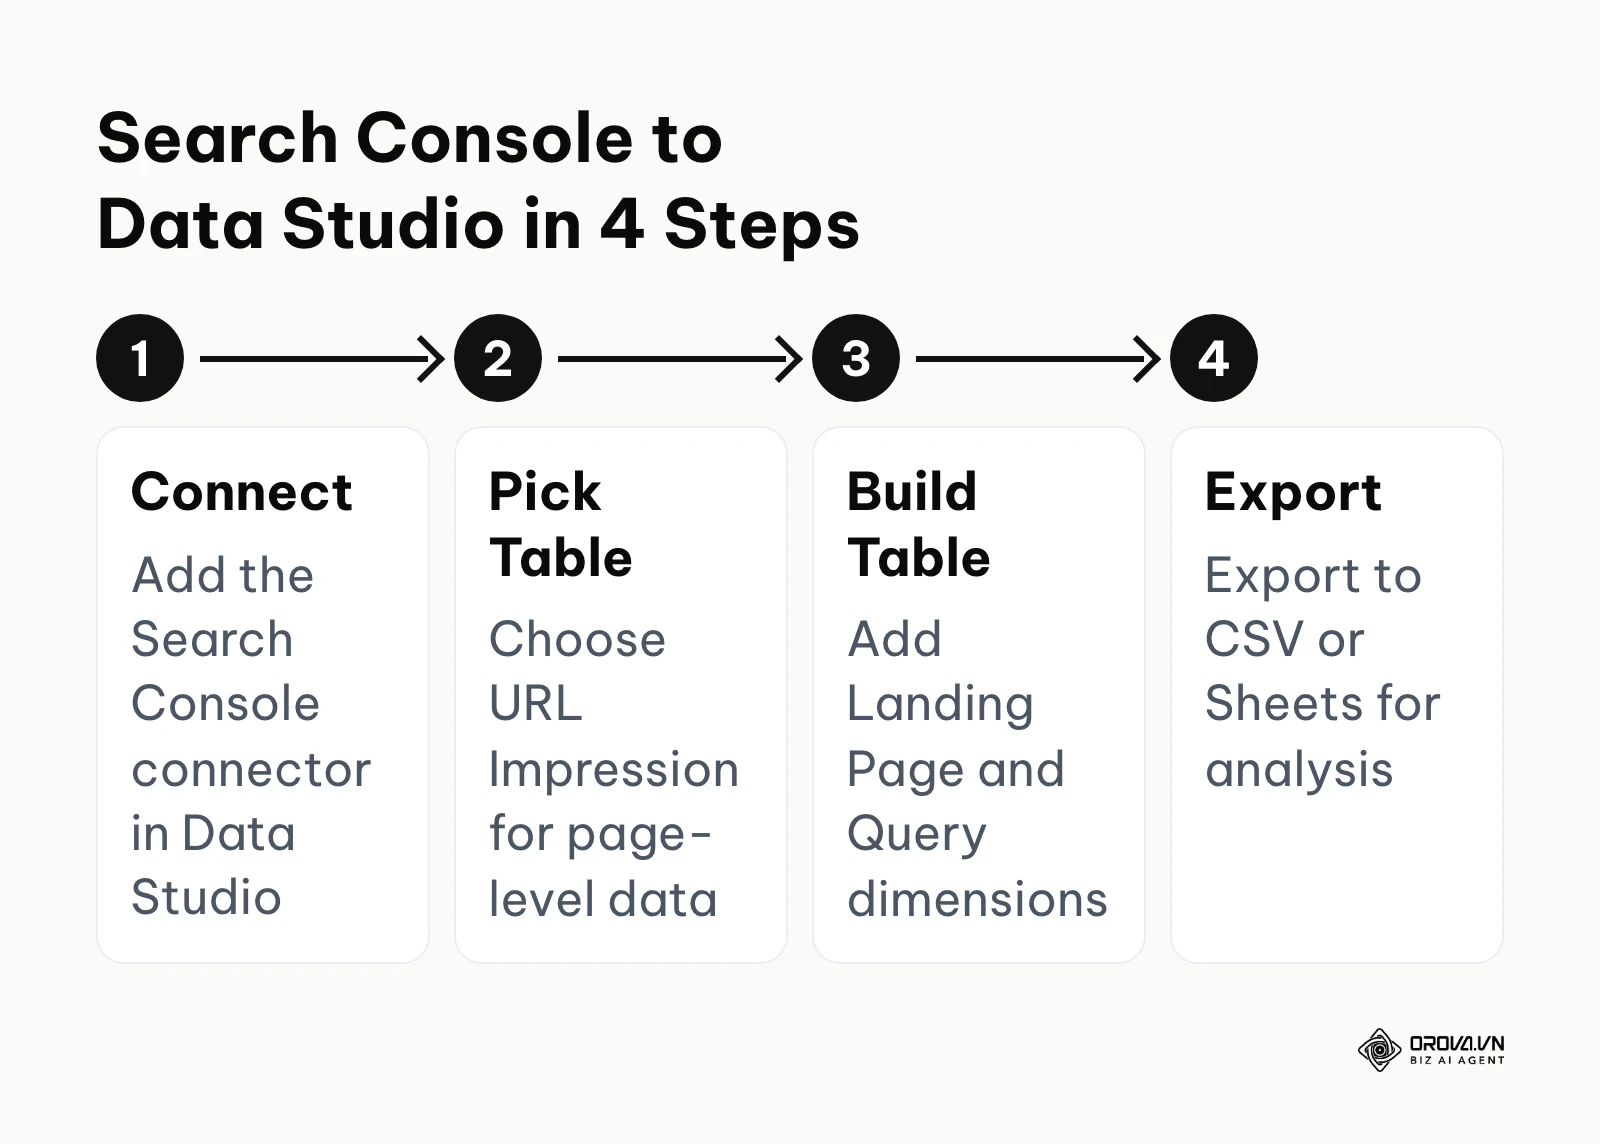
The most accessible method to break this barrier without writing scripts is Google's free reporting tool Data Studio (called Looker Studio until Google renamed it back), which reads Search Console through an official connector. Larger sites can also use Search Console's bulk data export to BigQuery. To use the connector, open Data Studio and create a new blank report. Add a new data source and select the native Search Console connector. You will be prompted to choose a table type: you must select "URL Impression" rather than "Site Impression". This distinction is critical. Site impression aggregates data at the domain level, which prevents you from mapping specific search queries to specific landing pages. URL impression forces the API to return page-level data.
Once connected, build a simple table chart. Add "Landing Page" and "Query" as your dimensions, and set "Impressions" and "Clicks" as your metrics. Increase the rows per page, then export the table to CSV or Google Sheets for pivot table analysis. You will get far more than 1,000 rows, although the Search Console API still has its own daily row limits, so very large sites may not get every long-tail query. The sign of success is a fully automated dashboard that updates daily without manual intervention, providing granular query-to-page mapping. A frequent mistake is comparing Site Impression totals with URL Impression totals and expecting them to match. Google counts them differently (by property versus by page), so page-level totals are usually higher, and mixing the two in one report produces misleading numbers.
Step 6: Diagnosing Traffic Drops: Core Update vs. Technical Fault
When the organic traffic graph plummets unexpectedly, widespread panic usually ensues. The immediate reaction for many teams is to start drastically rewriting content or changing the site architecture. However, you must systematically isolate the root cause before taking any corrective action, as the remedy for an algorithmic devaluation is completely different from the fix for a technical outage.
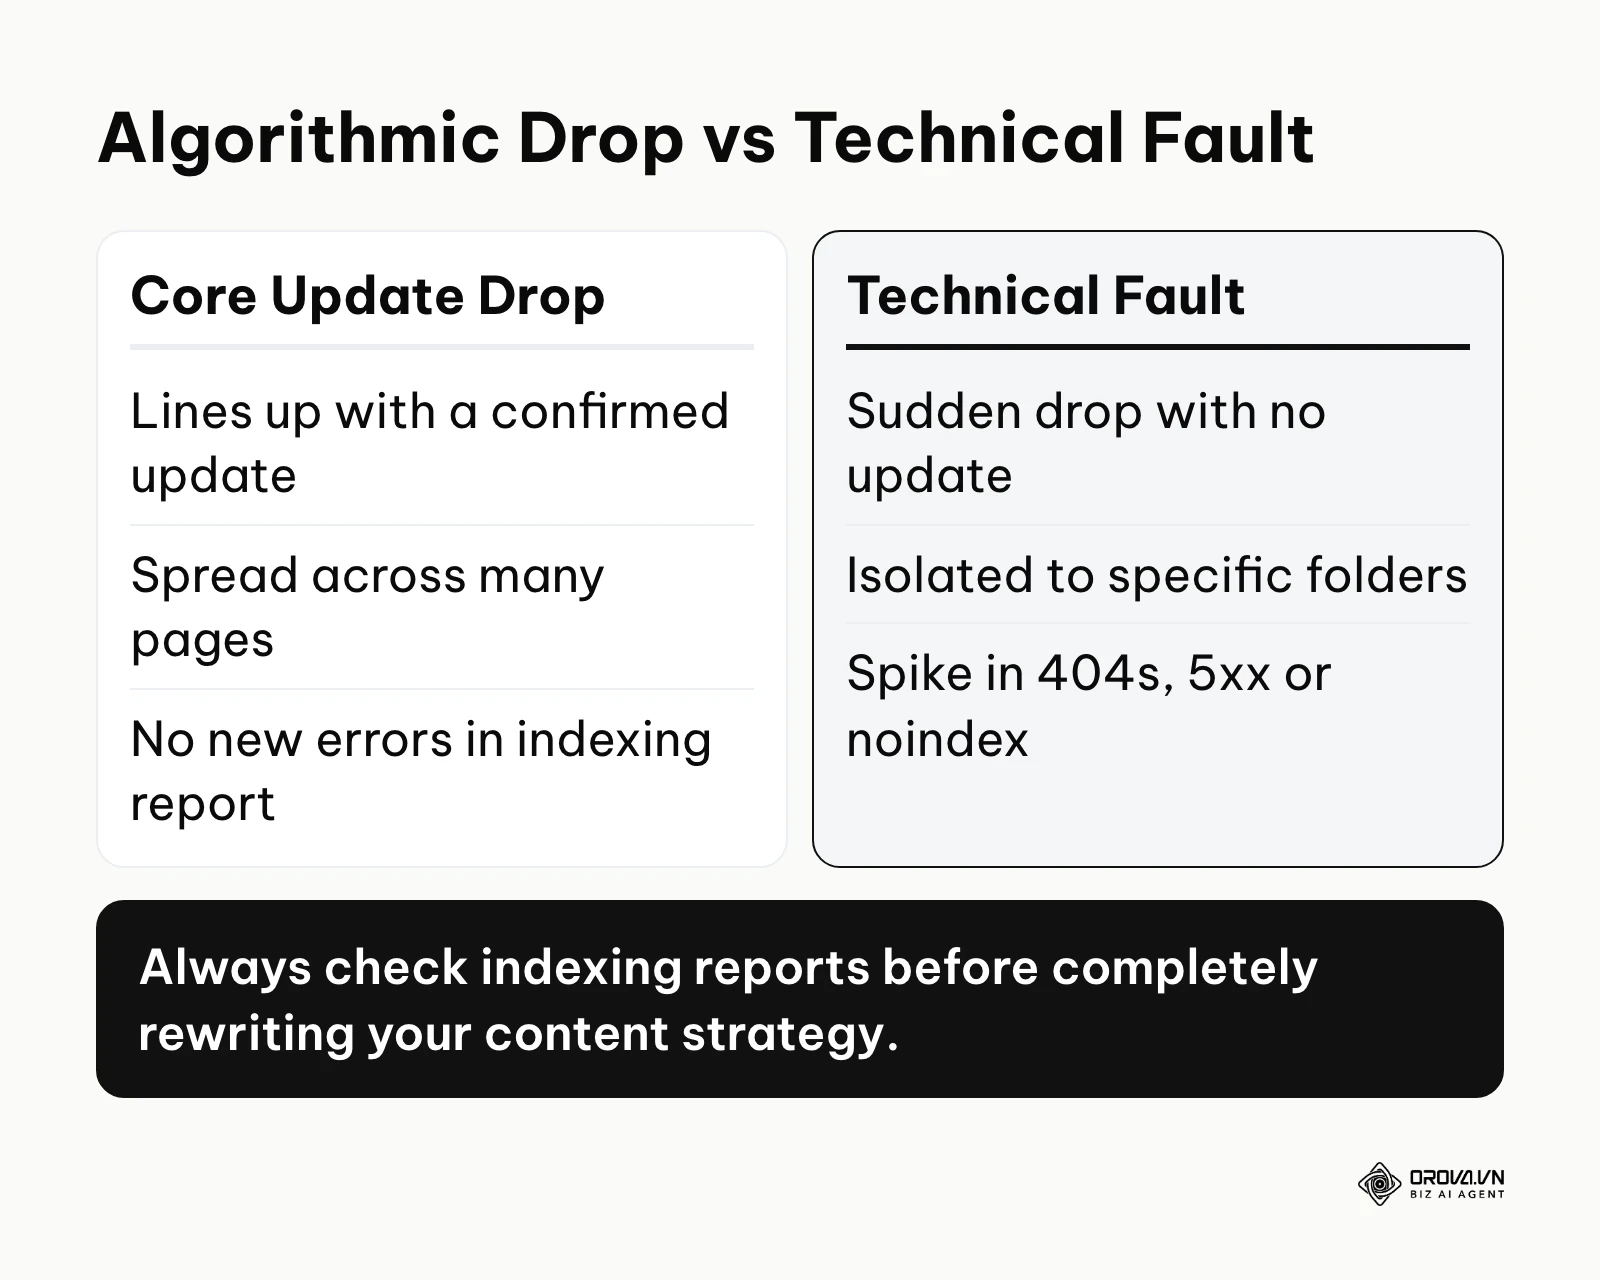
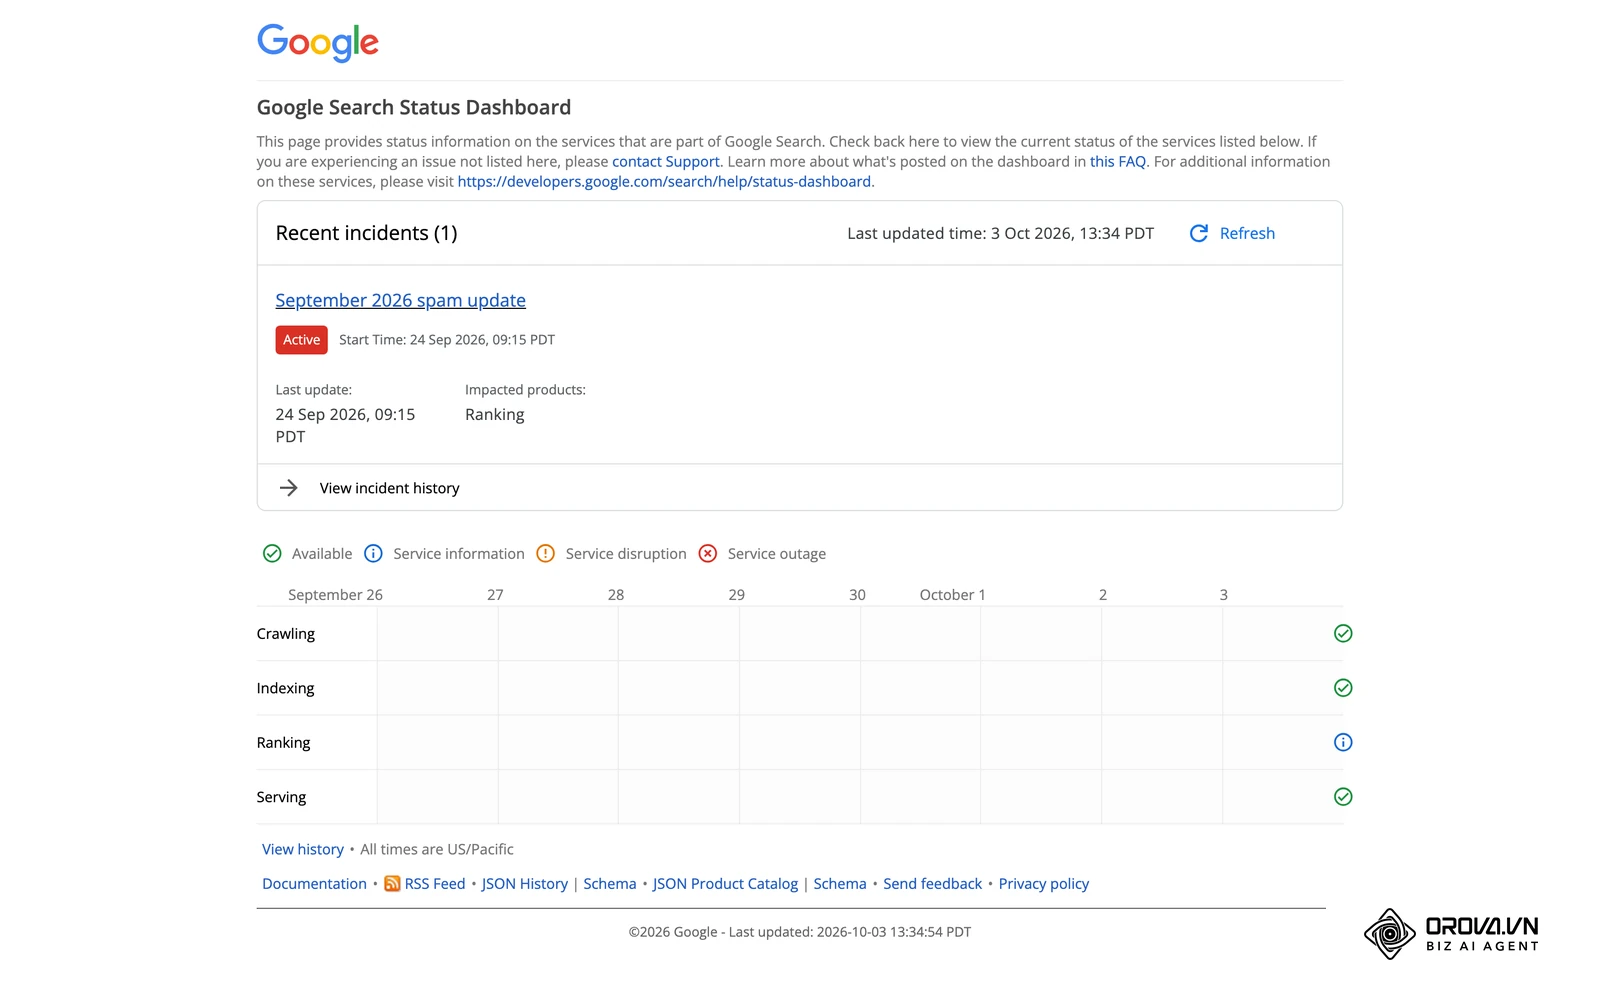
First, pinpoint the exact date the traffic drop began. Cross-reference this specific date with the official Google Search Status Dashboard to see if a confirmed core update or spam update was rolling out at that time. Google's own guidance on core updates describes them as broad changes in how content is assessed, so drops during an update usually spread across many pages rather than one folder.
If no official update was occurring, utilize the Date Compare filter in your performance report. You need to determine if the drop is Sitewide or Isolated. A sitewide drop that does not correlate with an algorithmic update often points to a broken template change, a server outage, or a manual action. An isolated drop, where traffic only plummets in one specific subdirectory (like /blog/), almost always points to a technical fault, such as an accidental noindex tag deployed during a recent code push.
Illustrative example:
- Context: A digital marketing manager for a global travel booking platform arrived at work to find that organic traffic had plummeted by nearly 40% overnight.
- Steps taken: They immediately opened the performance report and used the Date Compare feature to analyze the last 3 days against the previous period. Filtering the data by the "Page" dimension, they cross-referenced the timeline with industry forums and official status dashboards to rule out a broad algorithmic update.
- Hiccups and solutions: Initially, the sheer scale of the drop looked exactly like a Core Update penalty. However, by drilling deeply into the exact URL paths, they realized the drop was entirely isolated to the /destinations/ subdirectory. A review of the recent frontend migration revealed that a developer had accidentally left a <meta name="robots" content="noindex"> tag in the header template for those specific pages. They immediately removed the tag and requested indexing for the main hub pages in the URL Inspection tool to prompt a recrawl.
- Results: Google recrawled the hub pages within a few days and the noindex directives disappeared from the inspection results. Organic traffic returned to its normal baseline over the following weeks.
Step 7: Auditing Core Web Vitals and Page Experience
Speed and user experience are part of how Google assesses page experience, and they matter directly to visitors. The Core Web Vitals report provides field data showing how real users experience your website's loading performance, responsiveness and visual stability.
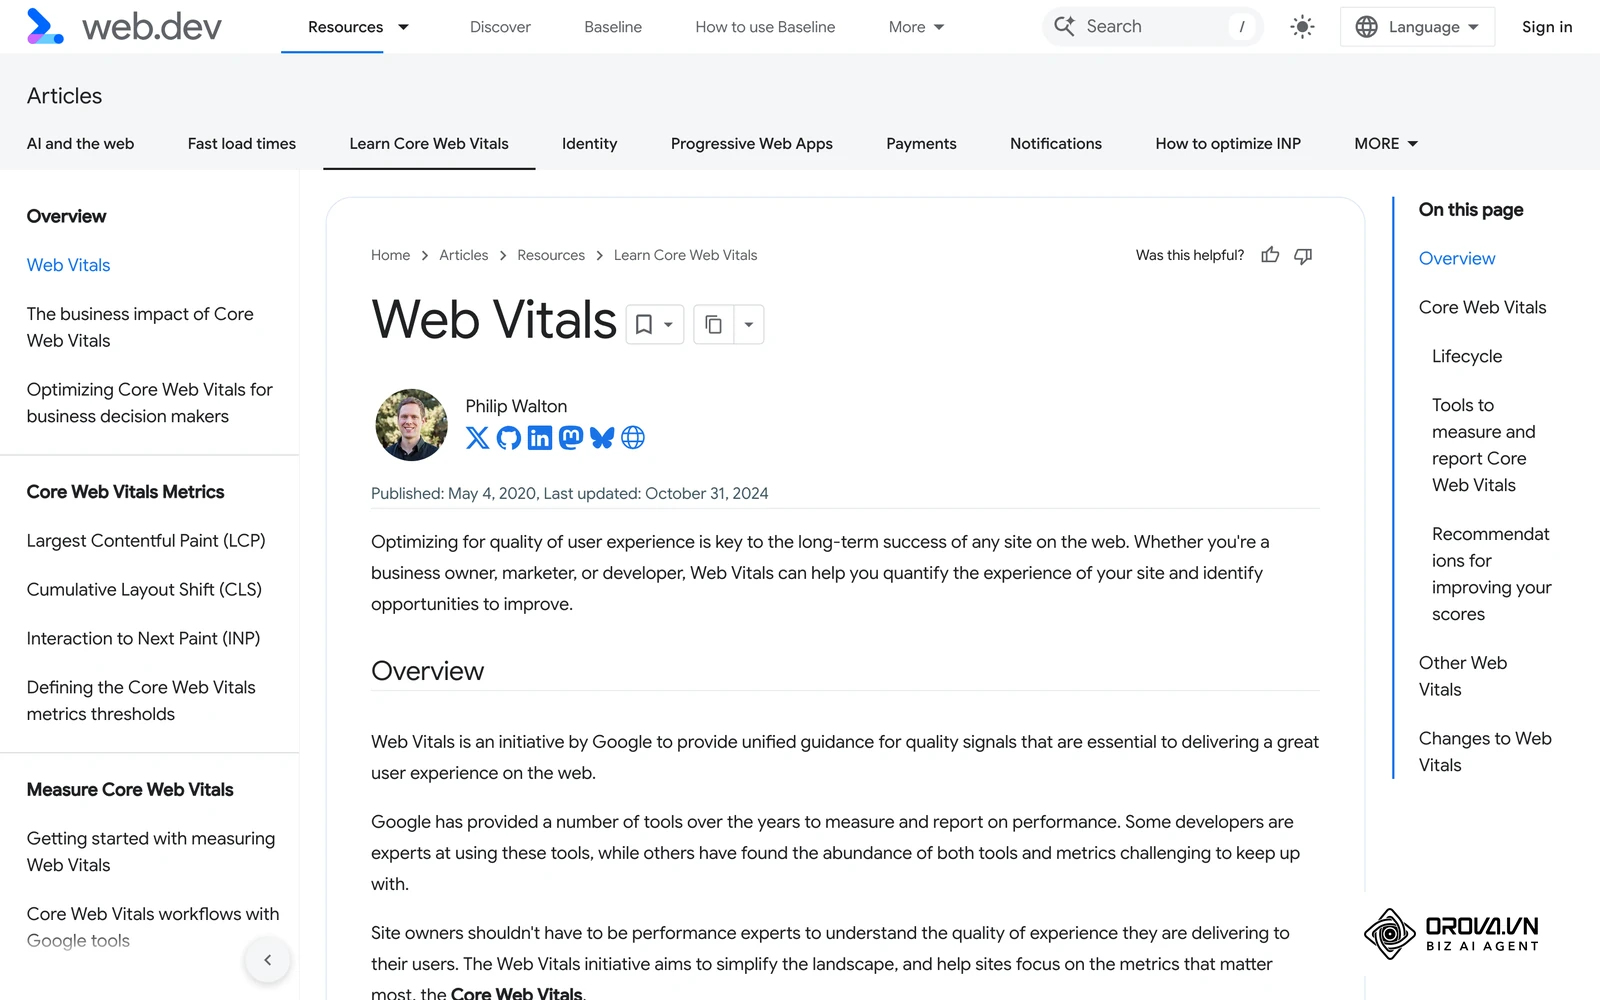
You must specifically analyze the metrics for Interaction to Next Paint (INP), Largest Contentful Paint (LCP), and Cumulative Layout Shift (CLS). It is crucial to understand the difference between the Chrome User Experience Report (CrUX) field data shown in this report and the lab data you see when running a standalone Lighthouse test. Lab data is simulated on a fixed device and connection, whereas field data aggregates real Chrome users on their own devices and networks over a rolling 28-day window, reported separately for mobile and desktop. If your dashboard shows "Poor" URLs for INP, it means real users are experiencing severe lag when tapping buttons or opening menus, usually caused by heavy, render-blocking JavaScript executing on the main thread.
Step 8: Leveraging the Links Report for Architecture Optimization
The Links report is often overlooked because it does not provide the massive third-party data scale of paid backlink checkers. However, it is Google's own view of the internal and external links it has found pointing to your pages.
For advanced architecture optimization, export the "Top linked pages" under the Internal links column. Compare this raw export against a crawl generated by your own third-party software. If you have critical conversion pages that show zero or very few internal links in this dashboard, it suggests that your site architecture is not distributing link signals effectively. Fixing this with a clear internal linking strategy, contextual links and better navigation menus is one of the most powerful levers you can pull to lift the baseline ranking of deep-level content.
Discover Orova.vn – a Biz AI Agent platform with OROVA SEO, a complete solution for every website. The system supports search engine optimization from A to Z with features including keyword research, writing new SEO-ready articles, optimizing existing content, rank tracking, plus competitor analysis and in-depth technical analysis. Sign up today to experience OROVA SEO completely free (offer valid through July 7, 2027).
Deep Analysis: Evaluating GSC Data Interpretation Approaches
Not all data interpretation methods are created equal. Relying exclusively on the native web interface has significant trade-offs compared to building custom API pipelines or employing specialized third-party SEO tools. Understanding these limitations is critical for setting accurate expectations with stakeholders.
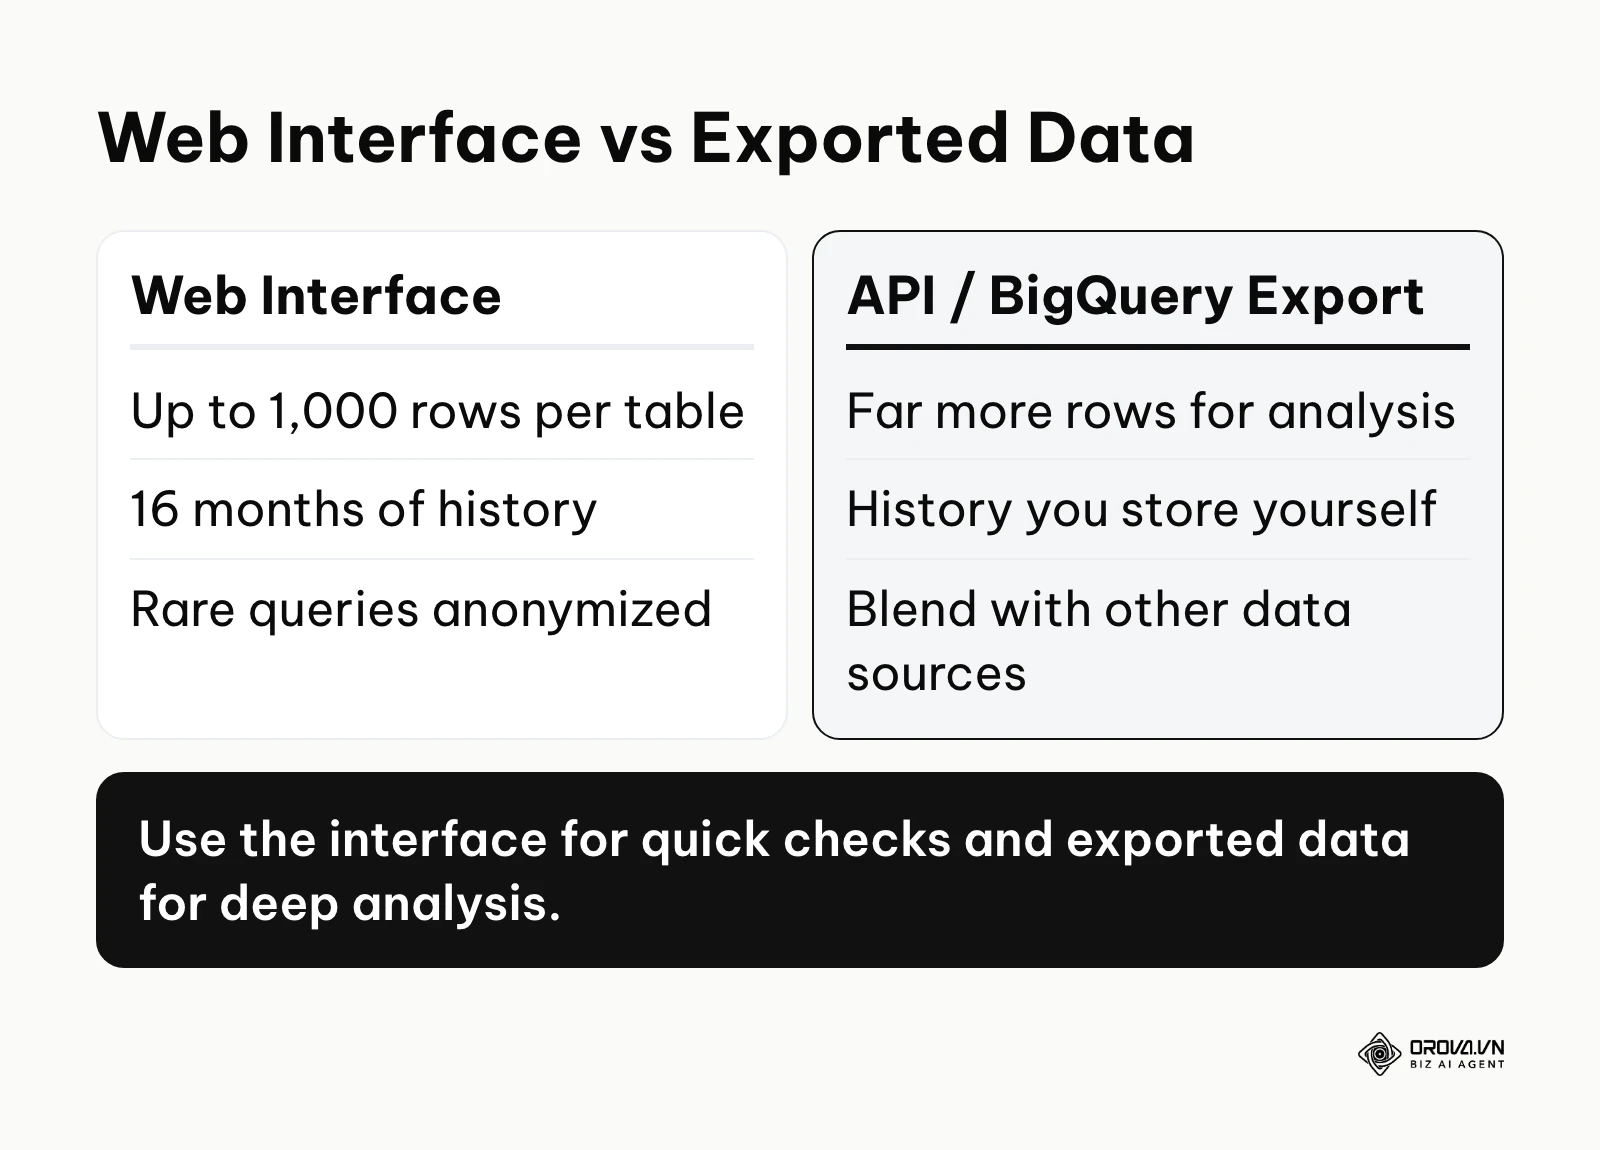
The native interface is incredibly user-friendly but anonymizes rare queries to protect user privacy, meaning many very low-volume queries never appear in the query table. This creates a discrepancy where the sum of your individual query clicks will almost never equal the total clicks reported for the page. Furthermore, the Performance report only keeps 16 months of data. If you need year-over-year analysis spanning multiple seasons, you must store this data yourself, for example with the bulk data export to BigQuery.
Third-party crawlers provide deep, simulated insights into your technical architecture, such as exact word counts, missing H1 tags, and broken internal links. However, they only represent a theoretical view of your site. They do not know what the search engine actually chose to index or how users interacted with the results. Building a Data Studio dashboard that blends Search Console data with other analytics sources bridges this gap, giving you a strong base for data-driven decisions, although it takes real setup time.
Measuring Results: Key Metrics and What They Really Mean
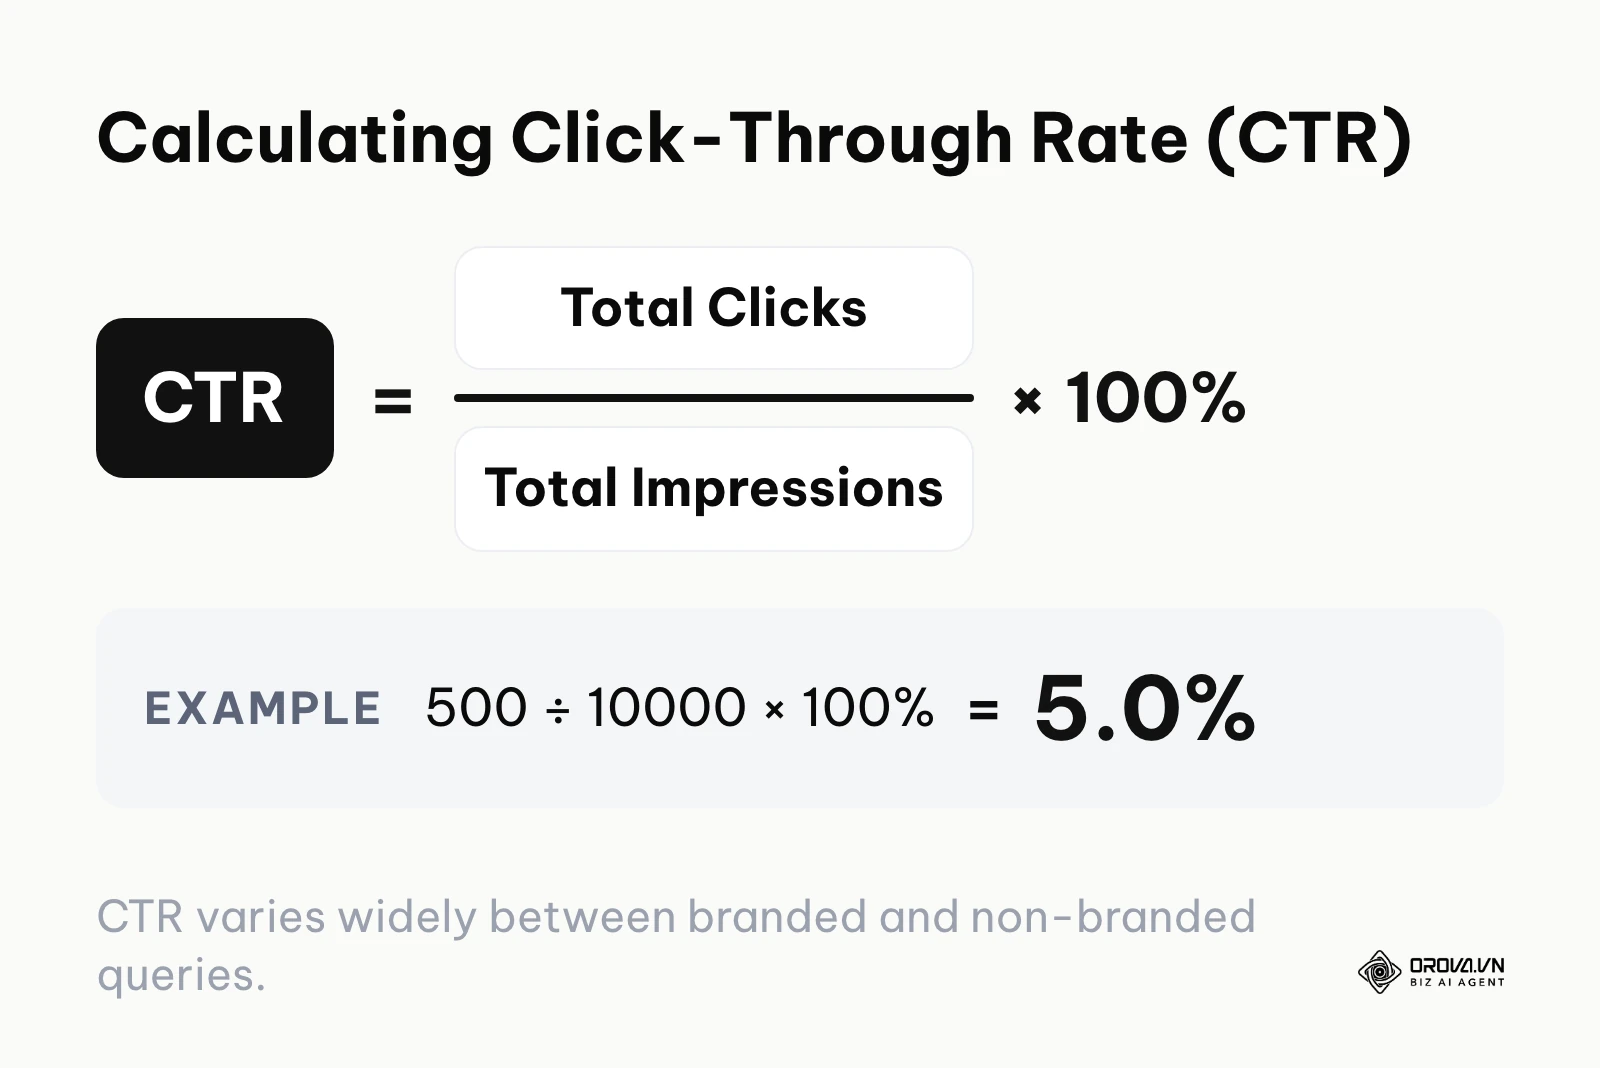
Understanding the four primary metrics in the performance report—Clicks, Impressions, CTR, and Average Position—requires nuance. These numbers are often misinterpreted, leading to flawed strategic decisions. CTR is simply clicks divided by impressions: 500 clicks from 10,000 impressions is a 5% CTR.
You must deeply understand the difference between a Click in this dashboard and a Session in Google Analytics 4. A Click represents a user interacting with the link on the search engine results page. A Session is only recorded if the user's browser successfully loads the page and executes the tracking script. Discrepancies between these two numbers are inevitable and are usually caused by users clicking and immediately closing the tab, ad blockers preventing script execution, or timezone differences (Search Console reports in Pacific Time).
Impressions indicate that your link was loaded on a search result page, even if it was at the very bottom and the user never scrolled down to see it. Average Position is purely mathematical; a reported position of "3.5" does not mean you are statically hovering between third and fourth place. It is an average of your topmost position across impressions, so because of location, personalization and device type you may have ranked first for some users and much lower for others.
With OROVA.VN and the OROVA SEO module, you put an end to the exhausting days of manual work for good. Instead of struggling for hours to write articles and compile reports, the entire process is now optimized and completed in just 5 minutes.
Common Mistakes When Using Google Search Console
Navigating technical diagnostics is fraught with potential pitfalls. Even experienced professionals occasionally fall into these traps, which can obscure critical data or lead to wasted engineering hours.
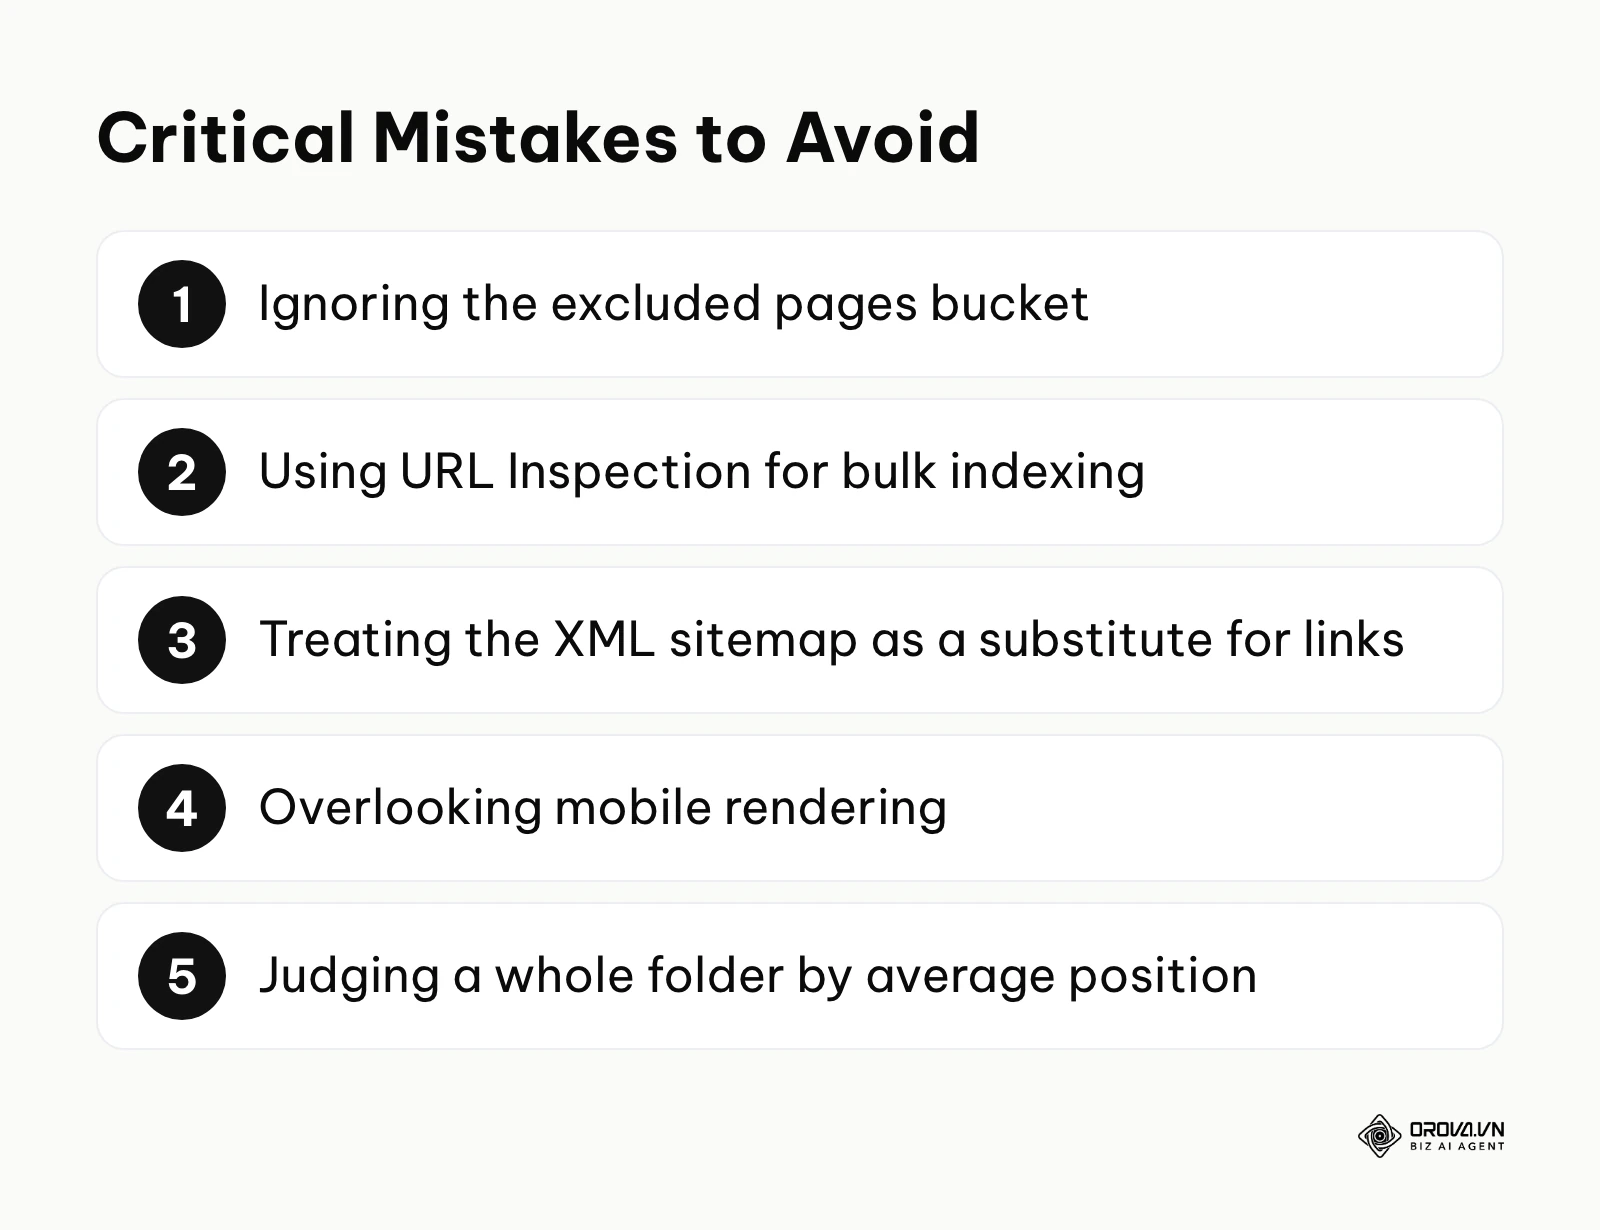
- Ignoring the Excluded Bucket: Many webmasters assume that as long as the "Valid" bucket is growing, the site is healthy. The excluded bucket contains vital clues about crawl bloat, infinite redirect loops, and canonicalization failures. Ignoring it means you are likely wasting massive amounts of your crawl budget on garbage URLs.
- Misusing the URL Inspection Tool: Treating the inspection tool as a bulk indexing mechanism is a fundamental error. Indexing requests are capped per day for each property, and requesting indexing for low-quality, programmatic pages will not make Google value them. It is a diagnostic tool meant for investigating specific rendering issues or pushing critical updates, not a substitute for a logical site architecture.
- Treating the XML Sitemap as a Substitute for Links: Submitting an XML sitemap helps Google discover URLs, but it does not replace internal links. Pages that appear only in the sitemap, with no links from the rest of the site, often stay in "Discovered - currently not indexed".
- Overlooking Mobile Rendering: Google uses mobile-first indexing, and the old Mobile Usability report has been retired. Use URL Inspection to see how Googlebot renders key pages and check mobile layouts with Lighthouse, so tiny text or crowded buttons do not slip through.
- Fixating on Broad Average Position: Looking at the average position metric for an entire subdirectory (e.g., your entire blog) is mathematically useless due to the extreme variance in keyword difficulty. You must filter down to a specific query or an exact URL to glean any actionable insight regarding ranking velocity.
Where Google Search Console is heading in the next few years: the author's take
The Shift Toward API-First Indexing
As of 2026, I believe we are rapidly moving away from the traditional model of passive crawling. The search engine cannot afford the computational expense of constantly polling billions of pages to check for minor text updates. Today the Indexing API is officially limited to job postings and livestream pages, and sitemaps remain the main way to signal changes. My read is that push-style signals will gradually matter more for more site types. I would advise development teams to keep sitemaps accurate, with honest last-modified dates, and to build their CMS so it can notify search engines of changes if broader options appear, rather than waiting for a bot to stumble on updates.
AI Overviews and Impression Dilution
With generative AI answers now part of the results page, I suspect a single "Impressions" number will become harder to interpret. An impression from a link shown inside or below an AI answer is not the same as a classic blue-link impression. I think site owners will keep asking Google for more separation of these numbers in reports. To prepare, I would track question-based queries separately with the regex filters above and write pages that answer those questions clearly and concisely.
Predictive Analytics Replacing Retroactive Reporting
Currently, the dashboard functions primarily as a retroactive ledger; it tells you exactly what went wrong yesterday. Over the next few years, I think more of the interpretation work will happen inside the tool itself, with smarter alerts and summaries of unusual changes. Until then, the practical preparation is the routine in Step 1: catch small anomalies in indexing and crawling early, before they turn into traffic drops.
Frequently Asked Questions About Google Search Console for SEO
How long does it take for data to appear in the reports?
Performance data usually appears with a delay of about two days. A live test in the URL Inspection tool shows the current state of a page immediately, but the Page indexing report and other reports update more slowly.
Can merely verifying the property improve my rankings?
No. The platform is strictly a reporting and diagnostic instrument. Simply verifying your domain does not grant you any algorithmic advantage or ranking boost. You must actively implement the insights you discover—such as fixing indexing errors or rewriting titles for low-CTR pages—to see actual ranking improvements.
Why do the click metrics not match my web analytics sessions?
They measure fundamentally different technical events. A click is recorded the millisecond a user interacts with the search result link. A session is only recorded if the user's browser fully connects to your server and successfully executes the analytics JavaScript. Ad blockers, fast bounces, and timezone differences guarantee these numbers will never align perfectly.
Will artificial intelligence replace the need for manual technical audits?
While AI diagnostic tools are becoming incredibly efficient at instantly flagging data anomalies and generating automated compliance reports, strategic decision-making remains highly nuanced. Deciding whether a sudden traffic drop requires a complete architectural overhaul or is simply an acceptable seasonal fluctuation still demands deep human business context and historical expertise.
What is the maximum data retention period for performance metrics?
The Performance report keeps 16 months of data on a rolling basis. If you need history spanning multiple years for long-term trend analysis, set up the bulk data export to BigQuery or export regularly via the API to your own spreadsheets or database.
Where Should You Start?
If you have just launched a brand new website or migrated domains, your immediate first step is to establish fundamental communication. Verify your Domain property via DNS records to ensure you capture all variations, and immediately submit a clean, dynamic XML sitemap. Do not waste time analyzing the Performance report yet; focus entirely on monitoring the "Page indexing" tab over the first two weeks to ensure the crawler can actually access and render your architecture without encountering server blocks.
If your site possesses steady, established traffic but you are hitting a frustrating growth plateau, dedicate one afternoon to building the Data Studio connection. Exporting your data without the restrictive 1000-row limit will instantly reveal hundreds of high-impression, low-CTR long-tail queries currently languishing on page two. These queries are the lowest hanging fruit on your website, ripe for a rapid content refresh and targeted internal linking to push them onto the first page.
If you recently suffered a massive, unexplained traffic drop, immediately stop publishing new content and halt any planned redesigns. Open the "Security & Manual Actions" tab first to rule out a catastrophic human penalty. If that is clear, meticulously use the Date Compare feature in the Performance report to pinpoint exactly which specific subdirectory lost the traffic. Cross-reference those exact dates against the Google Search Status Dashboard to determine if you are fighting a broad algorithmic update or if you simply deployed broken code that requires an immediate rollback. By implementing these advanced workflows, you transform google search console for seo from a passive reporting dashboard into a proactive growth engine.
About the author

Builder of Orova
Nguyễn Đỗ Trọng Ân has 8 years of experience in marketing, including 6 years managing market development across Asia. He builds Orova, a Biz AI Agent that never sleeps: it plans, runs and optimizes work for businesses.
Run your business with AI Agents
Orova is the always-on Biz AI Agent — it plans, runs, and optimizes the work for you.
Save time, unlock productivity.