
What Is a Good ROAS for Ecommerce: Amazon, Etsy and Shopify Compared
Your Amazon campaign report says 4.2x. You had read somewhere that a good ROAS sits around that mark, so you raised the daily budget and waited for the profit to show up. Months later the ratio still says 4.2x, orders are up, and your bank balance is lower than when you started. Nothing broke and nobody lied to you — you just asked what is a good ROAS without asking what your channel actually charges you on every single order.
The old habit is to chase one universal target number, as if 4x or 5x means the same thing everywhere you sell. It doesn't, because Amazon, Etsy, and your own Shopify store each take a different bite out of every sale before you see a cent of profit. A ratio that looks identical on paper can be a loss on one channel and a comfortable profit on another, and no dashboard will warn you about that difference.
This piece walks you through building your own break-even number — the point where a sale stops costing you money — for each place you sell, so you stop copying someone else's benchmark and start working from your own numbers. By the end you will know what counts as a good ROAS for you specifically on Amazon, Etsy, and Shopify, and how to read a blended number when you sell in all three at once.
What Is a Good ROAS for Ecommerce?
A good ROAS for ecommerce is any figure above your break-even ROAS, which is one divided by your contribution margin after that channel's fees. Because Amazon, Etsy and Shopify each take a different cut of the same order, one product at one price can need over 4x on a marketplace and under 2.5x on your own store.
That definition does the same job on every channel, which is why it is worth learning once. Break-even ROAS is the ratio at which the gross profit your ads produce exactly equals what you paid for the ads. Below it you are buying revenue at a loss. Above it you are contributing something toward rent, salaries and yourself. The arithmetic is simply break-even ROAS = 1 ÷ contribution margin, and the entire difficulty is in the margin, not the division. If you want the general version of that calculation without the marketplace layer on top, we walk through it step by step in how to calculate ROAS.
Contribution margin is not gross margin. Gross margin usually subtracts only what the goods cost you. Contribution margin subtracts every cost that grows with each additional order: goods, inbound freight spread per unit, outbound shipping you do not fully recover, packaging, payment processing, the marketplace's commission, storage, and the money you lose on returns. On a marketplace, the difference between those two numbers is enormous, because the marketplace's cut lands entirely in the gap between them. Sellers who compute break-even from gross margin invariably set a target that is far too low, hit it happily for two quarters, and cannot work out where the cash went.
Why the Same ROAS Means Three Different Things
The ratio in your ad platform is attributed revenue divided by ad spend. Both halves of that fraction behave differently on each channel, and so does everything the fraction leaves out.
On Amazon, the marketplace supplies the demand. Shoppers arrive already intending to buy something in your category, and your ad is competing for placement in a queue they were going to walk through anyway. In exchange, Amazon charges a referral fee on the sale, and if you use FBA it charges again for picking, packing, shipping and storing. Your advertising is buying position inside a shop you do not own, and the shop takes its cut of every sale regardless of whether the ad caused it.
On Etsy, the marketplace also supplies demand, but the fee structure is shaped differently. There are charges tied to listings, charges tied to transactions, charges tied to processing payments, and — this is the part that catches people — a separate fee applied to orders that Etsy's Offsite Ads programme claims credit for. That last one behaves like a variable acquisition cost you did not choose and cannot switch off above a certain revenue level. It means two identical orders in the same shop on the same day can have materially different contribution, depending on how the buyer arrived.
On Shopify, nobody takes a commission on the sale. You pay a subscription, payment processing, and whatever your apps cost, and that is roughly the extent of the platform's claim. In return you supply one hundred percent of the demand yourself. There is no baseline of marketplace traffic underneath you. Turn the ads off on Amazon and orders keep trickling in from organic placement; turn the ads off on a young Shopify store and the graph can go close to flat. So Shopify usually has the lowest break-even ROAS of the three and the highest dependence on advertising to produce any volume at all.
Three different economics, three different targets, one metric name. That is the whole reason a shared benchmark cannot work.
Build the Fee Stack Before You Pick a Number
Before any target makes sense you need a per-order fee stack for each channel, taken from the current published rates rather than from memory. Fee schedules change. Categories get reclassified. Fulfilment surcharges appear for peak season and disappear again. A target computed from last year's rates is a target that quietly stopped corresponding to profit.
I am deliberately not printing percentages here. Rates vary by category, by country, by size tier, by plan and by month, and any figure written into a blog post is wrong for most readers on the day they read it. Look them up, write them into your own sheet, and date the sheet.
Amazon: the categories to look up
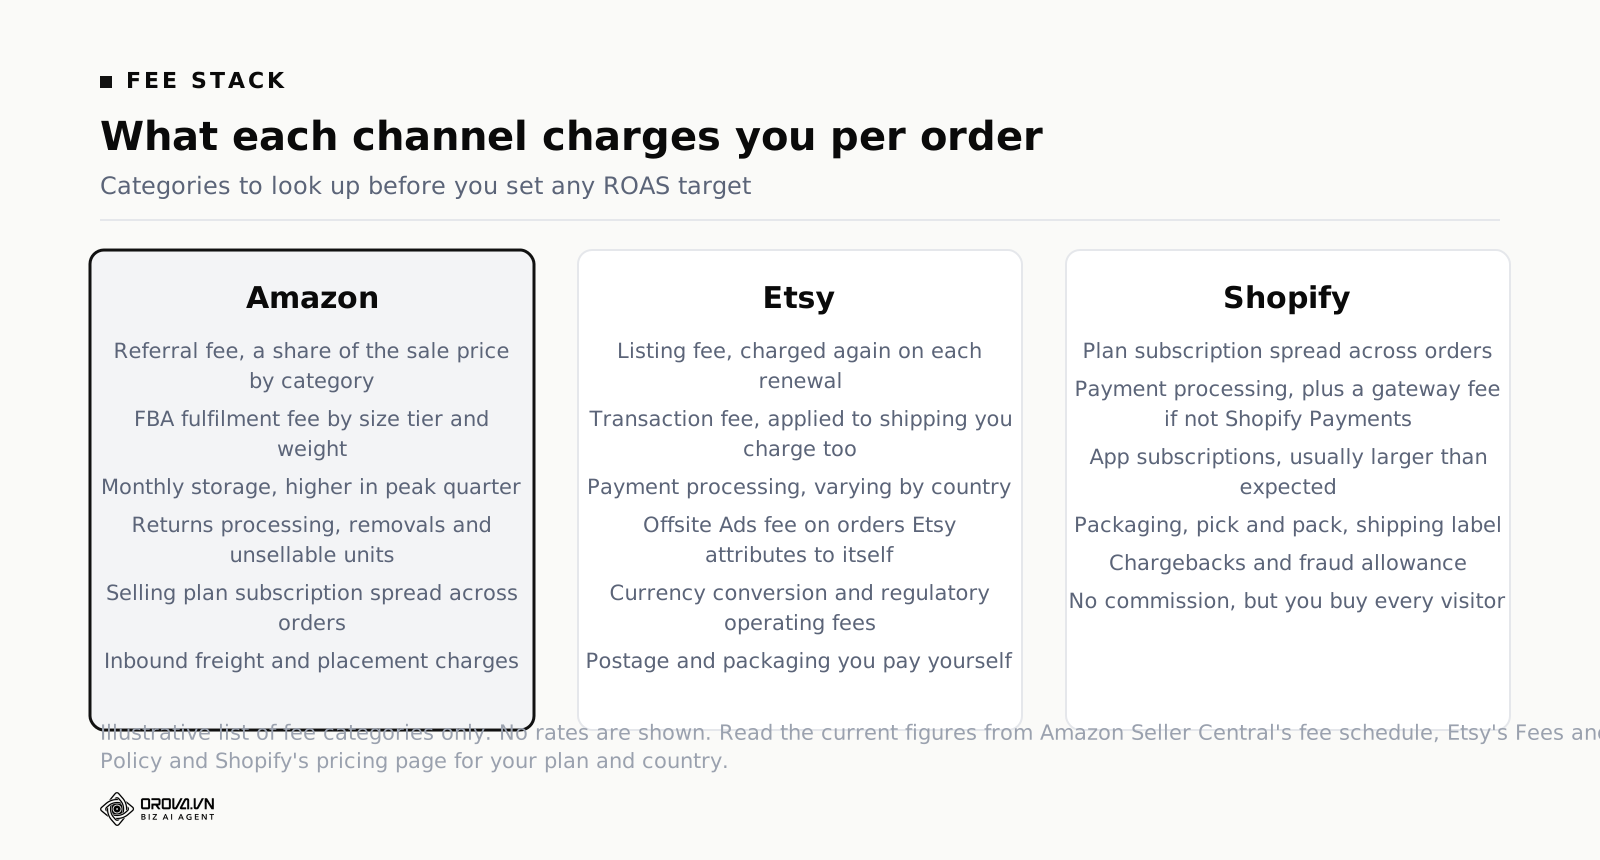
Amazon's public documentation for sellers lists its charges in Seller Central under the selling fee schedule and the FBA fee pages. The categories you need to capture are:
- Referral fee — a percentage of the total sale price, varying by product category, usually with a per-item minimum. This is the marketplace's commission and it is the single largest line for most sellers.
- Fulfilment fee — if you use FBA, a per-unit charge determined by size tier and weight. Dimensional banding matters more than people expect; a box that crosses a size boundary by a centimetre can jump a whole tier.
- Storage — a monthly charge per unit of volume, typically higher in the final quarter of the year, plus surcharges on inventory that has sat too long.
- Returns and removals — processing charges in some categories, plus the cost of units that come back unsellable and the cost to have them removed or disposed of.
- Account-level charges — the professional selling plan subscription, or a per-item fee on the individual plan, spread across your order volume.
- Inbound logistics — getting stock into the network, including any placement or split-shipment charges that apply to your account.
Every one of those is a per-order cost that must come out before you compute margin. The fulfilment fee in particular is the one sellers forget, because it does not appear on the invoice as a percentage and therefore does not feel like a commission.
Etsy: the categories to look up
Etsy publishes its charges in the Fees and Payments Policy in its Help Centre. The categories are:
- Listing fee — charged per listing, and charged again when a listing renews. Listings expire on a fixed cycle, so a slow-moving item accumulates renewals whether or not it sells. Spread this across the orders that listing actually produces.
- Transaction fee — a percentage of the order, and importantly it applies to the shipping and gift-wrapping you charge as well as the item price. Sellers offering free delivery are paying a transaction fee on shipping revenue they never collected separately.
- Payment processing — a percentage plus a fixed amount, varying by the country your bank account is in.
- Offsite Ads fee — a fee on orders Etsy attributes to advertising it runs on external platforms. The rate varies by seller tier, and participation is mandatory once a shop passes a revenue threshold. Both the rate and the threshold are in the policy; check them.
- Currency conversion and regulatory operating fees — applied in certain countries and on certain currency pairs.
- Subscription — if you are on a paid tier, spread across orders.
Etsy has a second complication that Amazon does not. Etsy Ads, the onsite programme you control, and Offsite Ads, the external programme you mostly do not, are charged in different ways. Onsite you pay for clicks up front. Offsite you pay a share of the order after the fact. That means Offsite orders arrive with contribution already reduced, and if you ignore this you will compute one break-even for a shop that actually has two.
Shopify: the categories to look up
Shopify publishes plan pricing and payment rates on its pricing page, with the details varying by country and by whether you use Shopify Payments or a third-party gateway. Capture:
- Plan subscription — a monthly amount, spread across orders. On low volume this is a meaningful per-order cost; on high volume it approaches irrelevance.
- Payment processing — a percentage plus a fixed amount per transaction, varying by plan tier and country. Using an external gateway instead of Shopify Payments adds an additional per-transaction charge on most plans.
- Apps — subscriptions for reviews, subscriptions management, upsells, shipping rules and the rest. Total them monthly and divide. This number is usually larger than the store owner expects.
- Fulfilment and packaging — whether you pick and pack yourself or use a third-party logistics provider, every order carries labour, materials and a shipping label.
- Chargebacks and fraud — a small allowance that is entirely real and almost never budgeted.
- Returns — inbound postage, inspection, restocking, and units that cannot be resold.
The line everyone forgets: shipping you absorb
Free delivery is not free. If you charge nothing for postage and the parcel costs $6.50 to send, that $6.50 is a per-order cost exactly as real as the cost of goods. On Etsy it is worse than it looks, because free delivery raises your item price to cover the postage, and the transaction fee is then charged on the higher price. On Shopify, partial shipping recovery is common — you charge $5, it costs $6.50, and you absorb $1.50 per order without ever seeing it on a report.
Put shipping into the fee stack explicitly. It is the single most common reason a seller's real break-even ROAS turns out to be a full point higher than the one they had written down.
What Is a Good ROAS on Amazon?
Work the mug set through Amazon. Every figure below is an illustrative placeholder chosen to make the arithmetic clear. Replace each one with your own number from the current fee schedule before you use any of it.
| Line | Per order | Where the number comes from |
|---|---|---|
| Sale price | $48.00 | Your listing |
| Cost of goods | −$18.00 | Supplier invoice |
| Inbound freight per unit | −$2.00 | Container cost ÷ units |
| Referral fee | −$7.20 | Placeholder — look up your category rate |
| FBA fulfilment fee | −$7.10 | Placeholder — depends on size tier and weight |
| Storage allocated per unit | −$0.50 | Monthly storage ÷ units sold |
| Returns and unsellable allowance | −$2.60 | Your own return rate × cost per return |
| Contribution before ads | $10.60 | What is left to pay for advertising and profit |
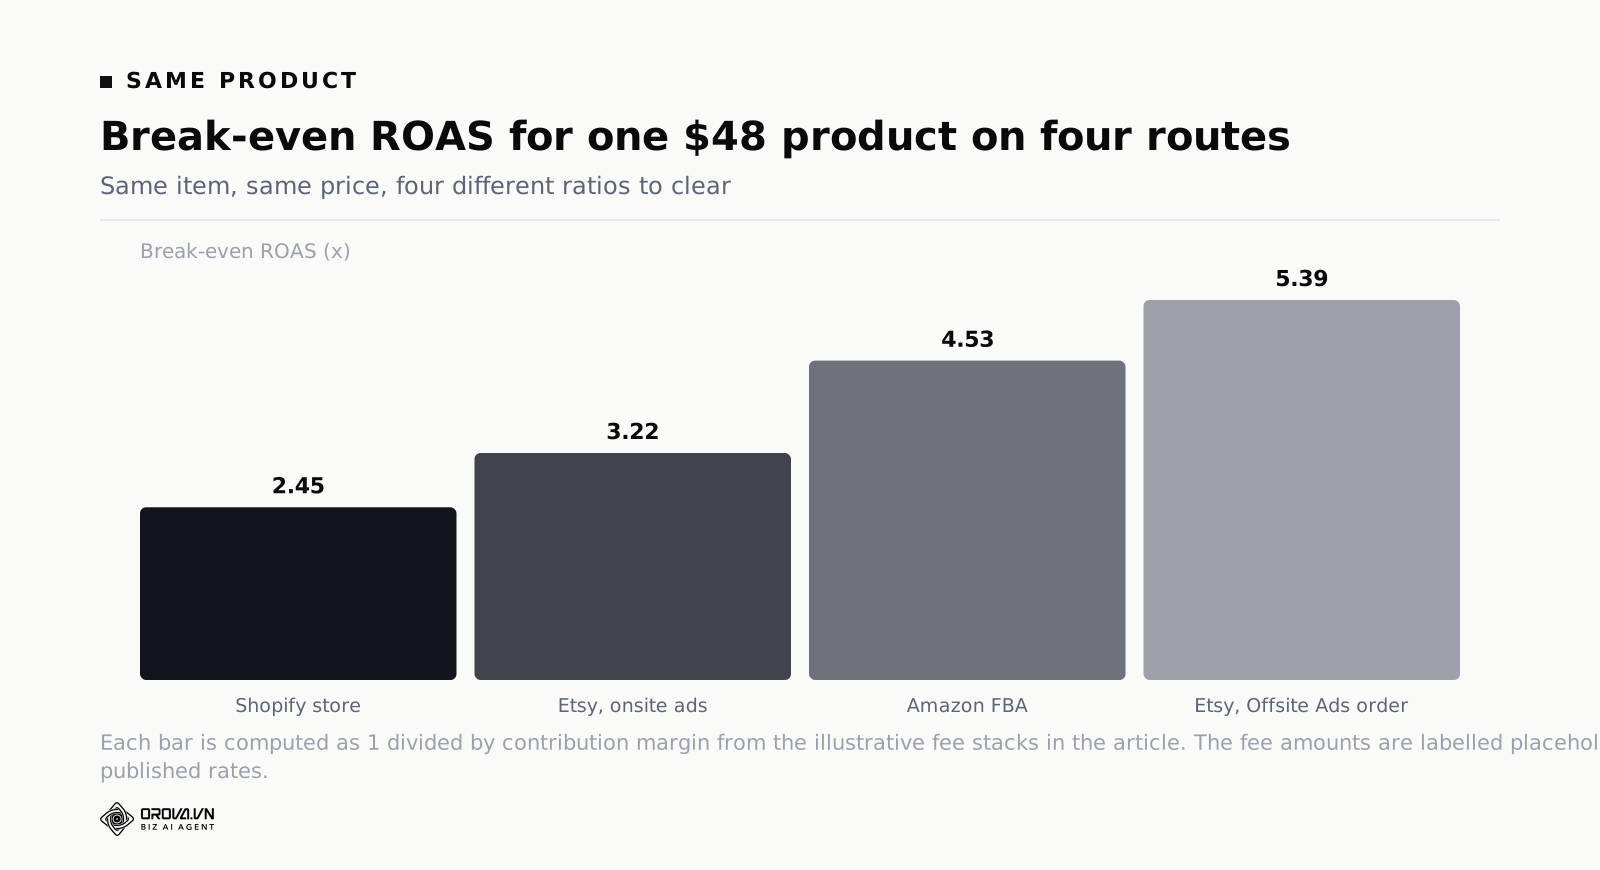
Contribution margin is $10.60 ÷ $48.00 = 22.1%. Break-even ROAS is 1 ÷ 0.221 = 4.53. Which means the seller in the opening scenario, sitting proudly at 4.2x, was losing roughly thirty cents of gross profit on every advertised order and had been for three months. The benchmark told them 4x was good. Their fee stack said 4.53x was survival.
Notice how much of the price never reaches you. On this example, $16.80 of a $48 order goes to the marketplace in referral and fulfilment charges before a single ad is paid for. That is why marketplace sellers routinely need ratios that would look extraordinary to someone running a direct-to-consumer store, and why a shared "good ROAS" figure across the two is meaningless.
ACOS is the same number upside down
Amazon's advertising console reports ACOS — advertising cost of sale — rather than ROAS. It is ad spend divided by attributed sales, which makes it the reciprocal: an ACOS of 25% is a ROAS of 4.0, and an ACOS of 22% is a ROAS of about 4.55. Convert once and think in whichever direction you find natural, but do not maintain two mental models. Your break-even ACOS on the example above is 1 ÷ 4.53 = 22.1%, which is the same 22.1% as the contribution margin. That is not a coincidence — break-even ACOS always equals contribution margin, which makes it the easier of the two to sanity-check.
Why campaign ROAS understates Amazon advertising
There is a genuine argument that Amazon campaign ROAS is too pessimistic, and it is worth understanding rather than dismissing. Ranking on Amazon responds to sales velocity. Advertised sales feed that velocity, which lifts organic placement, which produces unadvertised sales that the campaign report never claims. Judged only on the campaign line, a launch campaign looks like a disaster. Judged on what happened to the product's total revenue, it may have been the reason the listing exists at all.
The metric that captures this is total advertising cost of sale — total ad spend divided by total product revenue, advertised and organic together. It is the marketplace equivalent of blended ROAS, and it is the number that ties to your bank statement. Track both: the campaign figure to decide which keyword and which placement to adjust, and the total figure to decide whether the whole advertising operation on that channel is worth running.
A practical way to test the halo rather than assume it: pick one stable, mature product, hold everything else constant, and cut its ad spend materially for a fortnight. Watch total units, not advertised units. If total revenue barely moves, your ads were mostly buying sales you would have had anyway, and your real break-even is stricter than the arithmetic suggests. If total revenue falls further than the advertised units did, the halo is real and you can justify a lower campaign target.
What Is a Good ROAS on Etsy?
Same product, same $48, now in an Etsy shop with free delivery and self-fulfilment. Again, every fee figure is a labelled placeholder.
| Line | Per order | Where the number comes from |
|---|---|---|
| Sale price including free delivery | $48.00 | Your listing |
| Cost of goods | −$18.00 | Supplier invoice |
| Inbound freight per unit | −$2.00 | Container cost ÷ units |
| Outbound postage and packaging | −$6.50 | Your carrier account |
| Listing fee allocated | −$0.30 | Placeholder — listing and renewal charges ÷ orders |
| Transaction fee | −$3.20 | Placeholder — check the current rate in Etsy's policy |
| Payment processing | −$1.70 | Placeholder — varies by country |
| Regulatory operating fee | −$0.20 | Placeholder — applies in some countries only |
| Returns allowance | −$1.20 | Your own return rate × cost per return |
| Contribution before ads | $14.90 | What is left to pay for advertising and profit |
Contribution margin is $14.90 ÷ $48.00 = 31.0%, so break-even ROAS on Etsy Ads is 1 ÷ 0.310 = 3.22. Better than Amazon in this example, mainly because there is no fulfilment fee — you did the picking and packing yourself, and your labour is not in the table. If you pay someone to pack, put their cost in and watch the number move.
The second break-even that only Etsy has
Now add Offsite Ads. When Etsy attributes an order to advertising it placed on an external platform, it charges a fee on that order. Using a placeholder of $6.00 on this $48 sale, contribution falls from $14.90 to $8.90, margin falls to 18.5%, and break-even ROAS on that slice of orders rises to 5.39.
Read that carefully, because it is the trap. Those Offsite orders are not orders you bid for. You did not set a budget, you cannot pause them once you are past the mandatory threshold, and they arrive mixed in with everything else. If you compute one shop-wide break-even from an average that includes them, you will set an Etsy Ads target that is too loose. If you compute it excluding them, your shop-level profit will come in under what the model predicted every single month.
The clean way to handle it is to keep two figures. One break-even for orders you acquired through Etsy Ads or organic search, which is what you steer your onsite bidding against. One shop-level contribution that includes the Offsite fees you actually paid, which is what you take to your own accounts. Etsy reports Offsite Ads charges in the payment account, so the total is retrievable — it just never appears next to the ROAS you are looking at.
What Is Considered a Good ROAS on Shopify?
Same product on your own store. No commission, but you pay for every visitor and you carry the platform and app costs yourself.
| Line | Per order | Where the number comes from |
|---|---|---|
| Sale price | $48.00 | Your product page |
| Cost of goods | −$18.00 | Supplier invoice |
| Inbound freight per unit | −$2.00 | Container cost ÷ units |
| Shipping absorbed | −$1.50 | You charge $5.00, the label costs $6.50 |
| Payment processing | −$1.70 | Placeholder — check your plan and country rate |
| Plan and apps allocated | −$0.90 | Monthly subscriptions ÷ orders |
| Packaging, pick and pack | −$1.60 | Materials plus labour |
| Chargeback and fraud allowance | −$0.30 | Your last twelve months |
| Returns allowance | −$2.40 | Higher than marketplace here — no fulfilment partner absorbing steps |
| Contribution before ads | $19.60 | What is left to pay for advertising and profit |
Contribution margin is $19.60 ÷ $48.00 = 40.8%, so break-even ROAS is 1 ÷ 0.408 = 2.45. The same product, the same price, and a target barely half the Amazon one. A 4.2x on this channel is not "on the benchmark" — it is nearly double break-even, which usually means you are underspending and harvesting only the cheapest demand.
But the low break-even comes with a catch that the ratio hides. On Shopify you have no marketplace floor. On Amazon, stopping ads still leaves you with a listing sitting in search results. On your own store, stopping ads on a young catalogue can take total revenue close to zero. So the Shopify seller has an easier target and a harder job: they must generate every visit, and their advertising volume requirement is far larger relative to revenue than the marketplace seller's.
Two things distort Shopify ROAS more than they distort marketplace ROAS, and both are worth fixing before you trust the number.
Conversion value that includes tax and shipping
A very large share of stores fire the purchase event with a value that includes tax collected and shipping charged. Tax is not revenue — you remit it. Shipping revenue goes straight to the carrier. If both are in your conversion value, your reported ROAS is inflated by a consistent percentage every day, which means you will never spot it, because it never fluctuates. Take five recent orders, find them in your admin, and compare what settled against what the ad platform recorded. The correction factor you find applies to every historical number you have.
Feed quality on Shopping campaigns
Most Shopify ROAS on Google comes from Shopping and Performance Max, and both are driven by your product feed rather than by keywords. A feed with missing GTINs, stale prices, wrong availability or thin titles will underperform in ways that look like a bidding problem and are not. Disapproved or limited items simply do not serve, so your spend concentrates on whichever products the feed happens to describe well. If your Shopify ROAS is stubbornly flat, audit the feed before you touch bids — we cover what to check in Google Shopping feed health and data quality.
Blended and Channel ROAS When You Sell in Three Places
Once you sell on more than one channel, you need two views and they do different jobs.
Channel ROAS is one platform's attributed revenue over that platform's spend. It answers: inside this platform's own accounting, which campaign is doing better than which? That comparison is valid because everything inside it is measured the same way. Use it to decide what to pause, what to raise and which keyword to add.
Blended ROAS is total business revenue over total advertising spend across everything. It answers: is the whole operation making money? Nothing can be double-counted, because the denominator is every dollar you spent and the numerator is every dollar that arrived. Use it for budget decisions and for anything you have to defend to a finance person.
The multi-channel seller has a specific version of this problem. Amazon's report claims some revenue, Etsy's claims some, Meta and Google claim some of your Shopify revenue, and the sum of those claims will exceed your actual total. Some of the excess is genuine double-counting across platforms that cannot see each other. Some of it is view-through credit. Some is simply different attribution windows applied to the same days.
The single most useful number to track here is the ratio between total platform-claimed revenue and total actual revenue. Call it the overlap factor. Its level tells you little. Its trend tells you a great deal: if it climbs while blended ROAS stays flat, your platforms are claiming more credit for the same business, which usually means spend has drifted toward retargeting and brand terms that harvest demand rather than create it.
One rule with no flexibility for anyone selling internationally: never add spend figures denominated in different currencies. If your Amazon Europe account bills in euros and your Shopify ads bill in dollars, converting them with a monthly average rate quietly shifts every cost threshold you have set, and you will spend weeks chasing a campaign that was never the problem.
How New-Customer Value Moves the Target
Everything so far treats an order as a one-off transaction. For many sellers it is not, and the difference between the three channels is sharper here than anywhere else in this article.
On Shopify you own the customer. You have the email address, the order history and the right to market to them again. If a meaningful share of first-time buyers order a second time, the honest measure is acquisition cost against contribution over a horizon you choose — 90 days, 180 days, a year — rather than against the first transaction alone. That legitimately lets you accept a first-order ROAS below break-even, and it is the mechanism behind most direct-to-consumer scaling.
Two disciplines make it honest rather than wishful. Use a horizon short enough that you will actually collect the cash within your working capital cycle. And use realised repeat rates from your own order history, not a projection. A repeat rate assumed rather than measured is how stores talk themselves into two years of unprofitable acquisition.
On Amazon you do not own the customer in the same way. You cannot email them, you generally cannot see who they are, and the next time they want your product they may search generically and buy a competitor. Amazon does expose new-to-brand reporting on some ad formats, which tells you what share of orders came from buyers who had not purchased your brand recently, and that is genuinely useful for deciding how hard to push top-of-funnel placements. But it is a measure of acquisition, not a licence to lend against a lifetime value you have no way to collect directly. Subscribe and Save enrolments are the main exception, because those are a real, visible repeat stream.
On Etsy you sit in between. Buyers can favourite your shop and follow you, and Etsy sends them some notifications, but your direct marketing rights are limited and the buyer's relationship is largely with Etsy. Treat repeat value as real but small unless your own data says otherwise.
The practical consequence: the same seller can rationally run a first-order ROAS below break-even on their Shopify store while insisting on a ratio above break-even on Amazon, for the same product, in the same week. That is not inconsistency. It is the correct response to owning the customer in one place and renting them in another.
Five Mistakes That Make a Cross-Channel Comparison Useless
Comparing raw ROAS between a marketplace and your own store
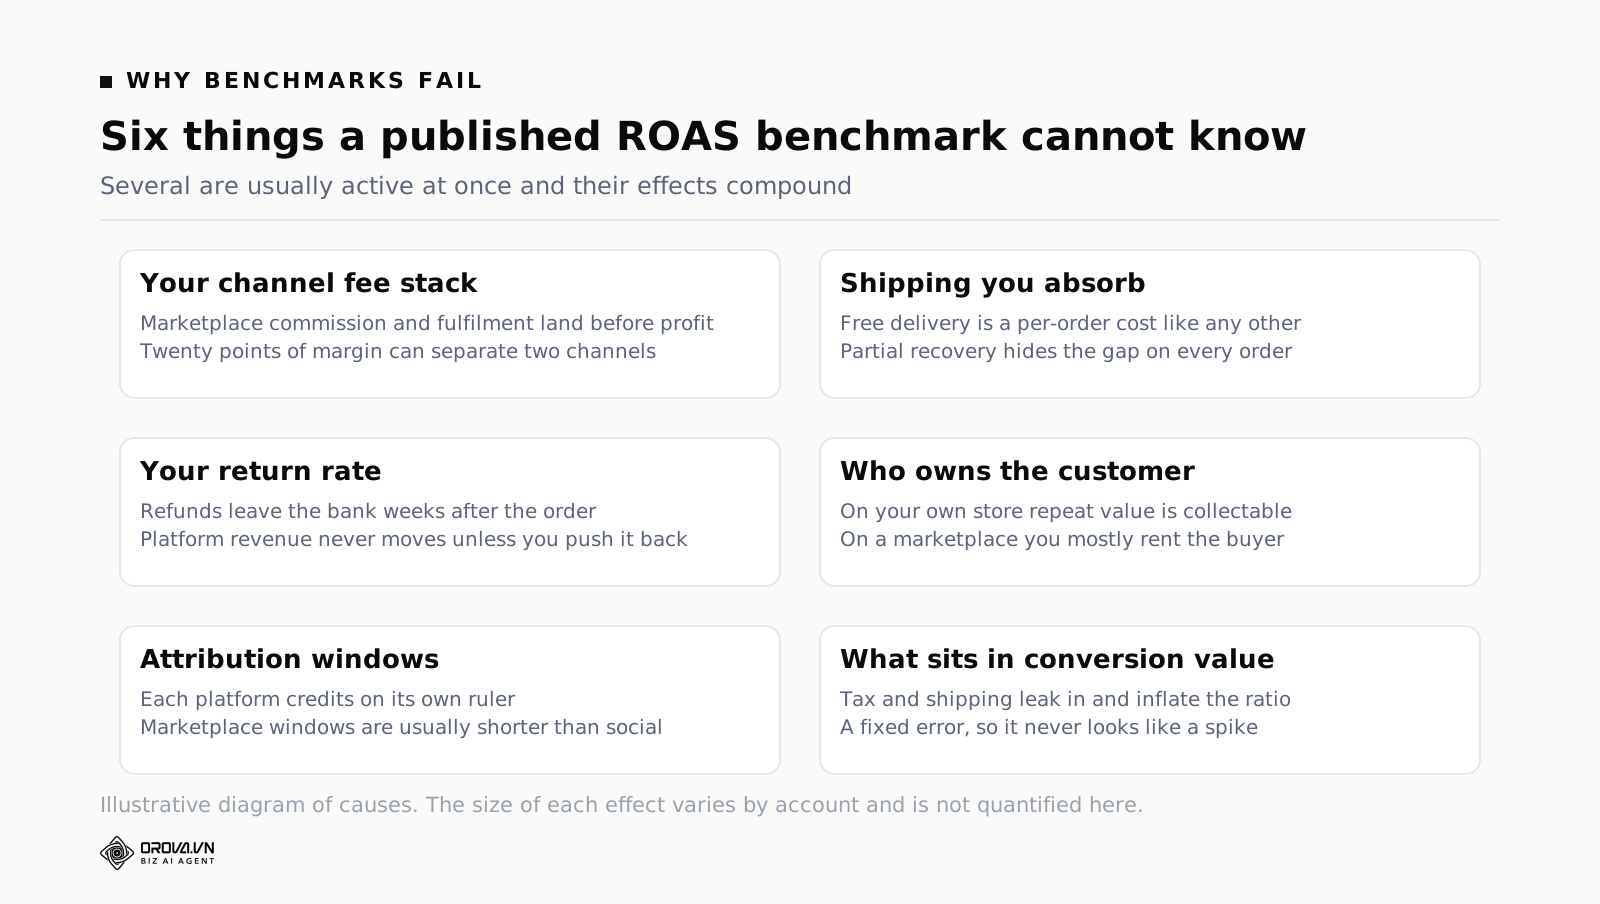
This is the mistake that produced the opening scenario. A 4.2x on Amazon and a 4.2x on Shopify describe two completely different profit outcomes because the fee stacks differ by twenty percentage points of margin. If you must put them in the same table, put break-even beside each one and compare the gap, not the ratio. "3.1 against a break-even of 2.45" and "4.2 against a break-even of 4.53" is a comparison that means something; "3.1 versus 4.2" is not.
Using gross margin instead of contribution margin
On the mug set, gross margin after goods and inbound freight is $28.00 on $48.00, or 58%, implying a break-even ROAS of 1.72. The real figures were 4.53, 3.22 and 2.45. Nothing in the account changed — only which costs were counted. Gross margin is the right input for a pricing conversation and the wrong input for a bidding target, and using it will make every channel look profitable at ratios that are quietly losing money.
Ignoring the fee that is charged after the sale
Etsy's Offsite Ads fee, marketplace return-processing charges, aged-inventory surcharges and chargebacks all land after the order is recorded. None of them appear in the ROAS you are looking at, and all of them come out of the same contribution. Reconcile against the payments statement, not against the ad report, at least once a month.
Treating zero as "no data"
This is a real defect I have seen in production reporting, not a hypothetical. If a reporting layer treats a value of zero as missing rather than as a genuine zero, campaigns that produced no revenue get dropped out of averages instead of dragging them down. Your reported ROAS is then computed only over the campaigns that converted, and every threshold and alert built on top inherits the error. The account looks healthier than it is at every level of the hierarchy, and it looks healthiest exactly where the problem is worst.
Averaging ROAS across campaigns or channels
Taking the arithmetic mean of ROAS values gives the same weight to a campaign that spent $40 and one that spent $40,000. Always sum the revenue, sum the spend, and divide once. Spreadsheet averages of ratio columns are wrong by construction and they are absolutely everywhere, usually in the summary row at the top of the report that everyone reads and nobody checks.
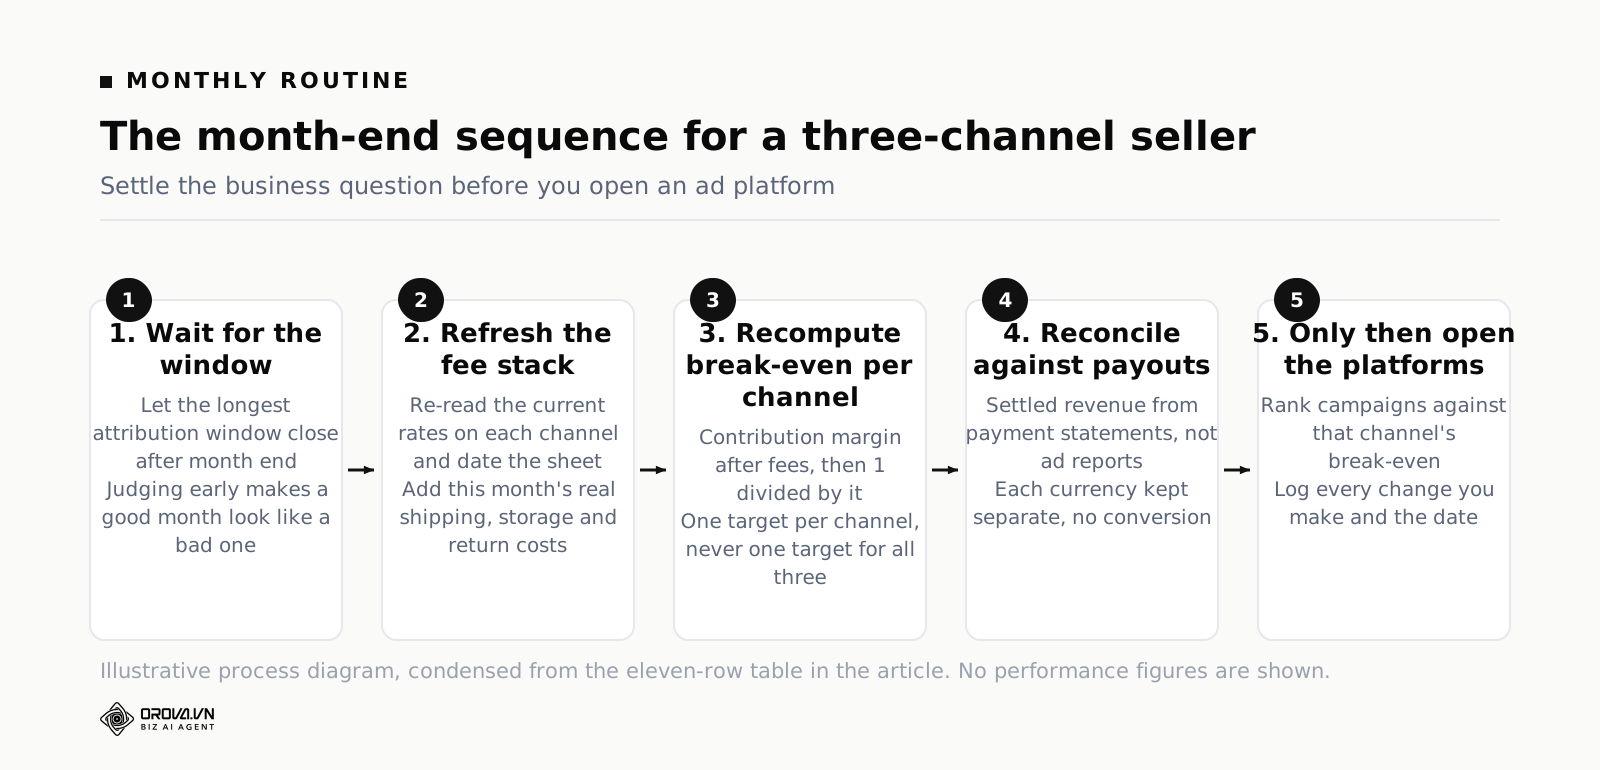
A Monthly Routine for Three Channels
Consistency beats sophistication. This takes an hour or two a month and catches nearly everything that matters.
| Step | What you do | What it protects you from |
|---|---|---|
| 1 | Wait until the longest attribution window in use has closed after month end before judging the month | Reporting an artificially bad month and cutting budget on it |
| 2 | Refresh the fee stack for each channel from the current published rates, and date the sheet | Targets built on rates that changed two quarters ago |
| 3 | Recompute contribution margin per channel using this month's real shipping, storage and return costs | A margin that drifted while nobody looked |
| 4 | Calculate break-even ROAS per channel as 1 ÷ contribution margin | Steering three channels toward one borrowed number |
| 5 | Pull each platform's spend for the exact calendar month, in its own currency, with no conversion | Exchange-rate distortion corrupting every threshold |
| 6 | Pull actual settled revenue per channel from the payments or payouts statement, not the ad report | Counting gross order value that never reached your bank |
| 7 | Compute blended ROAS on total settled revenue over total spend, and compare to a blended break-even | Believing a platform figure no bank statement supports |
| 8 | Record the overlap factor: platform-claimed revenue ÷ actual revenue | Missing a gradual drift toward demand harvesting |
| 9 | On Amazon, record total advertising cost of sale alongside campaign ACOS | Judging launch campaigns purely on advertised units |
| 10 | Only now open the ad platforms and rank campaigns on channel ROAS against that channel's break-even | Optimising before the business question is settled |
| 11 | Write down every change you made and the date | Being unable to explain next month's movement |
Step eleven looks like paperwork and is the most valuable row in the table. Without a change log, month-over-month movement is uninterpretable, and you will confidently attribute a swing to your new creative when it was a supplier price rise, a stockout, or a competitor's campaign ending.
Where Spreadsheets Stop and Tooling Starts
Everything above can be done in a spreadsheet, and for one channel at modest spend you should do exactly that. Nothing here needs software. The manual approach breaks at a predictable point: when the number of decisions per week exceeds the number of hours you have to make them carefully.
Three things get genuinely hard by hand once you are running three channels. First, applying one consistent rule across hundreds of ad groups and listings — "pause anything that has spent more than twice its channel break-even cost per order with no sale, but only after the attribution window has closed" is a sentence anyone can write and nobody can execute reliably across four hundred rows every morning. Second, holding one definition of revenue across platforms that each default to their own. Third, pushing real, settled revenue back to the bidding systems, which needs a webhook from your order system rather than a report.
That third one is the highest-value piece and the one most often skipped, because it needs engineering time rather than a settings toggle. If a platform is optimising toward a purchase value that includes tax, shipping and orders that were later refunded, no amount of careful reporting on your side changes what it buys. In Orova Ads each project gets its own webhook link so your order system or CRM can push real conversions back to the platform — the Meta Conversions API path is live today — while Google Ads, Meta and TikTok connect through each platform's own login rather than shared passwords, and campaign, ad group, ad and daily metric data sync into one table you can filter across all three. Rules are written as plain sentences with data variables in braces, so "pause when spend exceeds twice target cost per order and orders equal zero" stays readable to whoever wrote it, and each rule set runs on its own schedule. There are three operating modes — advisory, hybrid and automatic — with advisory as the default, because handing bid control to a system before you trust its numbers is how people lose a quarter. The platform refuses to combine ad accounts billed in different currencies rather than converting them silently, which is an ugly restriction that exists precisely because one wrong exchange rate corrupts every cost threshold downstream.
Whatever you use, the order does not change: build the fee stack, compute break-even per channel, verify revenue against the payout statement, and only then automate. Automating a broken definition just produces wrong decisions faster and in higher volume.
Frequently Asked Questions
Is 4x a good ROAS?
It depends entirely on your contribution margin after channel fees. A 4x is a loss for a business whose margin after fees is 22%, since that business needs 4.53x to break even. The same 4x is nearly double break-even for a business at 41% margin. The number 4 has no meaning outside a fee stack, which is why the benchmark keeps producing confident, profitable-looking accounts that lose money.
Why is my Amazon ROAS lower than my Shopify ROAS but Amazon is still worth running?
Because Amazon supplies demand you would otherwise have to buy. Your advertising there buys position in a queue of shoppers who already arrived; on your own store it buys the shopper as well as the position. The right comparison is not the ratio but the gross profit each channel contributes per month after its own fees, and the volume each can absorb. A channel with a tougher break-even can still be the larger profit contributor.
Should Etsy Offsite Ads fees be inside my ROAS or outside it?
Outside the Etsy Ads ROAS you use for bidding, and inside your shop-level contribution. Offsite fees are not the result of a bid you placed, so folding them into the ratio you steer with will make you bid badly. But they are a real cost against real orders, so leaving them out of your shop margin will make your accounts wrong. Two numbers, both maintained, is the honest answer.
Is a higher ROAS always better?
No, and this catches good operators. A ratio far above break-even usually means you are underspending and harvesting only the demand that was already there. If your Shopify break-even is 2.45 and you are running at 5.0, increase spend deliberately and watch total gross profit rather than the ratio. As long as the marginal profit on the added spend stays positive, a falling ROAS with rising profit is exactly the outcome you want.
How often should I recompute break-even ROAS?
Quarterly at minimum, and immediately after any change to supplier prices, shipping rates, fulfilment fees, payment terms or return rates. Marketplace fee schedules and fulfilment surcharges change on their own timetable, not yours. Plenty of sellers are still measured against a target computed from a cost structure that stopped being true eighteen months ago, which means the team is diligently hitting a number that no longer corresponds to profit.
Do I need a different ROAS target for each product as well as each channel?
If margins differ meaningfully between products, yes. A single account-level target forces your cheapest, thinnest-margin item and your best item to clear the same bar, which means one is being starved and the other is being overspent on. Group products into two or three margin bands, set a break-even for each band on each channel, and structure campaigns so the bands do not share a budget. For a fuller treatment of setting targets from margin bands, see Break Even ROAS Calculator: Find Your Profit Target.
What to Do This Week
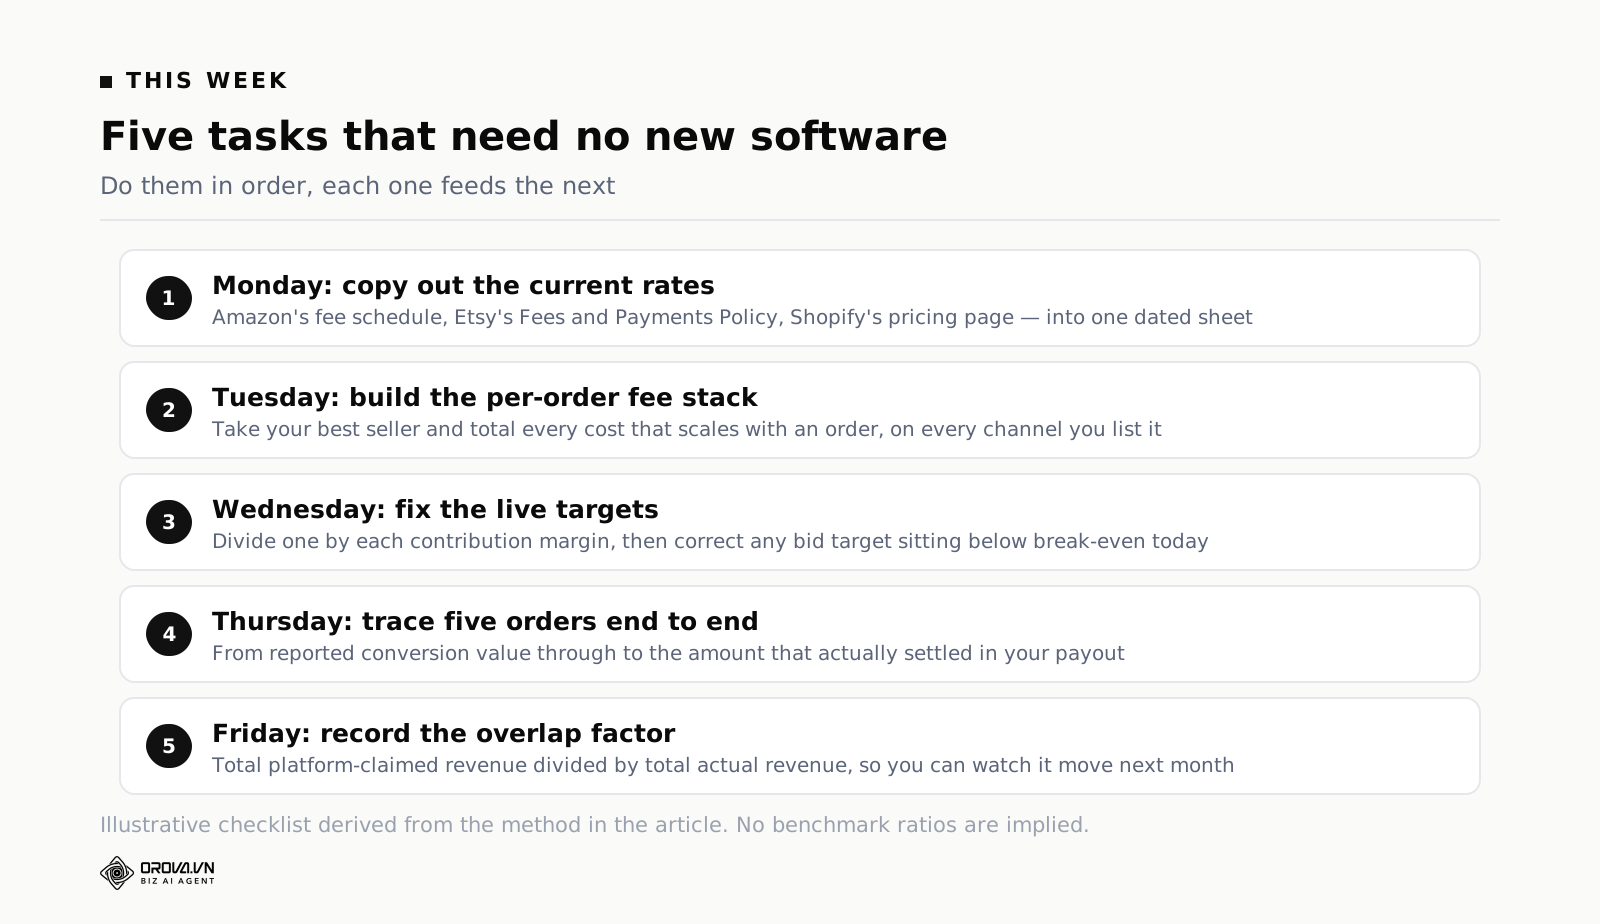
Monday. Open each channel's current fee documentation — Amazon's fee schedule in Seller Central, Etsy's Fees and Payments Policy, and Shopify's pricing page for your plan and country — and write the rates that apply to you into one sheet. Date the sheet. This is the input everything else depends on, and it is the one most people have never actually done.
Tuesday. Take your single best-selling product and build the per-order fee stack for every channel you sell it on, in the format of the tables above. Include shipping you absorb, packaging, storage and a returns allowance. Divide one by each contribution margin. You now have a break-even ROAS per channel, and at least one of them will surprise you.
Wednesday. Compare those break-even figures against the targets currently sitting in your bid strategies and in your head. Where the live target is below break-even, fix it today rather than waiting for the month to end. Every day at a too-low target is a day of buying orders at a loss.
Thursday. Pull five recent orders from each channel and trace them from the ad platform's reported conversion value through to the amount that actually settled in your payout statement. Look for tax, shipping and pre-discount subtotals leaking into conversion value, and for post-sale fees landing after the order was recorded. Whatever error you find repeats on every order, every day.
Friday. Add up what every platform claimed for last month and divide it by what your order systems actually recorded. Write the number down. That is your overlap factor, and from next month you will be able to see it move.
Do those five and the next time someone tells you what a good ROAS is, you will be able to answer in about ten seconds — with three different numbers, one per channel, each of which you can defend.
Stop Guessing, Start Comparing Channels Properly
Working out a real break-even ROAS for every channel means pulling fees, shipping costs, and margins together by hand, then redoing the math every time a fee changes or you add a new sales channel. That is the part that eats an afternoon and still leaves you unsure if you got it right.
Orova Ads is built to handle that comparison automatically, pulling your channel costs and margins together so you can see where your ad spend is actually working instead of just where the ratio looks good. If tracking this by hand has been eating your time, it's worth a look.
Set the target once, let AI hold it
Write your ROAS target as a rule in plain language and Orova Ads applies it across platforms.
Start for free