
ROAS Formula: How to Calculate It and Break Even
You open Meta and it says your ads are winning. You open Google and it says the same thing. You add the two numbers together, feel good for a second, and then you check your bank balance and it is lower than last month, even though nothing was stolen and every order actually shipped. This is the moment most business owners start googling the roas formula, hoping the math will explain what their bank account is telling them.
The problem is not that the ad platforms are lying to you. It is that each one is answering a narrow question — "how much revenue happened near this ad" — not the question you actually care about, which is "did this spend make me money after returns, fees, and everything else." Adding two platform numbers together, using revenue before refunds, or comparing your results to a generic "good ROAS" benchmark from someone else's business all feel like reasonable shortcuts, but they quietly stack errors on top of each other until the final number has almost no connection to your actual profit. It does not help that roughly a quarter of programmatic ad spend is wasted on inefficient buying and invalid impressions in the first place, according to the ANA Programmatic Transparency Study, so even the "spend" half of your ROAS math may already be shakier than you think.
This article walks through how to calculate ROAS the way your own business actually needs it calculated — not the platform version, the profit version. By the end, you will know how to combine numbers from different ad platforms without double-counting, how to find your own break-even point from your real margins, and how to tell, in plain terms, whether a given ROAS is actually good for a business at your stage or just good on a slide.
How Is ROAS Calculated?
ROAS is calculated by dividing the revenue attributed to a campaign by the amount spent on that campaign over the same period. Spend $2,000 and get $8,000 in attributed revenue and your ROAS is 4, often written 4x or 400%. The number is a ratio, not a profit figure.
That is the whole formula. Return on ad spend has no hidden coefficient, no industry adjustment, no seasonal weighting. Which is exactly why it gets misused. A formula this simple invites people to stop thinking after they have divided, when the two inputs are where all the difficulty lives.
Written out: ROAS = attributed revenue ÷ ad spend. Some teams express it as a multiple (4.2x), some as a percentage (420%), and some as a decimal (4.2). They are the same thing. Percentages tend to cause confusion because people read "420%" as a profit margin, which it is not. A multiple is clearer, and it makes the mental arithmetic against break-even easier. Stick to multiples.
How to Calculate ROAS: The Formula, Step by Step
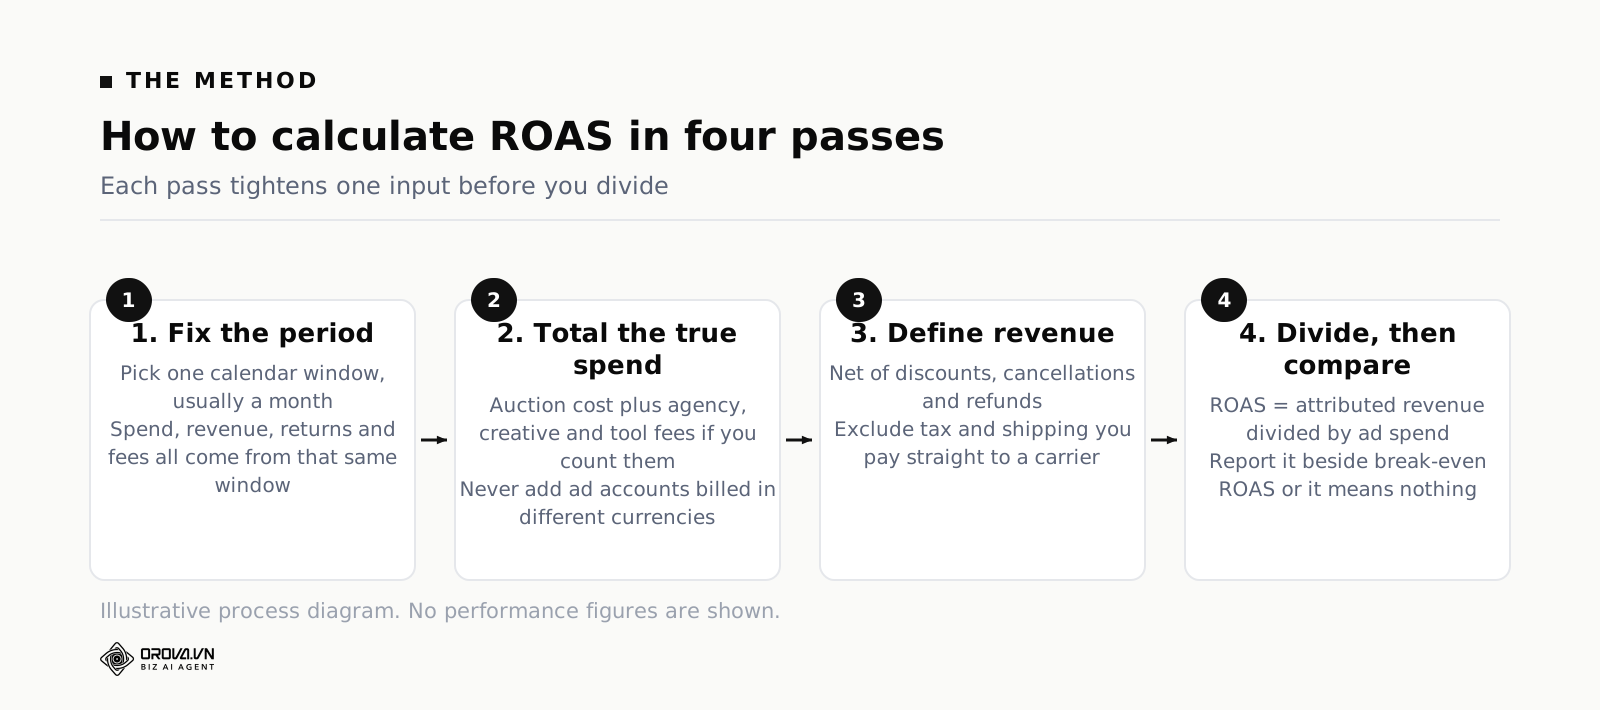
If you want a number you can defend in a meeting, do it in four passes rather than one. Each pass tightens one input.
Step one: fix the period before you touch anything else
Pick a calendar window and refuse to move it. Month is the usual choice because it matches how you pay for inventory, rent and salaries. Every number that follows must come from that same window: the spend, the revenue, the returns, the fees. The single most common source of a fake ROAS is a spend figure from one date range compared against a revenue figure from another. It happens more often than people admit, usually because the ad platform defaults to "last 30 days" while the finance export runs on calendar months.
Step two: get the spend right, including the parts platforms hide
Ad spend is not only what the auction charged. Depending on how you operate, your true cost of running the channel includes agency retainers, creative production, the freelancer who cuts your video, and any percentage fee a tool takes off your budget. Whether you fold these into ROAS or track them separately is a judgement call. What matters is consistency: if you exclude agency fees this month, exclude them next month too, and say so on the report.
One rule with no flexibility: never mix currencies. If one ad account bills in dollars and another bills in euros, do not add the two spend figures together and hope the exchange rate averages out. It does not. A single misapplied rate quietly shifts every cost threshold you have set, and you will chase the wrong campaign for weeks.
Step three: decide what "revenue" means and write it down
This is where most calculations quietly break. Revenue can mean order value at checkout, order value after discounts, order value after returns, or gross profit. Each gives a different ROAS from the same campaign. Pick one, define it in a sentence, and put that sentence at the top of your report. My recommendation for anyone selling physical goods: use net revenue after discounts and after refunds, because that is the only revenue that ever reaches your bank.
Step four: divide, then immediately compare to break-even
A ROAS on its own is not information. 3.4 is excellent for a business with a 60% contribution margin and a slow bleed for a business with a 25% margin. The division is step four; the comparison is what makes it a decision. Never report a ROAS without the break-even number beside it.
How to Calculate Break-Even ROAS From Gross Margin
Break-even ROAS is the point where the gross profit generated by your ads exactly equals what you paid for them. Below it you are buying revenue at a loss; above it you are contributing to fixed costs and profit. The formula is:
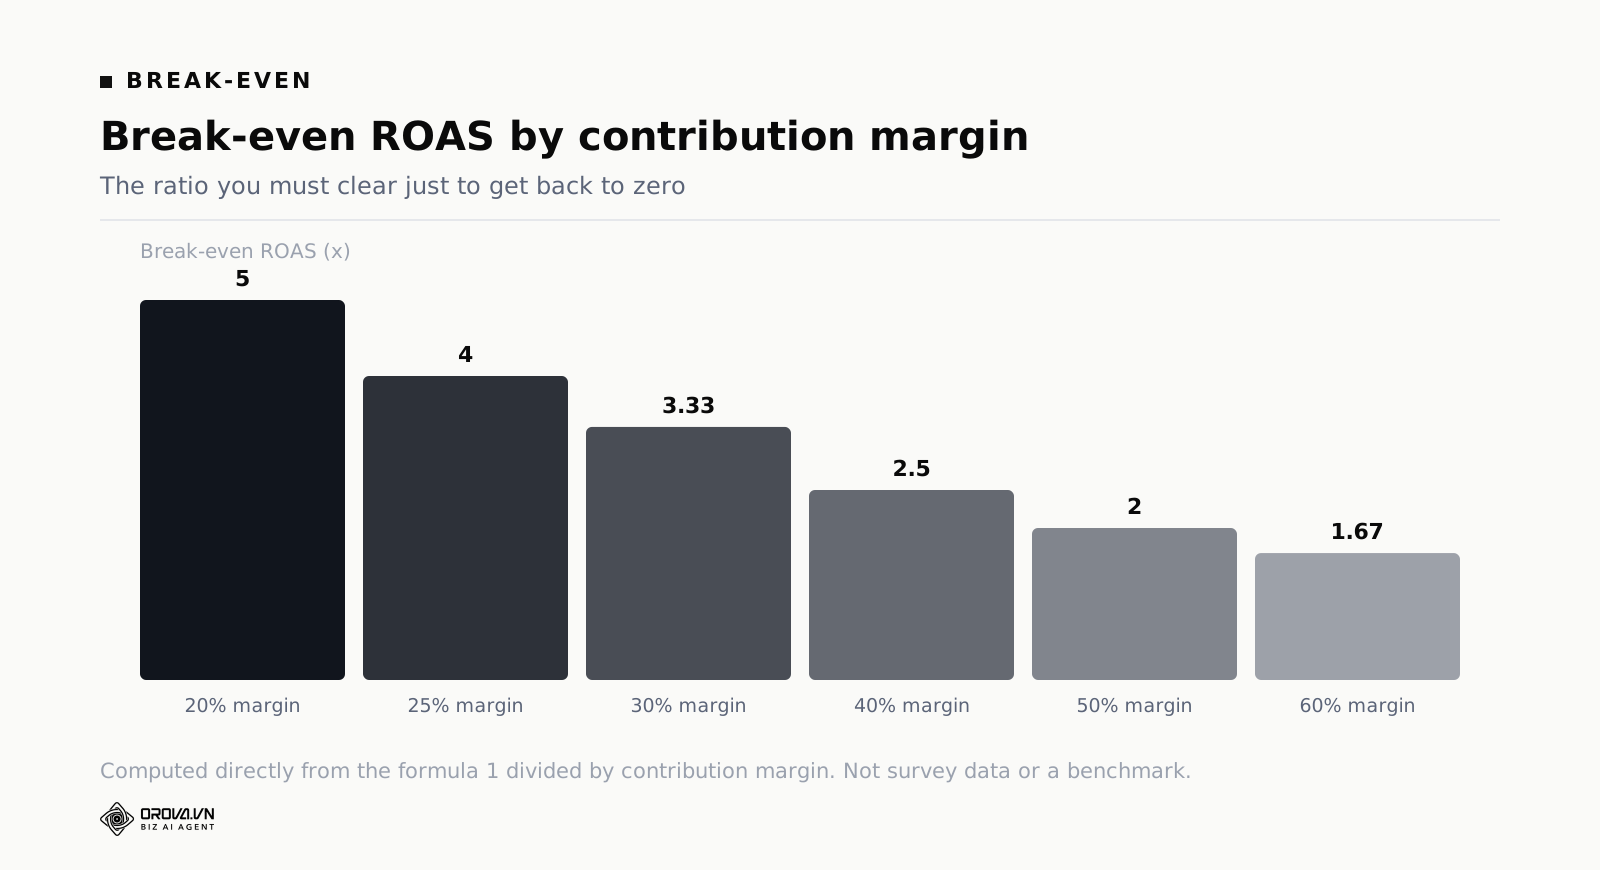
Break-even ROAS = 1 ÷ contribution margin
If forty cents of every revenue dollar survives after the cost of goods, shipping, payment processing and any per-order handling, your contribution margin is 0.40 and your break-even ROAS is 1 ÷ 0.40 = 2.5. Every dollar of ad spend needs to produce $2.50 of revenue just to get you back to zero.
The reason this matters more than any benchmark is that the relationship is not linear. Learning how to calculate break-even ROAS for your own numbers usually produces a shock, because margins in the twenties demand ratios most people would consider extraordinary. A business at 20% margin needs a 5.0 ROAS to break even. A business at 60% margin breaks even at 1.67. Those two companies could run identical ads with identical results and one is thriving while the other is dying.
Which margin do you actually use?
Gross margin and contribution margin are not the same thing, and using the wrong one is a quiet way to convince yourself you are profitable. Gross margin usually subtracts only the cost of goods. Contribution margin subtracts every cost that scales with each additional order: goods, inbound freight amortised per unit, outbound shipping you do not fully recover, packaging, payment processing, marketplace commission, and the cost of handling returns.
Take an example. A store sells a $100 product. Cost of goods is $50, so gross margin looks like 50%, implying a break-even ROAS of 2.0. Now add outbound shipping of $9 that the customer only partly covers, $2.90 in payment processing, $3 of packaging and pick-and-pack labour, and an average $9 hit per order from returns and reshipments. Contribution per order is now around $26, so contribution margin is 26% and break-even ROAS is 3.85, not 2.0. Those numbers are an illustration, not a benchmark, but the direction is universal: real break-even is always higher than the one you get from gross margin alone.
If you want to go deeper on setting channel targets from your own margin structure rather than from a generic benchmark, we walk through the arithmetic in more detail in Break Even ROAS Calculator: Find Your Profit Target.
Adding a profit requirement on top
Break-even keeps you alive. It does not pay for your office, your team or yourself. If you need paid media to contribute a specific amount of gross profit, extend the formula:
Target ROAS = 1 ÷ (contribution margin × (1 − desired profit share))
Suppose your contribution margin is 40% and you want a quarter of the gross profit from ads to be actual profit rather than reinvested. The denominator becomes 0.40 × 0.75 = 0.30, and your target ROAS is 3.33 rather than the 2.5 break-even. Again, that is a worked example with numbers I chose, not a recommendation for your business. The point is that the target is derived, not borrowed.
Platform-Reported ROAS vs Business ROAS
Return to the opening scenario, and let me make it concrete with an illustrative store I will call Northwind Supply. Every figure below is invented for the example; the arithmetic is what matters.
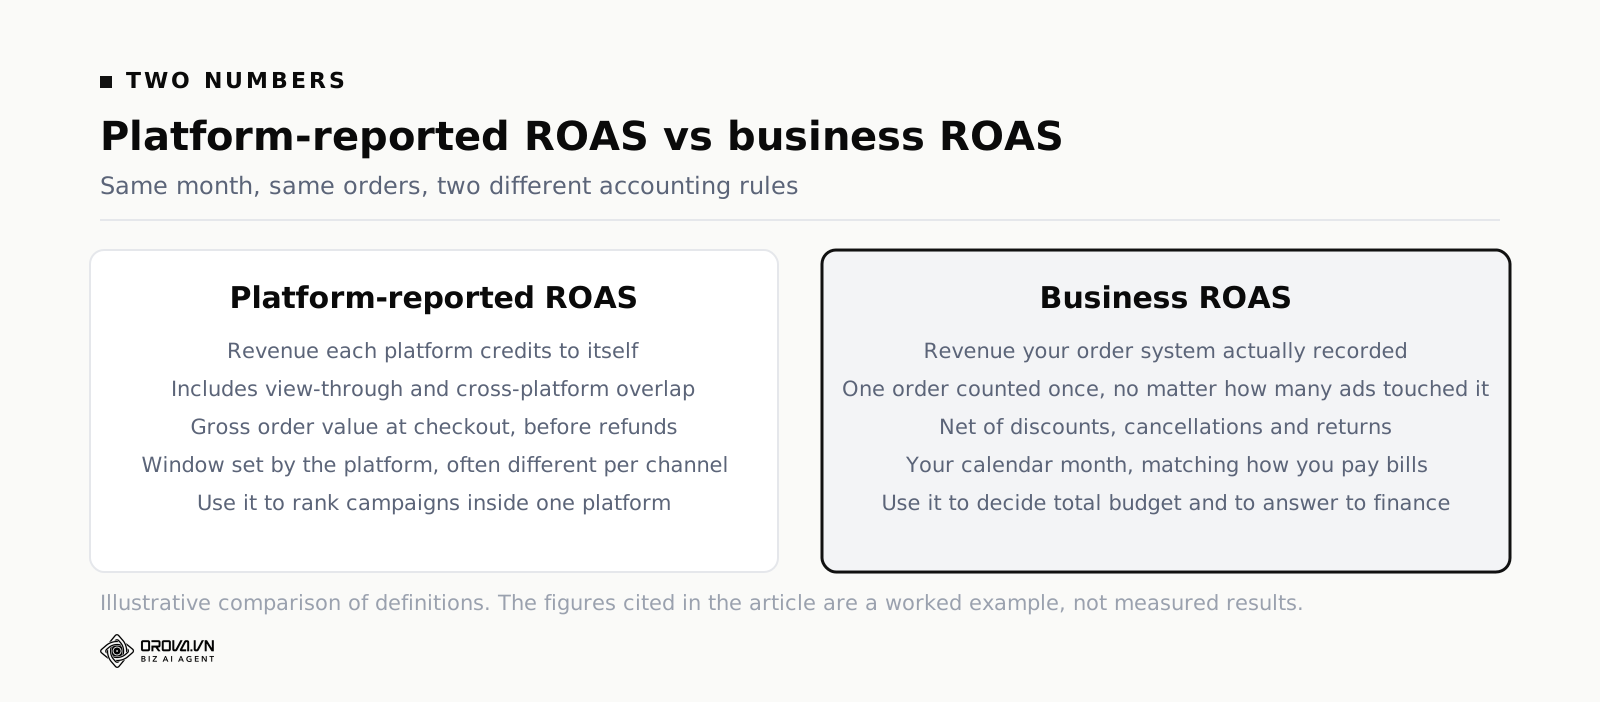
Northwind spent $10,000 in a month: $6,000 on Meta, $4,000 on Google. Meta reported $28,400 in purchase value, a 4.73 ROAS. Google reported $19,800 in conversion value, a 4.95 ROAS. Add the reported revenue and you get $48,200, which against $10,000 of spend gives an apparent 4.82.
The store's own order system recorded $37,500 in total revenue for the month, from every source including direct traffic, email and organic search. The platforms between them claimed $48,200. The platforms are claiming 28% more revenue than the entire business made from every channel combined. Nothing here is fraud. It is the predictable result of two systems each counting the same orders using their own rules.
Why the same order appears twice
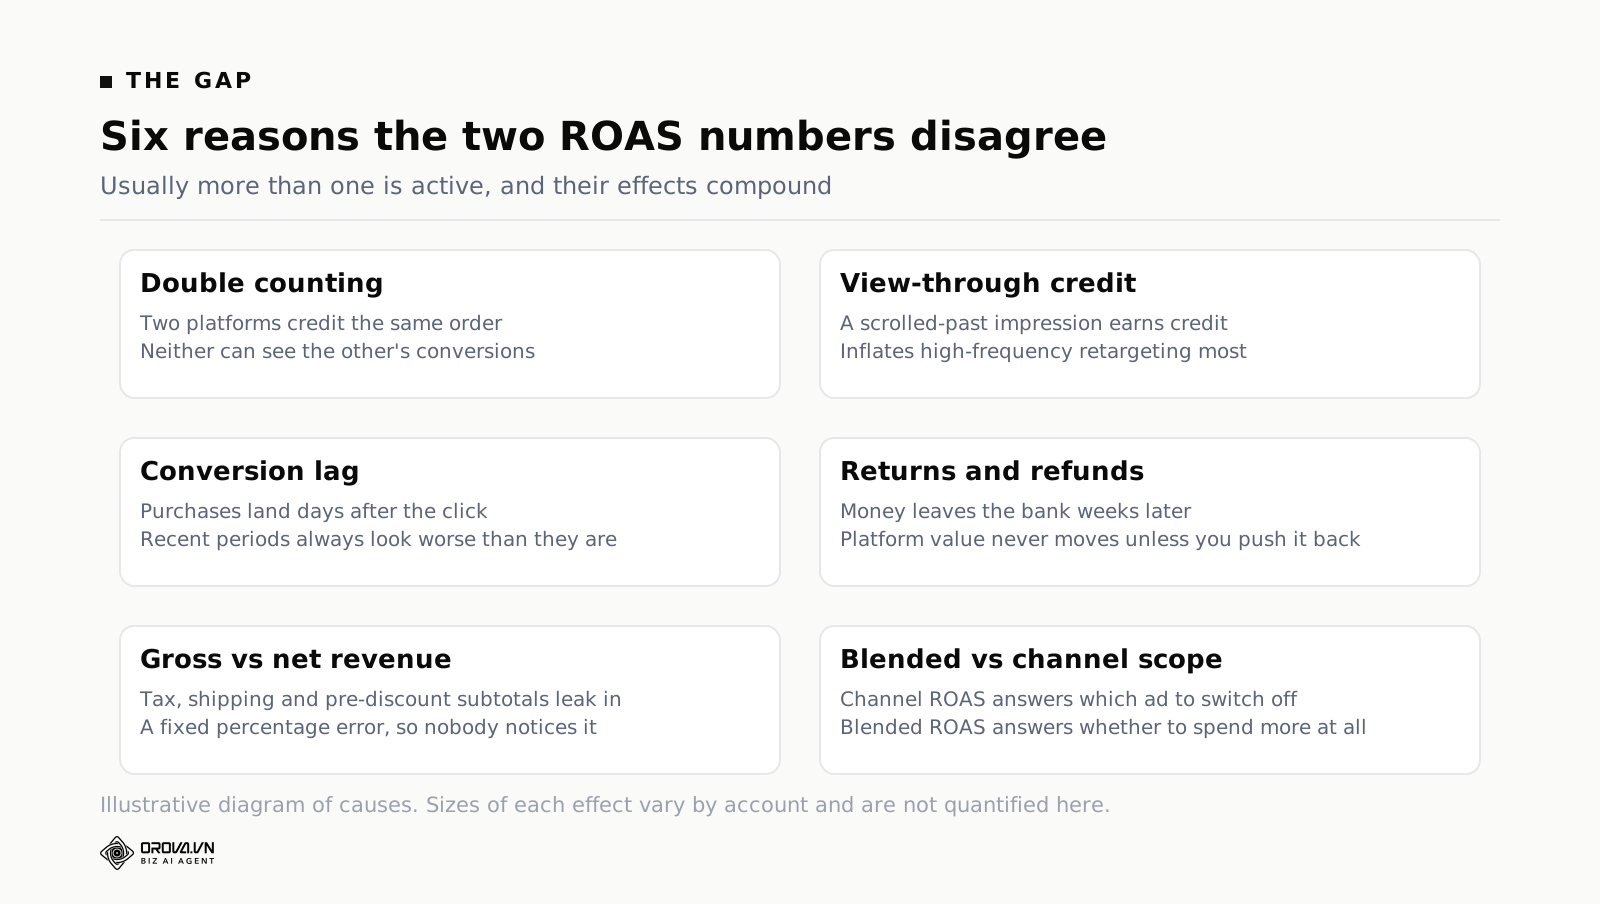
A customer sees your Instagram ad on Tuesday, ignores it, searches your brand name on Thursday, clicks your Google brand ad, and buys. Meta counts the purchase because its ad was seen or clicked inside its attribution window. Google counts the same purchase because its ad received the last click. Both platforms are following their own documented rules, and neither has visibility into the other. One order, two credits, one real bank deposit.
The more channels you run, the worse this gets. Three platforms with overlapping windows can triple-count a single order. This is not a bug you can configure away — it is structural, because no platform is willing to hand its conversion data to a competitor for deduplication.
Why platform revenue is gross revenue
Platforms record the value passed to them at the moment of purchase. They do not know about the refund three weeks later, the discount code applied at checkout that your pixel did not subtract, the payment that failed on capture, or the fraudulent order your team cancelled. Every one of those reduces your bank balance and none of them reduce the ROAS in your ad manager unless you actively send refund events back.
Working the example to the end
Take Northwind's real revenue of $37,500 for the month. Blended ROAS on total business revenue is $37,500 ÷ $10,000 = 3.75, already well below the 4.82 the platforms suggested. Now apply a 9% return rate: net revenue becomes $34,125, and net-revenue blended ROAS drops to 3.41.
Northwind's contribution margin after goods, shipping, packaging and payment fees is 26%. Break-even ROAS is 1 ÷ 0.26 = 3.85. The store is running at 3.41 against a break-even of 3.85. Gross profit from that revenue is $34,125 × 0.26 = $8,872, against $10,000 of ad spend — a contribution loss of about $1,128 before a single fixed cost is paid. The ad managers said 4.82. The business lost money. Both statements are arithmetically correct.
Attribution Windows and Conversion Lag
The second structural gap is time. A ROAS is a snapshot of a period, but purchases do not respect period boundaries.
What an attribution window does
An attribution window is the length of time after an ad interaction during which a conversion still gets credited to that ad. Meta's Ads Manager documentation describes the default attribution setting as 7-day click and 1-day view. Google Ads Help, in "About conversion windows", describes a default click-through conversion window of 30 days, configurable by the advertiser. Those two defaults are different by design, which means a Meta ROAS and a Google ROAS are not measured on the same ruler even before you consider anything else.
View-through attribution is the sharper edge. A 1-day view window credits a purchase to an ad the person scrolled past without clicking, as long as it was rendered on screen within the previous day. For a high-frequency retargeting campaign shown to people who were already going to buy, view-through credit can inflate reported ROAS substantially. The fix is not to ban view-through; it is to look at click-only ROAS alongside the default and note the size of the gap.
Conversion lag makes recent periods look terrible
Conversion lag is the delay between the ad interaction and the purchase. For an impulse purchase under twenty dollars, most conversions land the same day. For a $600 considered purchase or a business-to-business enquiry, the median gap can run into weeks.
This creates a trap that costs advertisers real money every month. You check yesterday's ROAS, see 1.1, and pause the campaign. Ten days later the delayed conversions arrive and the true figure for that day was 3.6 — but you already killed the campaign and reallocated the budget. The reverse trap is just as common at month end: you report a poor month on the last day, then the number silently improves after the report has already been circulated.
Two habits fix most of this. First, never judge a period until at least one full attribution window has passed since its end. Second, measure your own lag curve — what share of a day's conversions arrive on day zero, day one, day three, day seven — and use it to discount fresh data instead of reacting to it. We cover how to build that curve and how to read incomplete periods in ROAS Formula & Conversion Lag: Why Today's ROAS Is Wrong.
Gross vs Net Revenue: The Number Most Reports Get Wrong
If you only change one thing after reading this, change the revenue definition in your reports from gross to net.
Gross revenue is the total order value at the moment of checkout. Net revenue is what is left after discounts, cancellations, failed payments, refunds and returns. The gap between them is a fixed characteristic of your business, not a rounding error. Apparel with sizing variation can lose a large share of gross revenue to returns; a digital product might lose almost nothing. A single ROAS target applied across both would be nonsense.
Discounts are subtracted less often than you would think
Many tracking setups fire the purchase event with the pre-discount subtotal, or with a value that includes shipping and tax. Shipping revenue that you immediately pay to a carrier is not margin. Tax you collect and remit is not revenue at all. If your conversion value includes either, your reported ROAS is inflated by a consistent percentage every single day, and you will never notice because it never fluctuates.
Check this directly rather than assuming. Take five recent orders, find them in your order system, and compare the value your platform recorded against the amount that actually settled. If they differ, you now know your correction factor and can apply it to every historical number you have.
Returns should be pushed back, not just subtracted
Subtracting refunds at the reporting layer keeps your numbers honest for humans. It does not help the algorithm, which is still optimising toward the inflated value it was told about. If your platform supports refund or negative-value events, send them. The bidding system will start steering away from the audiences and creatives that produce orders which come back. This is one of the highest-leverage measurement changes available to a physical-goods advertiser, and it is almost always skipped because it needs engineering time rather than a settings toggle.
Blended ROAS vs Channel ROAS
These are two different tools and both belong in the report.
Channel ROAS uses one platform's attributed revenue over that platform's spend. It answers: within this platform's own accounting, which campaign, ad set and creative is doing better than which? That comparison is valid because everything inside it is measured the same way. Channel ROAS is for optimisation decisions.
Blended ROAS uses total business revenue over total marketing spend across all channels. It answers: is the whole marketing operation making money? Because the denominator is every dollar spent and the numerator is every dollar earned, nothing can be double counted. Blended ROAS is for budget decisions and for board meetings.
The mistake is using one for the other's job. Blended ROAS cannot tell you which Meta creative to switch off — it does not know about creatives. Channel ROAS cannot tell you whether to raise the total budget — it will happily promise incremental returns that are partly other channels' work. Teams that only track channel ROAS almost always overestimate paid media. Teams that only track blended ROAS cannot explain why it moved.
The one relationship worth watching every week
Track the ratio between the sum of channel-reported revenue and your actual total revenue. In the Northwind example that is $48,200 ÷ $37,500 = 1.29. Call it the overlap factor. On its own the level tells you little. The trend tells you a great deal. If the overlap factor climbs from 1.29 to 1.6 while blended ROAS is flat, your platforms are claiming more credit for the same business — usually a sign that spend has shifted toward retargeting and brand terms that harvest demand rather than create it. That single ratio catches a class of problem that no in-platform metric will ever surface. It sits comfortably alongside the small set of measures worth reporting up, which we lay out in ad Performance Metrics That Actually Matter.
What Is a Good ROAS? It Changes With Your Stage
Now the question everyone actually arrived for. What is a good ROAS is not answerable as a single number, but it is answerable as a rule: a good ROAS is the lowest ratio above your break-even that lets you buy as much profitable volume as you can handle. Chasing a higher ratio than that is usually a mistake, because ROAS and volume trade against each other.
This is the part that trips up disciplined operators. If your break-even is 2.5 and you are running at 6.0, that is not a triumph — it is a signal that you are underspending. You are almost certainly only capturing the cheapest, most in-market demand and leaving profitable volume on the table. Push spend up and ROAS will fall toward break-even while total gross profit rises. Total profit, not the ratio, is the thing you are optimising.
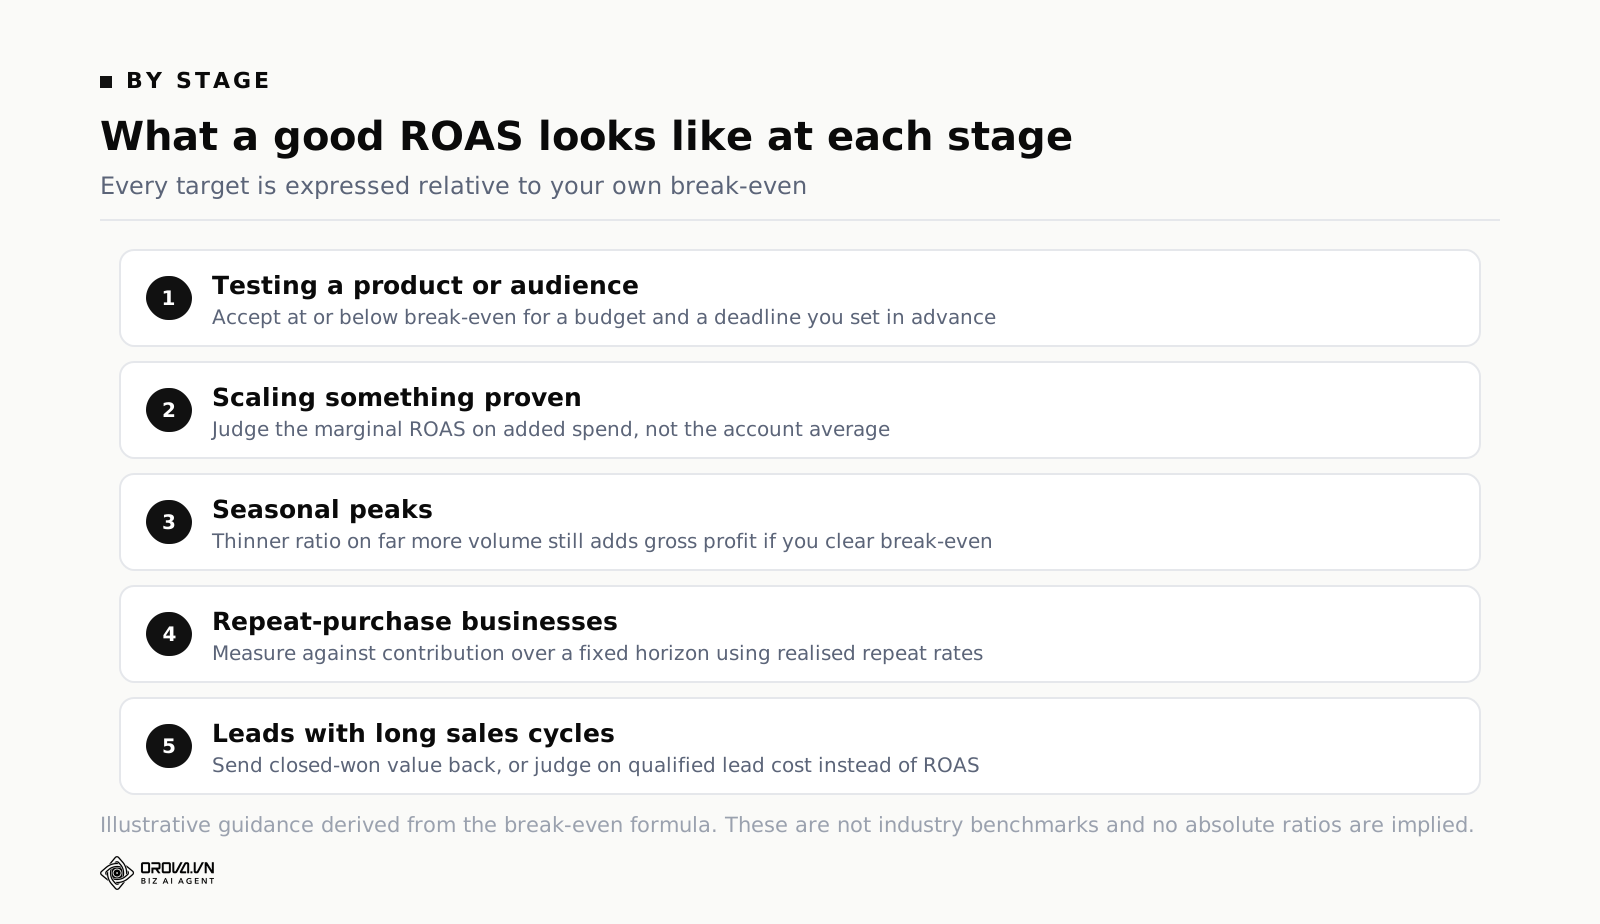
Beyond that, the appropriate target moves with what you are trying to do:
Testing a new product or a new audience
You are buying information, not profit. Accept a ROAS at or slightly below break-even for a defined budget and a defined number of days, decided in advance. Write down the stop condition before you start, because the temptation to extend a losing test "just one more week" is where test budgets go to die.
Scaling something already proven
Target somewhere between break-even and your current efficient level, and expect the ratio to fall as you spend more. Judge the increment, not the average: if raising spend by $2,000 produced $5,000 of extra revenue, the marginal ROAS on that increment is 2.5, regardless of what the account average says. Average ROAS hides the marginal reality, and the margin is where the decision lives.
Seasonal peaks
Auction prices rise for everyone at the same time, so the same campaign delivers a lower ROAS in peak weeks. If your break-even is 3.0 and peak trading pushes you to 3.1, you are still making money on every order — thinner, but on far more volume. Refusing to spend at peak because the ratio looks worse than October is a common and expensive error.
Businesses with repeat purchase
If a meaningful share of first-time buyers order again, first-order ROAS understates the value of acquisition. The honest version compares acquisition cost to contribution over a defined horizon — 90 days, 180 days, twelve months — rather than to the first transaction. Two disciplines are required: use a horizon short enough that you will actually collect the cash, and use realised repeat rates from your own history rather than an optimistic projection.
Lead generation and long sales cycles
When the sale closes weeks later in a CRM, platform ROAS is meaningless because the platform never sees the revenue. The only fix is to send the closed-won value back to the platform. Until that loop exists, judge lead campaigns on qualified lead cost and lead-to-close rate, and keep ROAS out of the conversation entirely rather than pretending a form fill is revenue.
Five Mistakes That Make ROAS Lie
Comparing ROAS across platforms as if it were one metric
Different attribution windows, different view-through rules, different conversion definitions. A 4.0 on one platform and a 4.0 on another are not equivalent, and reallocating budget from one to the other on that basis is guesswork wearing a spreadsheet. If you must compare, first force both to click-only attribution on the same window length, and accept that even then it is approximate.
Judging a period before its attribution window closes
Discussed above, and worth repeating because it is the most expensive habit on this list. Yesterday's ROAS is not a small version of last month's ROAS. It is a different, systematically pessimistic statistic.
Treating zero as "no data"
This one is worth flagging because it is a real defect I have seen in production systems, not a hypothetical. If a reporting layer treats a value of zero as missing, then a campaign that genuinely produced zero revenue gets dropped from averages instead of dragging them down. Your reported ROAS is then computed only over campaigns that converted. Every threshold and every alert built on top inherits the error, and the account looks healthier than it is at every level of the hierarchy.
Averaging ROAS across campaigns
Taking the arithmetic mean of campaign ROAS values gives equal weight to a campaign that spent $50 and one that spent $50,000. The correct method is always to sum all revenue, sum all spend, and divide once. Spreadsheet averages of ratio columns are wrong by construction, and they are everywhere.
Setting a target from someone else's benchmark
An industry-average ROAS figure tells you nothing, because it is an average of businesses with margins from 15% to 85%, different return rates, different attribution settings and different definitions of revenue. Your break-even is computable from your own accounts in fifteen minutes. Use that instead.
A Monthly ROAS Review You Can Actually Repeat
Consistency beats sophistication. The version below takes an hour or two per month and catches nearly everything that matters.
| Step | What you do | What it protects you from |
|---|---|---|
| 1 | Wait until the longest attribution window in use has fully closed after month end | Reporting an artificially low month and cutting budget on it |
| 2 | Export spend per platform for the exact calendar month, in one currency, no conversion | Mismatched date ranges and exchange-rate distortion |
| 3 | Export total business revenue for the same month from your order system, not from ad platforms | Double counting between platforms |
| 4 | Subtract refunds, cancellations and discounts to get net revenue | Counting money that never settled |
| 5 | Recompute contribution margin using this month's real shipping, fee and return costs | Using a stale margin from a year ago |
| 6 | Calculate break-even ROAS as 1 ÷ contribution margin | Judging performance against a borrowed benchmark |
| 7 | Calculate blended ROAS as net revenue ÷ total spend, and compare to break-even | Believing a platform figure that no bank statement supports |
| 8 | Record the overlap factor: platform-claimed revenue ÷ actual revenue | Missing a gradual drift toward demand harvesting |
| 9 | Only now open the platforms and rank campaigns on channel ROAS | Making optimisation decisions before the business question is settled |
| 10 | Write down every change you made and the date | Being unable to explain next month's movement |
Step ten looks like bureaucracy and is the most valuable line in the table. Without a change log, month-over-month movement is uninterpretable. You will end up attributing a swing to your new creative when it was actually a price change, a stockout, or a competitor's campaign ending.
Where Manual Work Ends and Tooling Starts
Everything above can be done with a spreadsheet, and for a single platform under a modest budget you should do exactly that. The manual approach breaks down at a predictable point: when the number of decisions per week exceeds the number of hours you have to make them carefully.
Three specific things get hard by hand. First, applying a consistent rule across hundreds of ad sets — "pause anything that has spent more than twice the target cost per acquisition with no conversion, but only after the attribution window has closed" is a sentence anyone can write and nobody can execute reliably across four hundred rows every morning. Second, keeping one definition of revenue across three platforms that each have their own defaults. Third, closing the loop between real revenue and the bidding algorithm, which needs a webhook from your order system rather than a report.
That last one is the highest-value piece and the one most often left undone. If the platform is optimising toward a purchase value that includes returns, tax and shipping, no amount of careful reporting on your side will change what it buys. The fix is to send the corrected value back. In Orova Ads each project gets its own webhook link so your CRM or order system can push real conversions back to the platform — the Meta Conversions API path is live today — and the same account holds a library of 214 optimisation action codes across Google, Meta and TikTok, split into advisory codes where the AI recommends and you act, and execution codes where it acts for you. Three operating modes exist for that reason: advisory, hybrid and automatic, with advisory as the default, because handing bid control to a system before you trust its numbers is how people lose months. Rules are written in plain sentences with data variables in braces, so "pause when spend exceeds twice target CPA and conversions equal zero" stays readable to the person who wrote it. The platform refuses to combine ad accounts billed in different currencies rather than converting them silently — an ugly restriction that exists because a wrong exchange rate corrupts every cost threshold downstream, and a blocked report is far cheaper than a confidently wrong one.
Whatever you use, the sequence does not change: define the metric, compute break-even from your own margin, verify the revenue against your bank, and only then automate. Automating a broken definition just produces wrong decisions faster.
Frequently Asked Questions
Is ROAS the same as ROI?
No. ROAS is revenue divided by ad spend and ignores the cost of the product. ROI is profit divided by total investment. A 3.0 ROAS on a product with a 20% margin is a loss; a 3.0 ROAS on a product with a 70% margin is a strong profit. ROAS is a speedometer, ROI is the destination. Use ROAS for day-to-day steering because it updates fast, and check ROI monthly to confirm the steering is heading somewhere good.
How do I calculate return on ad spend if I sell through a marketplace?
The method is identical, but marketplace commission is a per-order cost and must come out of your contribution margin before you compute break-even. A 15% commission on a product with a 40% gross margin leaves 25% contribution before shipping, which moves break-even ROAS from 2.5 to 4.0. Marketplace advertising also tends to report on shorter attribution windows than social platforms, so do not compare the two ratios directly.
Should I use a 7-day click or a 1-day click window?
Use whichever window matches how your customers actually buy, then keep it fixed. If your typical purchase decision takes a week, a 1-day window will systematically undercount and push you to underspend. The real discipline is not the choice, it is the consistency — changing the window mid-quarter makes every before-and-after comparison meaningless, and the change will not be visible on the chart.
Why does Google Analytics show a different ROAS from Google Ads?
Because they use different attribution models by default. Ads-side reporting credits the ad interaction within its conversion window; analytics platforms typically apply a cross-channel model that shares credit with organic, email and direct. Neither is broken. Pick one as the number of record for decisions, note the other as a sanity check, and never mix figures from both in the same table.
Is a higher ROAS always better?
No, and this catches good operators. A very high ROAS usually means you are spending too little and only harvesting demand that was already there. If your ratio sits far above break-even, increase spend deliberately and watch total gross profit rather than the ratio. As long as marginal profit stays positive, a falling ROAS with rising profit is the correct outcome.
How often should I recalculate break-even ROAS?
Quarterly at minimum, and immediately after any change to product cost, shipping rates, payment processing terms or return rates. Break-even drifts silently. Plenty of accounts are still measured against a target computed from a cost structure that stopped being true two years ago, which means the team is hitting a number that no longer corresponds to profit.
What to Do This Week
Three tasks, in order, none of which requires new software.
Monday. Open last month's profit and loss statement and compute contribution margin per order: revenue minus cost of goods, minus outbound shipping you absorb, minus payment fees, minus packaging and handling, minus the cost of returns. Divide one by that margin. That is your break-even ROAS, and it is probably higher than the target currently sitting in your bid strategy.
Wednesday. Add up the revenue every ad platform claimed for last month and divide it by the revenue your order system recorded. If the answer is meaningfully above 1.0, you now know how much of your reported performance is double counting, and you have a baseline to track from month to month.
Friday. Take five orders from your order system and trace them against the values your platforms recorded. Look for tax, shipping and pre-discount subtotals sneaking into conversion value. Fix whichever one you find, because that error repeats on every order, every day, and it is the cheapest correction available to you.
Do those three and the next time your ad manager reports a comfortable ratio you will know, within an hour, whether your bank account agrees.
Let the Numbers Reconcile Themselves
Doing this by hand every month is the real cost here. Pulling revenue from each platform, adjusting for refunds and fees, matching attribution windows to your billing period, and recalculating your break-even ROAS from your latest margins — none of it is hard on its own, but doing it correctly, every month, across every channel, eats hours you probably don't have.
Orova Ads is built to take that reconciliation work off your plate, pulling spend and revenue across your ad platforms and lining it up against your real numbers so you are not doing this math by hand every Monday. If you are tired of guessing whether last month's "good ROAS" actually made you money, it's worth taking a look.
Let AI check ROAS on every campaign, daily
Orova Ads reads your Google, Meta and TikTok numbers each day and flags the campaigns losing money, with the reasoning attached.
Start for free