
Lost impression share: budget problem or rank problem
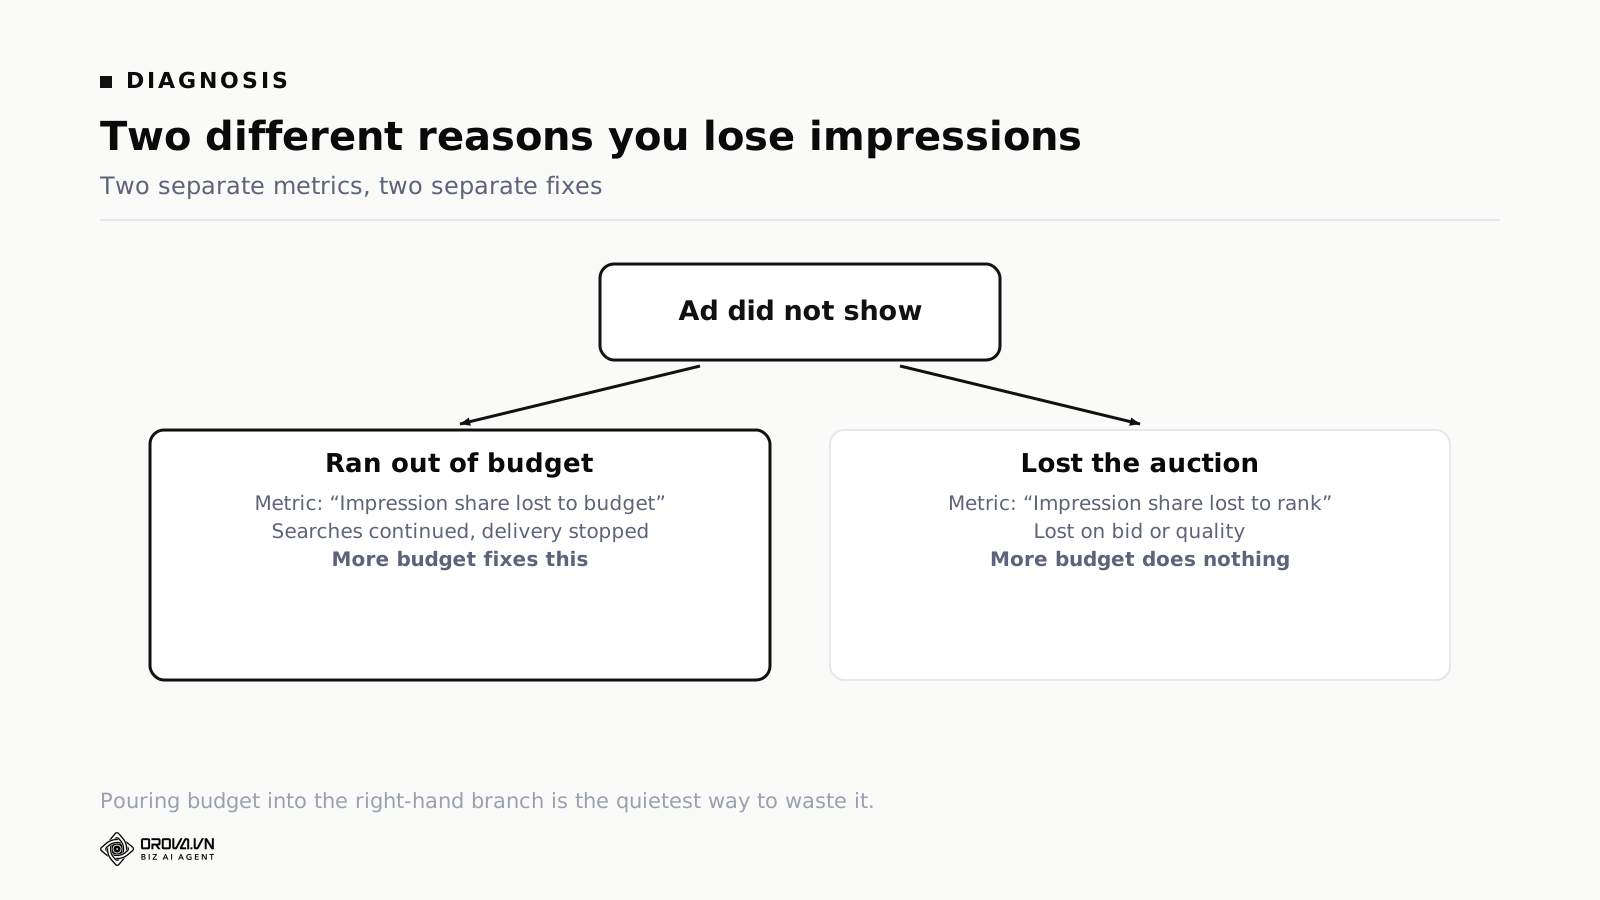
Lost impression share is the share of times your ad could have shown and did not. It has two separate causes, and Google Ads reports them as two separate columns: lost to budget, meaning you ran out of money for the day, and lost to rank, meaning you entered the auction and lost it.
Only the first is fixable with money. Raising a budget against rank loss buys you entries into auctions you keep losing, and it produces the pattern most accounts eventually run into: spend up thirty percent, conversions roughly flat, and nobody able to explain it.
This article shows you how to read both columns together, what the four possible readings mean, what each one is worth in money, and the ten-minute audit that tells you which situation your own account is in.
What happens in the auction, and why there are two kinds of loss
Someone types a query. Google runs an auction in milliseconds. Every advertiser with a matching keyword is eligible to enter, there are only a few slots, and entrants are ranked on bid and on quality together: ad relevance, landing page experience, expected click-through rate.
That leaves two distinct ways not to appear.
You were not in the auction. You had already spent the daily budget. An advertiser out of money is not entered at all. You did not lose on merit. You lost by absence.
You entered and lost. You participated and ranked below the threshold for display. Possibly a low bid, possibly weak quality, usually both.
Those leave different traces, and Google separates them. The difficulty is that the default view shows the combined figure, and the combined figure is the one that leads people to the wrong action.
Where the two columns are, and how to add them
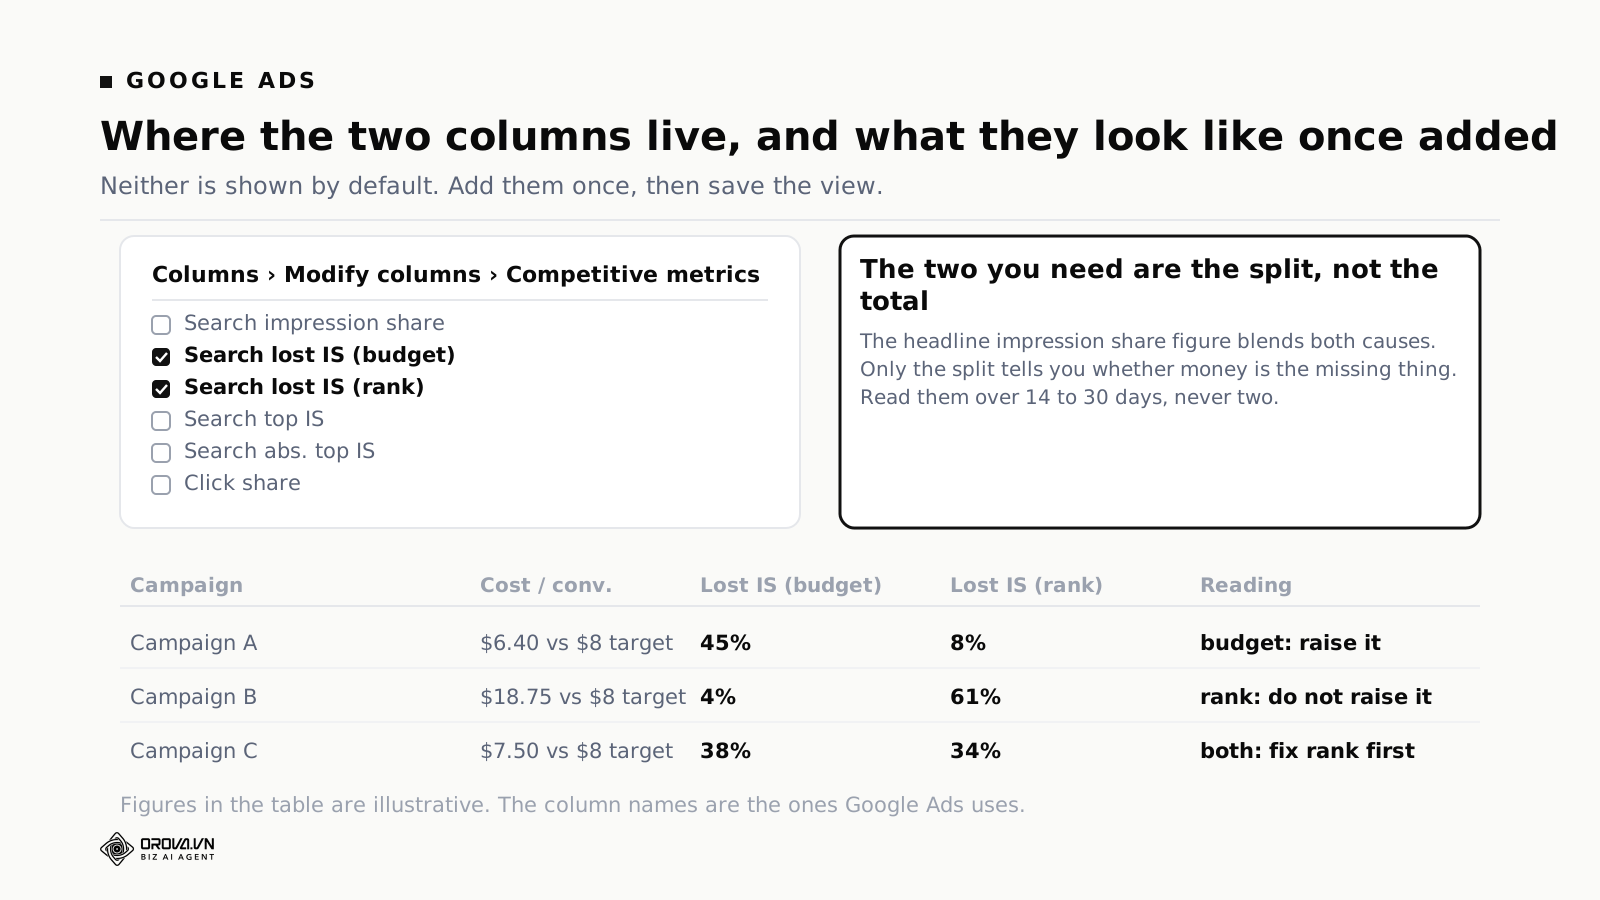
In the campaigns table, open Columns, then Modify columns, then the Competitive metrics group. The two you want are Search lost IS (budget) and Search lost IS (rank).
Add cost per conversion alongside them, then save the view. Saving matters more than it sounds. Rebuilding columns every time is exactly the friction that stops this check from happening twice.
Read them over fourteen to thirty days. Competitive metrics swing hard day to day, because they depend on what your competitors did as much as on what you did, and two days of data will send you somewhere expensive.
Read both columns and four cases appear
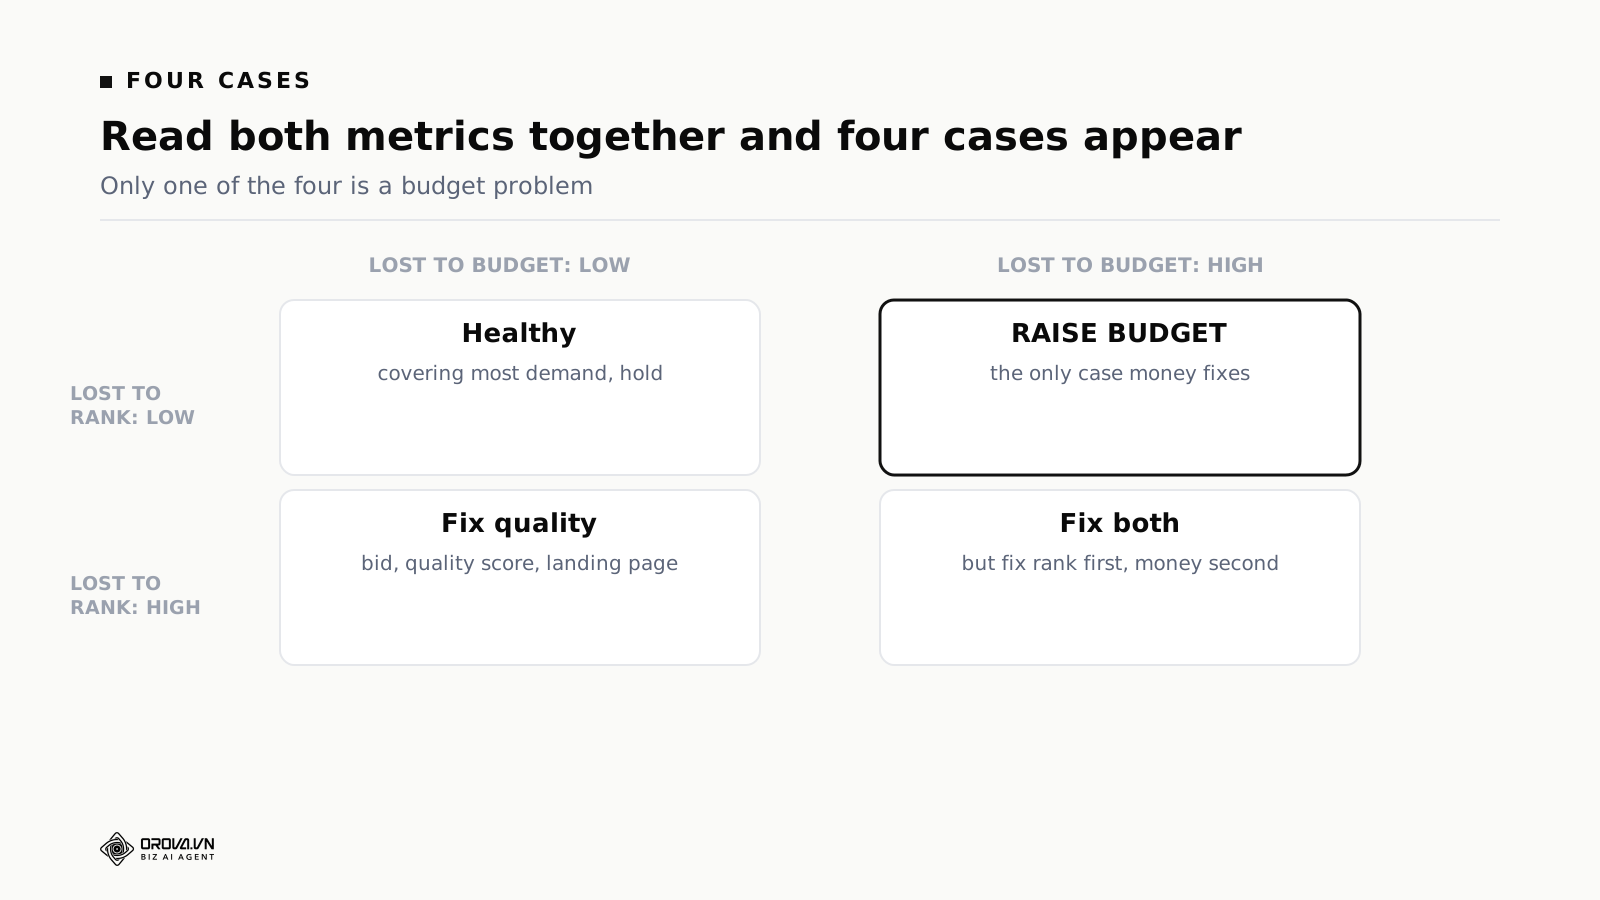
Low budget loss, low rank loss. The campaign is covering most of the available demand. The action is no action, or widening keyword coverage if you want more volume.
High budget loss, low rank loss. The only case money fixes. You win the auction nearly every time you enter, you just do not enter often enough. Raising budget here reliably buys more results at comparable cost.
Low budget loss, high rank loss. You have money, you enter fully, and you lose. Raising budget does nothing, because you were not spending what you already had. The work is on the quality side: bids, ad relevance to keyword, landing page.
Both high. You run out of money and lose when you are present. This sounds like fix both, and it is, but the order matters. Fix rank first, money second. Raise the budget first and you are paying to enter more auctions you continue to lose.
This grid depends on no particular software. Two columns in a report and you have it.
Why the budget reflex is so common
Three reasons, all human.
The combined number is the one on screen. Default views show a single impression share figure. The two detail columns have to be added by hand. Whatever is visible is what gets acted on.
Raising budget is the easiest action available. Improving quality means rewriting ads, restructuring keyword groups, sometimes changing landing pages. Days of work involving several people. Dragging a budget slider takes three seconds, and under pressure people choose what they can finish.
Raising budget almost always produces some result. Even against rank loss, extra money buys a few more impressions in auctions you narrowly lost. It never looks like outright failure. It just costs far more per result than it should, and mistakes that throw no error are the ones that survive longest.
Four things to check before you raise anything
Even when the reading is clearly budget-constrained, four gates are worth applying. They look obvious written down, which is exactly why they get skipped in the moment, particularly when you are looking at a capped campaign and thinking about the revenue you are missing.
Is the campaign profitable? Being budget-constrained on a losing campaign means raising the budget loses money faster. Cost per result has to be inside target before more money is a good idea.
Is there enough data? An impression share figure drawn from three days and a few dozen impressions is not trustworthy. Fourteen days minimum, thirty if volume is modest.
Did anything change recently? A bid strategy switch, a large keyword addition, or a budget edit mid-window makes the number an average of two different worlds. Wait, or shorten the window.
How much, and what is the ceiling? Decide the size before you open the account. A useful default is no more than 15% at a time, no more often than every three days, with a written ceiling you do not exceed without a separate conversation.
That cadence exists for a reason. A large jump changes delivery enough that the campaign effectively re-learns, and you lose the ability to tell whether the increase worked or the reset did. Smaller steps with a week between them are slower and far easier to read.
When the loss is to rank: what to actually do
Losing on rank means losing on bid or on quality. Between the two, quality is the better investment, because improving it also lowers your cost per click, while raising bids simply buys position with money.
Check keyword-to-ad relevance. If an ad group holds twenty keywords spanning different themes, no single ad can be relevant to all of them. Splitting into tighter groups is tedious and it works.
Check the landing page. Someone searching "oak dining table six seats" who lands on your homepage has a poor experience, and Google scores that. Send them to the product page.
Check expected click-through rate. If your ad is generic while competitors state price, offer and delivery time, you lose this component in every auction, consistently.
Those three are the components behind Quality Score, and you can add them as columns at keyword level: Ad relevance, Landing page experience, Expected CTR. Each reads as below average, average or above average, which is coarse but enough to tell you which of the three is dragging.
Only when those are sound should you raise bids. It is the fastest lever available and the most expensive one.
Auction Insights tells you who took the impressions
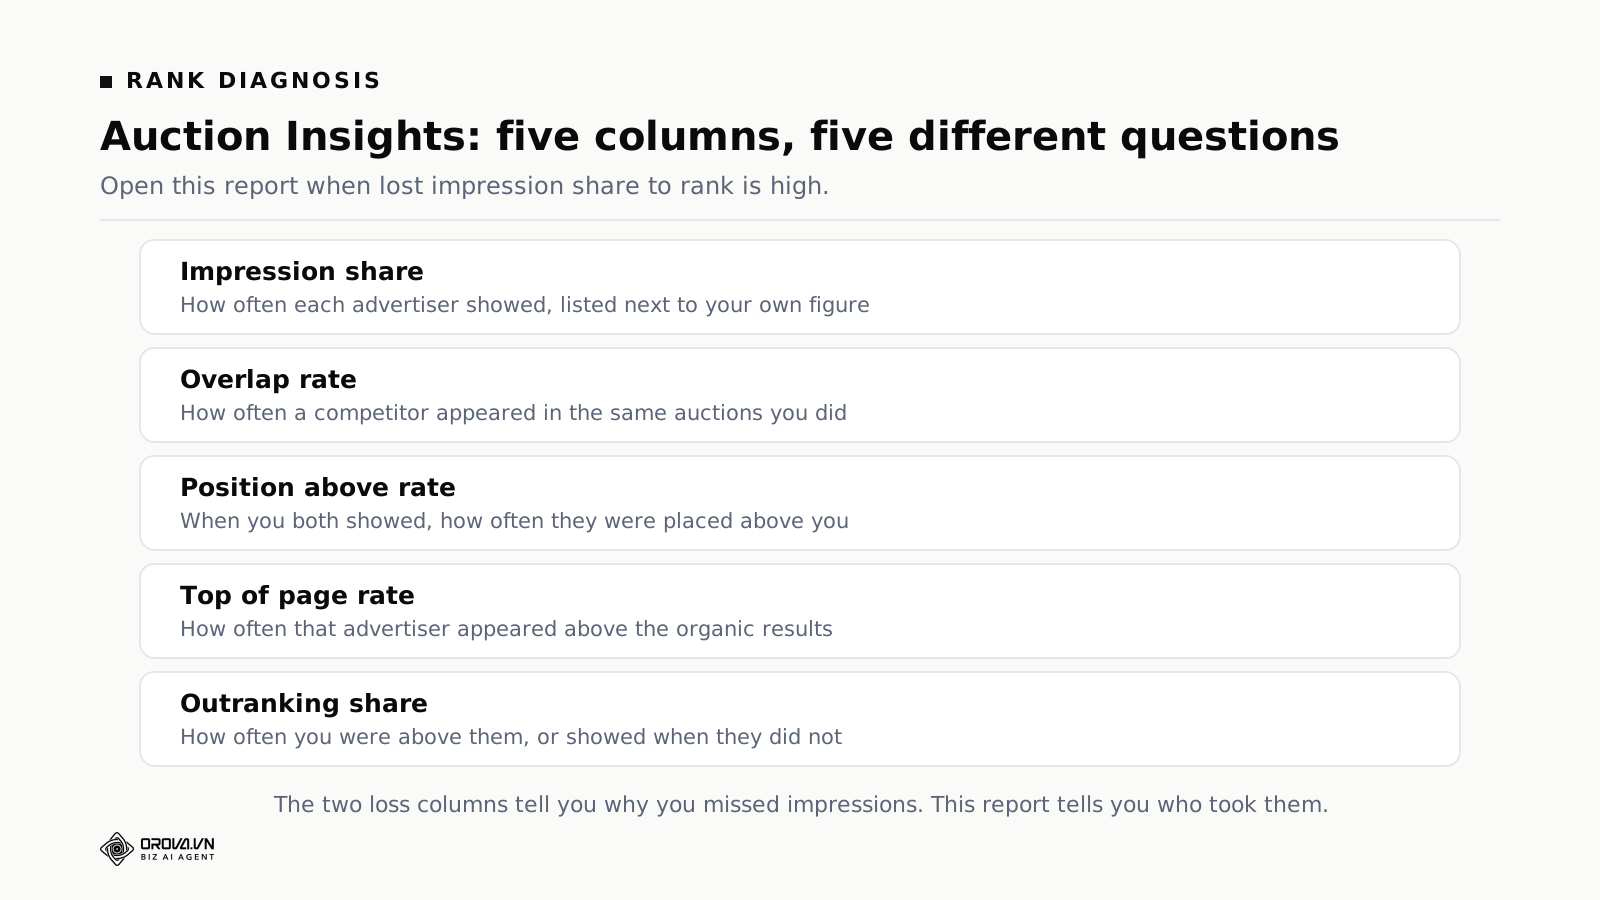
When rank loss is high, the two loss columns have told you everything they can. Auction Insights, available at campaign, ad group and keyword level, tells you the rest.
Impression share for each competing advertiser, listed next to your own. This is the fastest way to see whether one advertiser dominates or whether the auction is crowded.
Overlap rate. How often a given competitor appeared in the same auctions you did. A high overlap rate with an advertiser you did not consider a competitor is worth knowing on its own.
Position above rate. When you both showed, how often they were placed above you. This is the number that tells you whether you are losing narrowly or comprehensively.
Top of page rate and absolute top of page rate. How often that advertiser appeared above the organic results, and how often they were the first ad on the page.
Outranking share. How often you appeared above them, or showed when they did not show at all.
One reading is worth learning to spot. If a competitor's overlap rate with you is high and their position above rate is also high, they are outbidding or outranking you in the auctions you both care about most. If overlap is low but their impression share is high, you are competing for different queries and the fix is keyword coverage rather than bids.
The other competitive metrics worth reading
The two loss metrics sit inside a wider group, and the rest answer different questions.
Impression share. The percentage of eligible impressions you actually received. The two loss metrics are its missing portion, split by cause.
Top impression share. Of the times you appeared, how often you were above the organic results. This matters in categories where people click early and rarely scroll. Appearing often but always at the bottom produces a flattering impression share and disappointing clicks.
Absolute top impression share. How often you were the very first ad. On your own brand terms this should be high. When it is low, a competitor is bidding on your name and winning.
Used together: impression share tells you coverage, the loss metrics tell you the cause, and the position metrics tell you the quality of the coverage you have.
One combination is worth memorising. High rank loss alongside low top impression share is almost always a quality problem rather than a bid problem. A pure bid shortfall still shows you consistently, in lower positions. Weak quality shows you rarely and badly placed.
What being budget-constrained is worth, in numbers
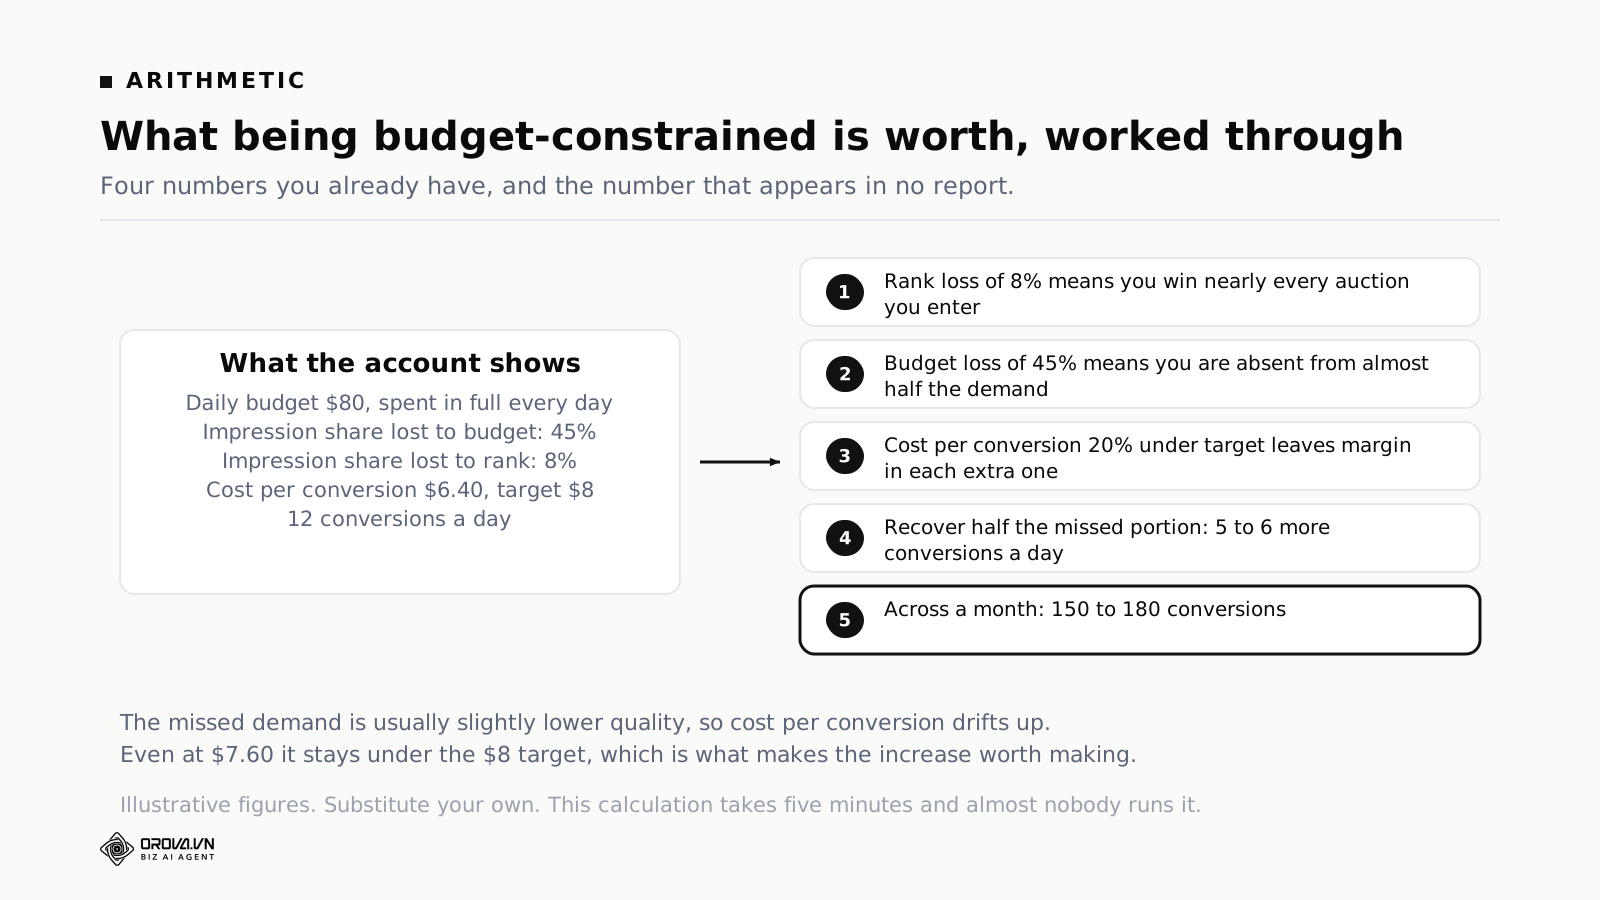
"Leaving money on the table" is abstract until you put figures against it. These are illustrative. Substitute your own.
Daily budget $80, fully spent every day. Impression share lost to budget 45%. Lost to rank 8%. Cost per conversion $6.40 against an $8 target. Twelve conversions a day.
Rank loss of 8% means you win nearly every auction you enter. Budget loss of 45% means you are absent from almost half the available demand. Cost per conversion twenty percent below target means each additional conversion still has margin in it.
Recovering the budget-lost portion would in theory reach roughly 45% more demand. Reality is not linear. The missed demand is usually slightly lower quality, so cost per conversion drifts up. Even if it rose from $6.40 to $7.60, it stays under target, which is what makes the increase worth making.
Estimating conservatively that you recover half the missed portion: five to six additional conversions a day, or 150 to 180 across a month. That figure appears in no report, because reports record what happened rather than what could have.
The calculation takes five minutes and almost nobody performs it. Not because it is difficult, but because you have to go looking for it, while everything else in the interface arrives unbidden.
Six situations where these numbers mislead
Each of these takes under a minute to rule out, and each of them produces a confident wrong conclusion if you skip it.
Shared budgets. If several campaigns draw on one shared budget, per-campaign budget loss is misleading. This campaign ran dry because that one spent first. Analyse at the shared budget level instead, or split them.
Automated bidding constraints. Under Target CPA or Target ROAS, the system may deliberately limit delivery to protect the target. The resulting lost share is not losing on rank in the ordinary sense. The bidding engine is declining auctions it considers too expensive. Raising the budget does not address that. Reconsidering the target might.
Too short a window. Fourteen days minimum, thirty if volume is modest. Competitive metrics swing hard day to day because they depend on competitor behaviour as much as your own, and reading two days is the most reliable way to chase noise.
Something changed inside the window. A budget edit, a bid strategy switch, or a large keyword addition mid-window makes the figure an average of two different periods. Either shorten the window or wait for a clean one.
Campaign types compared against each other. Search, Shopping and Performance Max report impression share differently. Comparing across types produces conclusions that feel insightful and are not.
A segment that is not homogeneous. One campaign holding brand and generic terms, or several countries, or wildly different products, produces an average that describes nothing real. Brand terms usually sit near full coverage while generic terms lose heavily, so the blended figure looks unremarkable while half of it needs attention.
The habit underneath all six: whenever you read a metric, ask what it is averaging together. Averages are always more comfortable than the underlying spread.
This applies to the level you read at as well. These metrics report at campaign and at ad group level, and the ad group view is usually more actionable. A campaign averaging 25% rank loss might contain one ad group at 80% and four at 5%. Fixing the one is a contained job. "Fixing the campaign" is not a job anybody can start.
The opposite mistake: not raising when you should
This article has spent most of its length on raising budget in the wrong place. The reverse also costs money, and it is harder to see.
A campaign that is budget-constrained with strong cost per conversion, holding the same budget month after month, is losing revenue steadily. Nobody notices, because no report contains a line called "revenue you did not earn".
The cause is usually organisational. The budget was set in January, changing it requires justification, and justification is friction. Or a previous increase went badly, so now there is caution.
The remedy is turning it from a decision into a written rule. Once "if budget-constrained and cost per result is under target, raise by at most 15%, no more than every three days" exists on paper, raising is no longer a debate. It is a pre-agreed response, and the argument happens once rather than every month.
Three situations you will actually meet
A competitor starts bidding on your brand
You run your own brand terms. Cheap clicks, strong conversion, everything comfortable. Then absolute top impression share drops from 90% to 60%.
The cause is almost always a competitor bidding on your name, which is legal and extremely common.
Resist raising budget. Brand campaigns rarely show meaningful budget loss, so this is a rank issue. Your quality on your own brand terms is structurally far better than theirs, because someone searching your name finds your page most relevant, so a modest bid increase on the brand group usually reclaims position while still costing you less per click than it costs them. Auction Insights on the brand ad group will name who it is.
Weekend demand against a flat daily budget
Many service categories concentrate demand at weekends: home repair, photography, short-break travel. A flat daily budget exhausts by mid-morning on Saturday and goes unspent on Tuesday.
The weekly average shows moderate budget loss. The daily view shows seventy or eighty percent on two days.
The fix is distribution rather than total. Use ad scheduling to weight budget toward the days that carry the demand. Same total spend, materially different outcome. This is also why you read these columns across a date range and then segment by day, rather than trusting a blended average that conceals precisely this shape of problem.
A new account where everything looks bad
Two weeks live, rank loss at 70%, quality scores low, cost per click high. The instinct is alarm.
Mostly this is normal. Google has no click history for your ads, so expected click-through rate is scored conservatively. After a few weeks of real data it usually improves on its own if the ads are decent.
The work in this period is not throwing money at it or changing bids repeatedly. It is leaving it alone long enough to accumulate history while doing the things that are unambiguously correct: tight keyword grouping, ads that mirror the keyword, correct landing pages.
How to size the increase, and how to read the result
Deciding that a campaign is budget-constrained is the easy half. Deciding by how much, and knowing afterwards whether it worked, is where the money is either made or wasted.
Size it before you open the account. Decide the step and the ceiling while you are still looking at the report, not while you are looking at the budget field. Fifteen percent is a sensible default step. Doubling a budget is not a bigger version of the same decision, it is a different decision, because delivery changes enough that the campaign effectively re-learns.
Wait a full week before reading anything. The first few days after an increase are redistribution rather than result. Three-day readings are the most common way to talk yourself out of a correct decision.
Read three numbers at the end of the week. Did spend actually rise, or is the campaign still not using what it now has? Did budget loss fall by roughly what you added? Did cost per result stay inside target?
Those three answers cover every outcome worth acting on. Spend flat means the constraint was never budget. Budget loss barely moved while spend rose means the extra money went into the same auctions at higher cost, which points at the bid strategy rather than at demand. Cost per result outside target means you have found the edge of profitable demand, and that is the signal to stop rather than to keep stepping.
Change one thing at a time. If you raise the budget and adjust the target CPA in the same week, you will not know which one moved the numbers. This is the most common reason a good diagnosis produces an inconclusive quarter.
A ten-minute audit of your own account
Open Google Ads and follow along.
Step one. Go to Campaigns and set the date range to the last thirty days.
Step two. Add the two columns: Search lost IS (budget) and Search lost IS (rank), from the competitive metrics group. Add cost per conversion if it is not already there.
Step three. Sort by the budget column, descending. Campaigns at the top with cost per result inside target are where you are leaving money on the table. This is usually the fastest win available in the account.
Step four. Sort by the rank column. Campaigns at the top of this list are where you should not add money, however loudly the combined figure complains. Open Auction Insights on the top two.
Step five. Compare both lists against campaigns whose budgets you raised in the last three months. Any campaign appearing in the step-four list that received more money is a quiet cost you have just found.
Step six. Drop to ad group level on the worst two campaigns in each list. The campaign figure is an average, and the ad group figures tell you where the actual work is.
No software required. What is required is repetition, which is the part that fails.
Making the check survive a busy quarter
Competitive metrics shift when rivals change bids, when seasonality arrives, when you add keywords. One audit is true for the week you ran it. Three approaches, in increasing order of durability.
The saved view. Build a campaign view with the two loss columns, cost per result and spend, then save it. This removes the friction of rebuilding columns each time, which sounds trivial and is the difference between doing it and not. Five minutes, once.
The calendar entry. A recurring thirty-minute slot, same time each week, with the saved view linked in the invitation. It works considerably better than intention, because the analysis now has a defended place instead of competing with whatever is urgent.
An automated flag. Something that surfaces the constrained-and-profitable campaigns without anybody opening a report. This is the only version that survives holidays, staff changes and busy months, because it requires no human to remember.
Be clear about what the third option does. It does not make better decisions than you would. It makes the same decisions, on schedule, when you are not looking. For a diagnostic that only pays off through repetition, that is the whole value.
If you set thresholds for it, reasonable starting points are: flag when budget loss over fourteen days is above 20%, rank loss is below 15%, and cost per result is inside target. Suppress the flag entirely when rank loss is above 30%, because that is the situation where a budget increase is the wrong answer no matter how constrained the campaign looks.
How this translates to Meta and TikTok
The two separated metrics are specific to Google Search. Meta and TikTok have no direct equivalent, because Google Search runs an auction tied to a specific query, so the number of auctions you could have entered is countable. A feed has no equivalent notion of "the auction for this keyword".
The principle still holds and the symptoms differ.
On Meta, the equivalent of budget constraint usually shows as a campaign exhausting its daily budget early in the day while cost per result stays healthy. The equivalent of losing on rank shows as rising cost per thousand impressions alongside rising frequency: you are paying more to talk to the same people, who have already heard it.
On TikTok, the pace is faster so the signals arrive earlier. A tiring ad typically shows falling completion rate before cost rises.
Across all three, the same question comes first. Before adding money, establish whether money is the thing that is missing.
A short glossary, because the names are confusing
Eligible impressions. The number of times your ad could have been shown, given your keywords, targeting and schedule. It is an estimate produced by the platform, not a count you can verify independently. Treat it as directionally useful rather than precise.
Impression share. Impressions you received divided by eligible impressions. A campaign at 100% is appearing every time it could, which usually means either very narrow targeting or very generous budget.
Lost to budget. The share of eligible impressions missed specifically because delivery stopped for lack of funds. The only component that money reliably converts into impressions.
Lost to rank. The share missed because you entered and placed below the display threshold. Two inputs: your bid, and your quality relative to competitors.
That last clause deserves emphasis. Rank loss can worsen without you changing anything, simply because a competitor became more aggressive or improved their ads. A rising rank-loss figure is not automatically evidence that something in your account degraded. It may be evidence that someone else's improved. Checking whether your own quality columns moved separates those two cases, and it is worth doing before you start rewriting perfectly good ads.
Frequently asked questions
What level of lost impression share should worry me?
There is no universal number, because it depends on category and competition. What matters is the ratio between the two types rather than the absolute figure. Losing 70% almost entirely to budget on a profitable campaign is an opportunity. Losing 30% entirely to rank is a quality problem that needs work.
Does a high impression share mean I am doing well?
Not on its own. A campaign at 95% impression share may simply have targeting narrow enough that there is very little demand to miss. High share on a small pool is not better than moderate share on a large one, and accounts sometimes celebrate the first while ignoring that the pool itself is the constraint.
Why does this metric exist on Google but not Meta?
Different models. Google Search runs an auction tied to a specific query, so the number of auctions you could have entered is countable. Meta distributes through a feed, where there is no equivalent unit to count.
How long after raising budget will I know if it worked?
At least seven days, because the first few days involve redistribution. Reading three days and concluding is the most common way to sabotage a correct decision.
What if I am budget-constrained but do not want to spend more?
Entirely reasonable, and there are two options. Tighten keyword coverage so the existing budget concentrates on the highest-value subset, or use ad scheduling to weight spend toward the hours and days that convert best. Both raise efficiency without raising spend.
Do Performance Max campaigns report this?
Less granularly, because Performance Max spans multiple networks and the notion of a keyword-level auction breaks down. For those campaigns, a more reliable constraint signal is the daily budget being exhausted consistently while cost per result stays inside target.
Should I fix rank loss before adding budget, always?
As a default, yes, because budget added to a rank problem buys entries into auctions you continue to lose. The exception is when rank loss is moderate and your cost per result is comfortably inside target. There, the auctions you do win are profitable enough that entering more of them still pays, even at a lower win rate. The judgement hinges on your margin, which is why no rule decides it for you.
Why did my rank loss rise when I changed nothing?
Because rank is relative. A competitor raising bids or improving their ads moves your figure without anything in your account changing. Check whether your Quality Score components moved. If they did not, the change is external, and the decision is whether the auction is still worth what it now costs.
Can I see this at keyword level?
Yes for search impression share and the rank loss column, and it is often where the real answer is. Budget loss reports at campaign level, since budgets are set there. When a campaign shows high rank loss, sorting keywords by their own rank loss usually finds a small group carrying the whole average.
Where this leaves you
Go back to the advertiser who raised budget, spent thirty percent more and gained nothing. Nothing foolish happened. They responded to the only number the interface put in front of them.
The lesson is not "do not raise budgets". It is that before adding money you separate whether you are short of money or short of quality. Two problems, two treatments, and the wrong prescription leaves the problem untouched while the spend goes up.
One caution before you act. The temptation after reading this is to fix every constrained campaign in one afternoon. Raise two or three instead, and see what the recovered demand converts at, because the missed portion is not identical to the portion you were already capturing and the difference only shows up after the fact.
Related reading: spend guardrails and caps, allocating budget across platforms, and pairing smart bidding with broad match.
If you would rather have this checked every week than remember to do it, Orova runs the check and flags only the campaigns where money is the missing thing.
Orova Ads optimises campaigns for you
Connect Google, Meta and TikTok in one place. AI reads the numbers, proposes changes and executes under the rules you set.
Explore Orova Ads