
How to Measure Marketing Campaign Success Beyond Vanity Metrics
The campaign wrapped last Friday, and by Monday the wrap deck is already sitting in the channel: reach up, impressions in the millions, engagement rate above the account average, a screenshot of a comment that says "love this." Sixteen slides in, and somewhere around slide eleven the finance director asks the one question everyone outside marketing actually cares about — was it worth running? — and the room goes quiet, because nothing in the deck was built to answer that. This is the real problem behind how to measure marketing campaign success: most teams have plenty of activity numbers and no answer to whether the campaign changed anything that mattered.
The old approach fails because it measures effort instead of effect. Reach, impressions and engagement tell you the campaign happened and that people noticed it, but they say nothing about what would have happened anyway without it, or whether the result showed up too early, too late, or in a different channel that got the credit. Worse, this gap can be expensive at scale — ANA Programmatic Transparency Study found that roughly a quarter of programmatic ad spend is wasted on inefficient buying and invalid impressions, waste that a vanity-metrics deck will never surface.
This article gives you a plan you can set up before you launch, so the wrap deck writes itself instead of getting picked apart. You'll get a clear order of steps to follow, a way to handle results that show up late or bleed into other channels, a breakdown by campaign type, a full worked example, a list of metrics worth dropping from every report, and a one-page plan you can fill in before you spend a dollar.
What Does It Mean to Measure Marketing Campaign Success?
Measuring campaign success means comparing one pre-declared outcome against a baseline you set before launch, inside a window you fixed in advance, and deciding whether the difference is large enough to change a decision. If no decision depends on the answer, and no baseline exists, you are reporting activity rather than measuring success.
Read that definition again and notice how much of it happens before the campaign runs. Three of the four elements — the outcome, the baseline, the window — have to exist on day zero. Only the comparison happens at the end. Most measurement failures are not analysis failures. They are planning failures that only become visible at analysis time.
The word "success" is doing quiet work in that sentence too. Success is not a property of the campaign. It is a property of the decision the campaign was funded to serve. A campaign that generated a modest number of leads at a mediocre cost is a failure if you funded it to prove a new channel could scale, and a success if you funded it to keep a warm audience from going cold while the product team shipped a fix. Same numbers, opposite verdicts, because the decisions differed.
This is why "did the campaign do well?" is an unanswerable question and nobody should accept it as a brief. The answerable version always contains a decision: should we run this again next quarter, should we move budget from channel A to channel B, should we keep the agency, should we build the landing page properly or keep the quick one. Each of those needs a different measurement, and some of them need a measurement you cannot construct after the fact.
Why Reach, Impressions and Engagement Cannot Settle It
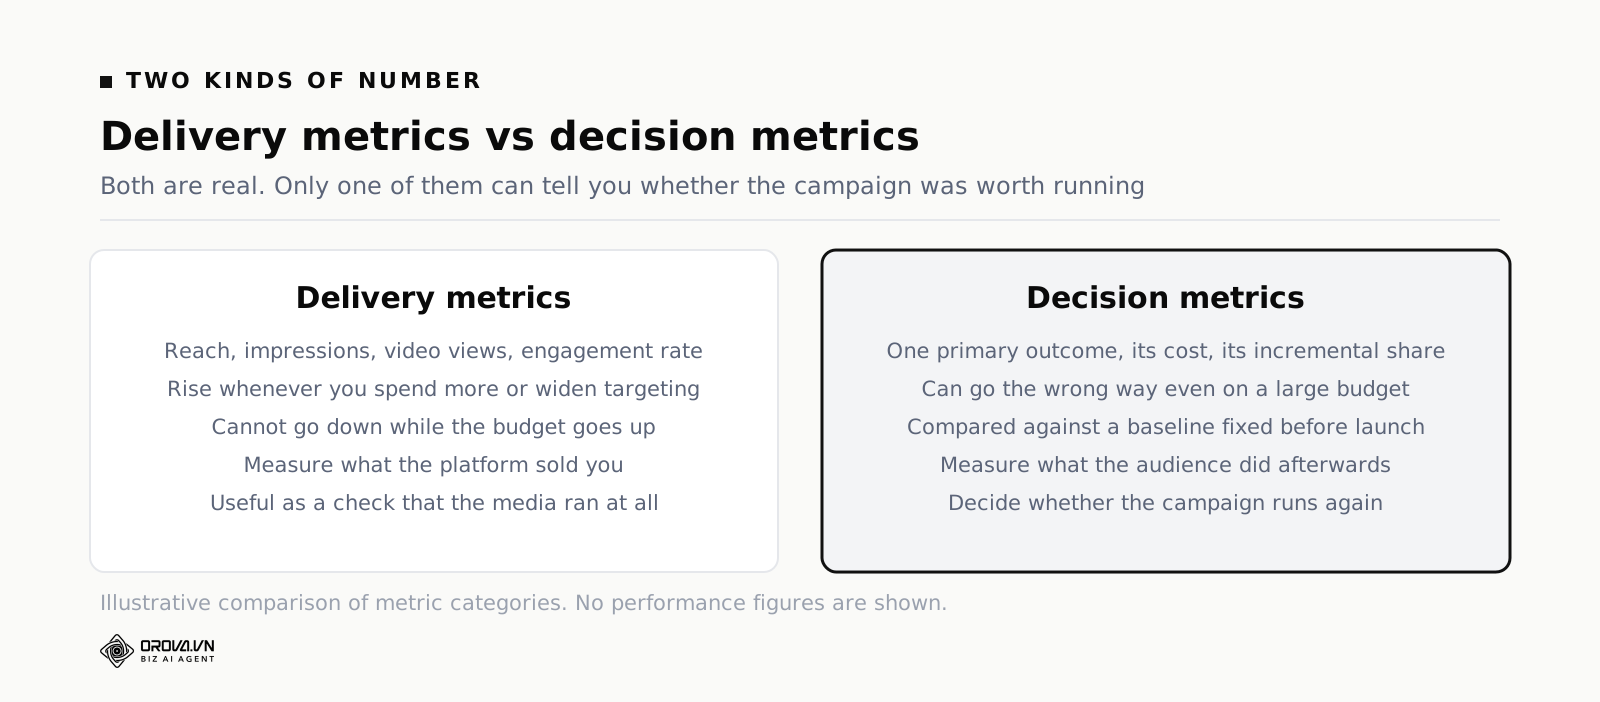
The wrap deck was not dishonest. Reach really was up. The problem is that reach cannot lose. Buy more media and reach goes up. Widen the targeting and reach goes up. Run in a cheaper country and reach goes up a lot. A metric that only moves in one direction when you spend money is not a measurement, it is a receipt.
The same applies to impressions, video views, engagement counts, follower growth and the ever-popular "estimated media value". They share one property: they measure what the platform delivered in exchange for the money, not what the audience did afterwards. Delivery is real and worth checking — if impressions collapsed halfway through, you have a delivery problem to fix — but delivery is a diagnostic, not a result.
Engagement rate deserves a specific warning because it wears a disguise. It looks like an audience-response metric, which makes it feel more legitimate than raw reach. But engagement rate is a ratio of two numbers you also control through targeting, and it is systematically higher for content that provokes a reaction than for content that provokes a purchase. Campaigns optimised toward engagement drift toward material that is fun to react to and easy to forget. We have written about that trap in more depth in best SEO Keyword Research Tools (Free and Paid Compared), and it is worth reading alongside this one, because most measurement frameworks fail not because the framework is wrong but because the old metrics are never actually retired.
There is a fair objection here, and it should be answered rather than dismissed. Some campaigns genuinely are not supposed to produce a measurable near-term outcome. A category-education campaign, a recruitment brand push, a repositioning ahead of a product launch — none of these should be judged on last-click conversions. That is a real argument, and it is exactly why the framework below starts with the decision rather than the metric. What it is not is a licence to report reach and call the job done. Even the softest campaign has an outcome you could have measured if you had set it up in advance: prompted awareness in a defined audience, share of branded search volume, direct traffic in the target region, opt-in rate on a mailing list, application volume from the target university. Pick one. Measure it before and after. Do not substitute reach because the real outcome is inconvenient.
How to Measure Marketing Campaign Success: The Framework in Order
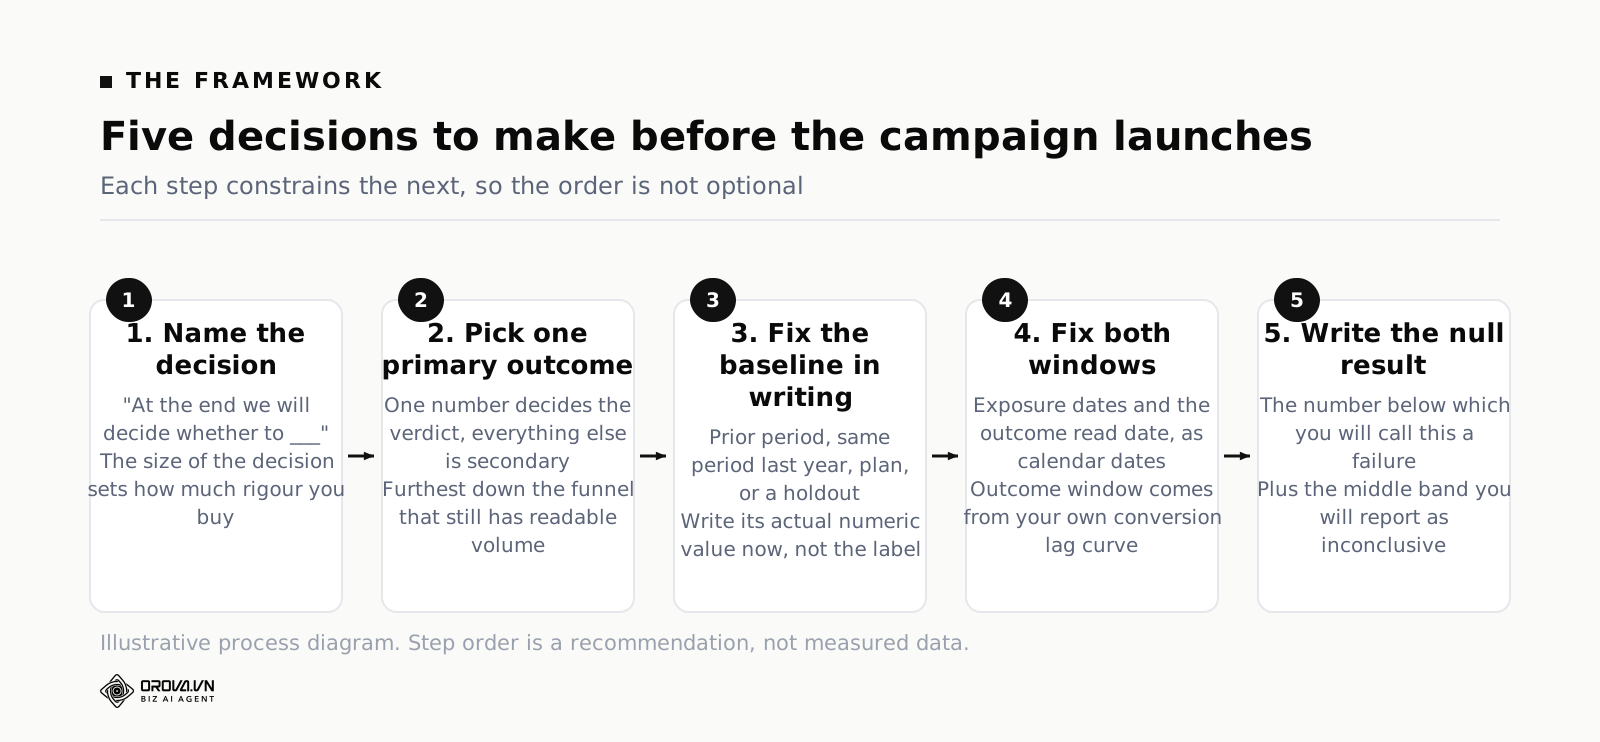
Six steps, and the order is not decorative. Each one constrains the next. Doing them out of sequence is how teams end up with a beautiful dashboard measuring something nobody needed to know.
Step one: name the decision before you name the metric
Write one sentence in this shape: "At the end of this campaign we will decide whether to ____, and the thing that will decide it is ____." If you cannot complete the first blank, stop. A campaign with no attached decision does not need measurement, it needs a reason to exist.
The decision also sets the precision you need, which is a mercy. If the decision is "do we renew a small always-on budget", you need to know whether performance is roughly at target, and a simple before-and-after read is enough. If the decision is "do we shift half the annual budget into this channel", you need something much stronger, possibly a geographic holdout, and you need to plan that before launch because you cannot retrofit a control group.
Precision costs money and time. Matching precision to the size of the decision is one of the few free efficiencies in this whole discipline. Nobody needs a rigorously designed incrementality test to decide whether to keep spending a small monthly budget on a retargeting campaign that has run profitably for two years.
Step two: pick exactly one primary outcome
One. Not a scorecard of six, not a weighted index. One number that, if it moves the right way, means the campaign worked, and if it does not, means the campaign did not.
Teams resist this fiercely and the resistance is always the same argument: our campaign has multiple goals. It usually does not. It usually has one goal and several things people would also like to happen. Those go in the secondary list, they get reported, and they do not get a vote in the verdict. The moment two metrics can both decide the outcome, you have guaranteed that every campaign is a partial success, because at least one of them will have gone up.
Choose the outcome closest to money that you can measure reliably inside the window. Those two constraints fight each other and the fight is the actual work. Revenue is closest to money and often arrives too late. Qualified leads are earlier and require the sales team to define "qualified" and apply it consistently. Form fills are immediate and easy to inflate with bad traffic. Pick the furthest-down-the-funnel metric that still produces enough volume to read, and if the honest answer is that nothing downstream produces readable volume, say so in the plan rather than quietly falling back on clicks. Choosing this number well is the same problem as choosing an account-level guiding metric, and ad Performance Metrics That Actually Matter covers the selection criteria in more detail than there is room for here.
Step three: set the baseline before launch, in writing
A result with no baseline is a number, not a finding. "We got 340 leads" means nothing until somebody says what 340 is being compared against, and the comparison must be chosen before you see the result, because afterwards you will pick whichever baseline flatters the outcome. Everyone does this. It is not dishonesty, it is how human beings read numbers.
You have four realistic options. The previous equivalent period, which is simple and vulnerable to seasonality. The same period last year, which handles seasonality and imports a year of unrelated change. The plan or forecast, which is the only baseline an executive genuinely cares about and the one most likely to have been invented optimistically. And a holdout — a matched region, audience or time block that did not see the campaign — which is the only one that answers the causal question, and the only one you cannot construct after the fact.
Write the chosen baseline into the plan with its actual value. Not "versus last quarter" but "versus 366 qualified leads in Q2, which is the figure we will compare against". If you also want secondary baselines, name them too, and say which one wins if they disagree. They will disagree.
Step four: fix the measurement window before launch
Two windows, and confusing them causes half the arguments in wrap meetings. The exposure window is when the campaign ran. The outcome window is how long after exposure you keep counting results. They are not the same length and the second one is almost always longer.
Set the outcome window from your own historical conversion lag, not from a platform default. If your sales cycle is six weeks, a campaign judged fourteen days after it ends will look like a failure regardless of what it actually did. If your product is an impulse purchase, a ninety-day window will happily absorb a pile of conversions that had nothing to do with the campaign and make it look like a triumph. Both errors are common and they point in opposite directions.
Write the window as a date. "We will read the result on 14 October and we will not read it earlier." That last clause is the load-bearing one. Someone will ask for a read on day three. The answer is that day-three data exists and will be shared as a delivery check, and it is not the result.
Step five: decide what a null result looks like
This is the step almost nobody does and it is the one that changes behaviour most. Before launch, write the sentence you will publish if the campaign did not work. Something like: "If qualified leads in the window come in below 380, or cost per qualified lead comes in above 620,000 VND, we will call this a failure and we will not run the format again."
Two things happen when you write that down. First, you are forced to admit what "not working" would look like, which frequently reveals that the target was never defined at all. Second, you remove the escape hatch. A campaign with no pre-declared failure condition cannot fail, because at the end there is always a metric that went up and a story that explains why the disappointing one does not count.
The failure sentence should also include the boring middle case, because most campaigns land there. Three verdicts are more useful than two: clear win, clear loss, and inconclusive. Inconclusive is a legitimate result and it has its own action, which is usually either "run again with more volume" or "stop, because we cannot afford to measure this properly and we should not fund things we cannot judge".
Step six: separate leading indicators from lagging ones, and label them
Leading indicators are the ones that move within days: click-through rate, landing page conversion rate, cost per click, add-to-cart rate, demo requests. Lagging indicators are the ones that arrive later and carry the actual value: closed revenue, retention at ninety days, repeat purchase rate, pipeline that converted.
Leading indicators exist to let you steer mid-flight. They do not determine success. A campaign can have a superb click-through rate and produce nothing, and the correct response to a great CTR on day two is not celebration, it is a note in the delivery log. In the plan, put the leading indicators in a section explicitly labelled "for steering, not for judging", and put the lagging outcome in a section labelled "the result". Physical separation on the page prevents a surprising amount of muddled thinking three weeks later.
Lag, Spillover and Cannibalisation: The Three Things That Break Naive Reads
Even with a clean plan, three effects will distort a straightforward before-and-after comparison. You cannot eliminate them. You can account for them, and knowing which one is in play tells you how much to discount the headline.
Conversion lag
Results do not arrive on the day the click happens. In an invented but realistic example, suppose a campaign eventually produces 100 conversions attributable to its exposure window. Read the result three days after the campaign ends and roughly 41 of them have landed. At seven days, 62. At fourteen days, 81. At thirty days, 96. The last few trickle in past day sixty.
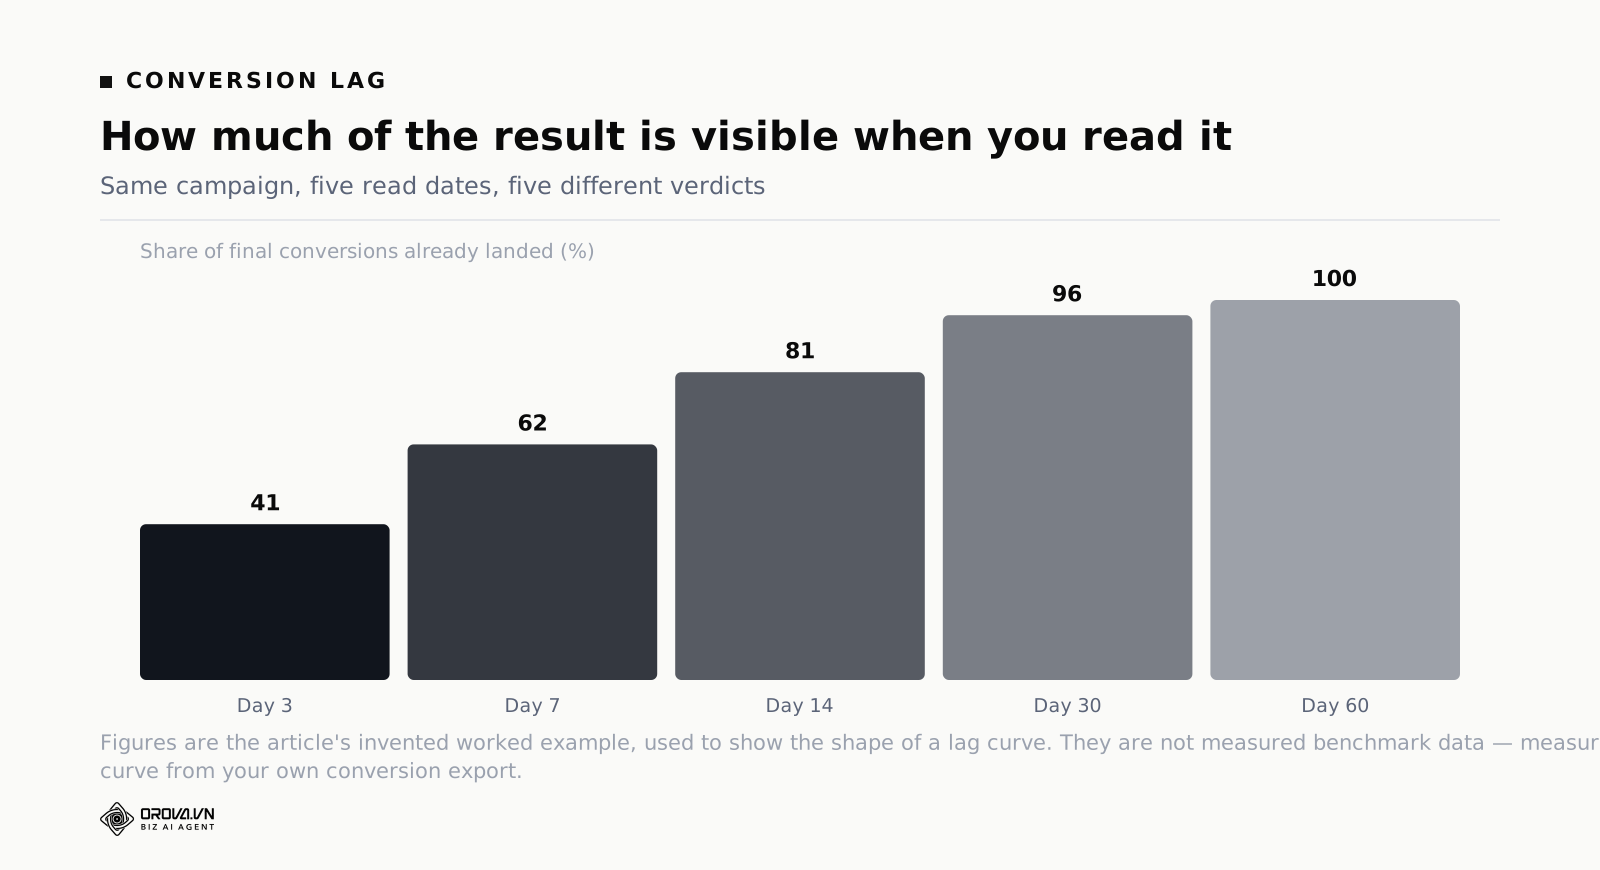
Every one of those cut-offs produces a defensible-sounding number and four of the five are wrong. Worse, the shape of that curve differs by campaign type, which means comparing a fourteen-day read of a top-of-funnel campaign against a fourteen-day read of a retargeting campaign is comparing 60% of one result against 95% of another. That is not a comparison, it is an artefact. If your reporting has ever concluded that retargeting is dramatically more efficient than prospecting, some portion of that gap is this. The mechanics of measuring the curve for your own account, and what it does to return-on-spend figures specifically, are covered in ROAS Formula & Conversion Lag: Why Today's ROAS Is Wrong.
Spillover into channels you did not credit
A campaign that runs on video and social does not only produce conversions attributed to video and social. It produces branded searches, direct visits, people who screenshot the offer and come back on a laptop nine days later, and word of mouth that never touches a tracked link at all. Every one of those lands somewhere else in the report, usually in the channel that gets the last click, which is usually branded search or direct.
The practical countermeasure is not a better attribution model. It is a second baseline: watch total branded search volume, total direct sessions and total site-wide conversions across the campaign window, and compare them against the pre-campaign trend. If the campaign channel shows a small lift and site-wide totals show a larger one, the campaign is doing more than its attributed row suggests. If the campaign channel shows a big lift and site-wide totals are flat, you have moved demand between channels rather than created it.
Cannibalisation
That last case has a name and it is the most under-diagnosed problem in campaign measurement. A branded search campaign that "delivers" cheap conversions is frequently harvesting people who would have clicked the organic result for free. A retargeting campaign shown to people already halfway through checkout takes credit for a purchase that was going to happen. In both cases the platform reports a genuine conversion and the business gained nothing.
You detect it the same way in both cases: hold something back. Turn the campaign off in one region, or for a randomly selected share of the audience, for long enough to read a difference, and compare total outcomes rather than attributed ones. It costs a small amount of volume and it is the only technique in this article that produces a genuinely causal answer. Run it once a year on your largest recurring line item and it will pay for itself.
Campaign Performance Metrics by Campaign Type
Three campaign types, three completely different measurement designs. Applying the same template to all three is the most common structural error in marketing measurement, and it always penalises the brand campaign and flatters the retargeting one.
| Campaign type | Primary outcome | Baseline | Outcome window | Null result |
|---|---|---|---|---|
| Product launch | Units or orders from new customers in the launch window | Plan figure agreed before launch | Launch period plus one full purchase cycle | Below plan and no lift in repeat rate |
| Always-on acquisition | Cost per qualified lead or per new customer | Rolling prior 90-day average for the same channel | Rolling, read monthly, never weekly | Cost above the 90-day average for two consecutive months |
| Brand or category | Branded search volume, or prompted awareness in the target segment | Pre-campaign 8-week trend plus a matched holdout region | Campaign window plus 8 weeks | Holdout and exposed regions move together |
The launch campaign
A launch has a hard baseline problem: there is no history. You cannot compare against last year because the product did not exist. That leaves the plan figure, which means the plan figure has to be defended before launch, in a meeting, with someone senior in the room who is willing to say the number is too optimistic. Do that meeting. A launch judged against a number invented to win budget approval is a launch that has already failed.
Two secondary metrics matter for launches specifically and neither is a delivery metric. First, the share of buyers who are new to the company rather than existing customers switching, because a launch that only sells to your installed base is a migration, not a launch. Second, the early repeat rate, because a product that sells once and never again is a marketing success and a business failure. Neither is visible on day one, which is another reason the launch window has to extend past the launch itself.
The always-on acquisition campaign
Always-on has the opposite problem: too much history and no natural end point. The trap is reading it weekly. Weekly reads of a rolling campaign produce noise that looks like signal, and the standard response — pausing an ad set that had a bad week — actively harms performance by resetting learning and starving the account of data.
The fix is a cadence rule written into the plan. Efficiency gets read monthly against a rolling ninety-day average. Weekly reads exist only as alarms with wide thresholds: spend pacing off by more than a fixed percentage, conversions at zero for two consecutive days, cost per outcome more than double the average. Alarms trigger investigation. They do not trigger a verdict.
The brand campaign
Brand is where measurement discipline usually collapses into reach reporting, and it does not have to. There are three honest options, in ascending order of cost. Branded search volume, which is free to watch, moves within weeks and is a genuine demand signal rather than a delivery one. Direct and organic traffic in the exposed region against an unexposed one, which requires only that you run geographically. And a survey of prompted awareness in the target segment before and after, which is the real answer and costs real money.
Pick according to the size of the decision, per step one. A modest brand budget does not need a survey. The campaign that consumes a third of the annual budget does, and the cost of the survey is trivial against the cost of repeating a brand campaign for three years on the strength of reach figures.
A Worked Example, Start to Finish
Invented numbers throughout, chosen to be arithmetically clean rather than typical of any industry. The point is the shape of the reasoning.
A B2B software company runs a six-week campaign to promote a new integration. The decision is whether to fund the same format for two more integrations next quarter. The primary outcome is qualified demo requests, where "qualified" means the prospect uses the software the integration connects to. The baseline is the previous six weeks, which produced 148 qualified demos at a cost of 1.4 million VND each. The outcome window is the six-week campaign plus four weeks, based on a historical lag curve that shows about 96% of demos landing inside thirty days. The null result, written before launch: fewer than 175 qualified demos, or a cost per demo above 1.6 million, means the format is not repeated.
The campaign spends 280 million VND. At the end of the exposure window the raw count is 132 qualified demos, which would put cost per demo at 2.12 million and look like a clear failure. Four weeks later the count has reached 214. Cost per qualified demo is 1.31 million. Against the baseline of 148 that is 66 additional demos, and against the null threshold of 175 it clears comfortably.
Then the two corrections. Branded search in the same window rose 9% above the pre-campaign trend, which suggests some demand was created rather than captured, and eleven of the 214 demos arrived through direct traffic with no campaign touchpoint recorded but with the integration named in the free-text field. That is spillover, and it argues the true figure is slightly better than the attributed one. Pulling the other way: 38 of the 214 came from accounts already in an open sales opportunity, who would plausibly have booked the demo anyway. That is cannibalisation, and it argues the true figure is worse.
Netting those out gives a defensible range rather than a point estimate: somewhere between about 176 and 225 genuinely incremental demos, cost per incremental demo between roughly 1.24 and 1.59 million. The whole range clears the null threshold, so the verdict is a clear yes and the decision is easy. Had the range straddled the threshold, the honest verdict would have been inconclusive, and the correct next step would have been to run integration number two with a regional holdout to settle it properly.
Notice what made that readable. Not sophisticated analysis — the arithmetic is trivial. It was readable because the threshold existed before the data did.
Metrics to Stop Reporting
Every one of these is genuinely useful somewhere. None of them belongs in a campaign result, and each has a replacement that answers the question the original was pretending to answer.
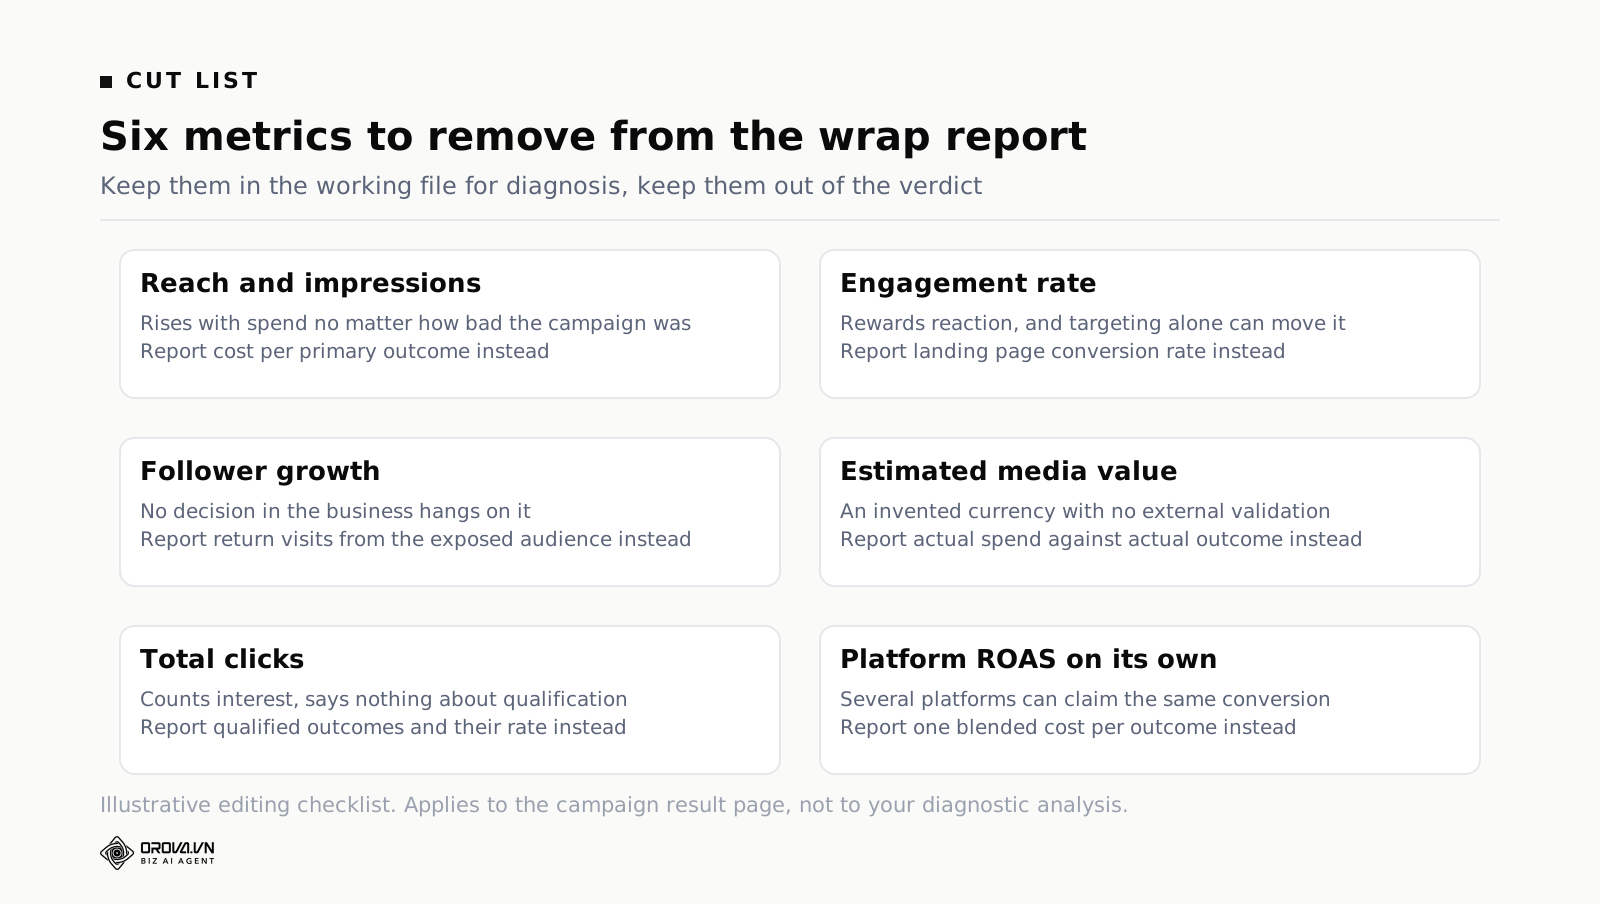
| Stop reporting | Because | Report instead |
|---|---|---|
| Reach and impressions | Rises with spend regardless of quality | Cost per primary outcome |
| Engagement rate | Rewards reaction, not intent; controlled by targeting | Landing page conversion rate |
| Follower growth | Not tied to any decision you will make | Return visits from the exposed audience |
| Estimated media value | Invented currency with no external validation | Actual spend against actual outcome |
| Total clicks | Counts interest, not qualification | Qualified outcomes and their rate |
| Platform-reported ROAS alone | Each platform claims the same conversion | Blended cost per outcome across all channels |
That last row causes the most trouble in practice. When three platforms each report their own attributed conversions, the sum routinely exceeds the number of orders the business actually received. Nobody is lying. Each platform is answering "did someone who saw my ad convert?" and several of them can be true about the same person. The only cure is to hold one blended figure — total spend across all channels divided by total outcomes the business actually recorded — as the number that decides things, and to treat per-platform figures as allocation guides.
Do not delete the retired metrics from your working files. Move them to an appendix or a second dashboard page. They are useful for diagnosing why something happened. They are just not allowed to answer whether it worked.
The One-Page Measurement Plan
All of the above collapses into a single document written before launch. It fits on one page and it takes about twenty minutes once you have done it twice.
- Decision. "At the end of this campaign we will decide whether to ____." One sentence.
- Primary outcome. One metric, defined precisely enough that two people would count it identically.
- Baseline. The comparison, with its actual numeric value written out now.
- Windows. Exposure dates and the outcome read date, both as calendar dates.
- Thresholds. The number above which this is a win, the number below which it is a loss, and the acknowledgement that in between is inconclusive.
- Steering indicators. Two or three leading metrics, labelled explicitly as not deciding the verdict.
- Known distortions. Which of lag, spillover and cannibalisation apply here, and how you will check each.
- Owner. The one person who will write the verdict, named now, before anyone knows what the verdict will be.
Circulate it before launch and get one person outside marketing to acknowledge it — finance is ideal. That acknowledgement is what stops the goalposts moving later, and it is far easier to get agreement on a threshold when nobody knows yet whether it will be embarrassing.
Reading the Result Without Fooling Yourself
When the read date arrives, run through five checks in order before you write a single sentence of the wrap.
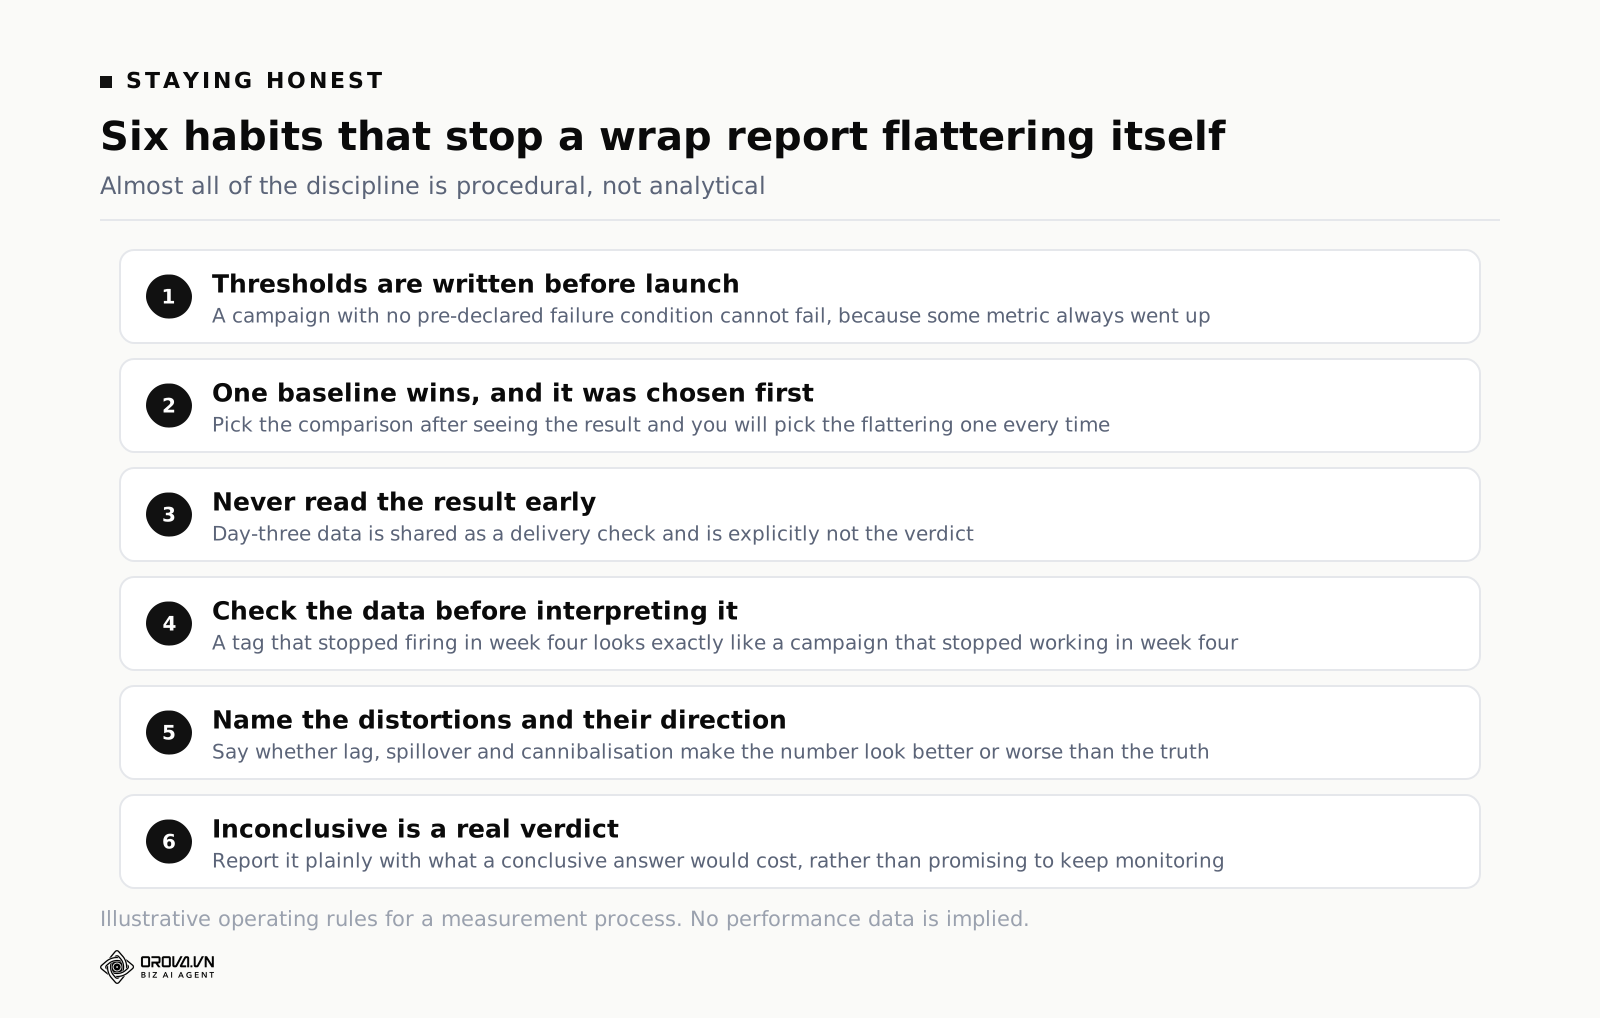
First, check that the data is complete. Tracking breaks quietly, and a conversion tag that stopped firing in week four will read exactly like a campaign that stopped working in week four. Compare platform-reported outcomes against what your own system recorded. If the gap changed mid-campaign, fix the data before interpreting it.
Second, compare against the pre-declared baseline and only that one. If you find yourself reaching for a different comparison, write down why in one sentence. Sometimes the reason is legitimate — a competitor exited the market mid-campaign, a platform outage removed four days of delivery — and writing it down keeps it honest instead of convenient.
Third, apply the threshold and say the word. Win, loss, or inconclusive. Say it in the first sentence of the wrap, before any number, the way any report built around a conclusion rather than a data dump has to open. A reader who has to derive the verdict from your charts will derive a different one.
Fourth, name the distortions and their direction. "Lag is handled, the window was long enough. Spillover probably makes this look slightly worse than it was. Cannibalisation probably makes it look better. On balance we think the true figure is near the middle of the reported range." That paragraph builds more credibility than any chart.
Fifth, state the decision. The plan named one. Make it. A wrap report that ends with "we will continue to monitor" wasted the entire exercise, because monitoring was never the decision you wrote down.
Doing This By Hand, and Where a Tool Starts to Earn Its Place
All of this works on a spreadsheet and for one or two campaigns a month it should stay there. The plan is a text document. The baseline is a number you looked up. The read is an export and some arithmetic. Buying software to do that is buying a solution to a problem you do not have yet.
The point where manual work stops scaling is specific and easy to recognise. It arrives when the outcome you care about lives in a different system from the spend — orders in the shop platform, qualified leads in the CRM, spend split across three ad platforms — and assembling one honest blended figure means four exports and a morning of matching date ranges by hand. At that stage the arithmetic is still trivial and the assembly is what costs you, so reads slip, then become monthly, then become "when someone asks", and the discipline quietly dies of friction rather than disagreement.
That is the job a reporting layer does: pull each source in on a schedule, hold the definitions in one place so a qualified lead means the same thing in August as it did in June, and let a threshold sit on the page next to the number it judges. Orova Insight is built for that shape of problem — it connects sixteen kinds of source including GA4, Search Console, Google Ads, Meta Ads and TikTok Ads, takes a JSON webhook from a CRM or an in-house system as an ordinary drag-and-drop source, lets you define custom metrics by formula so blended cost per outcome is a field rather than a manual calculation, and sends the report on a schedule so the read date happens whether or not anyone remembers.
What no tool does is choose your outcome, defend your baseline or write your null result. Those are judgement calls and they stay with a person. A tool that assembles the numbers faster simply means you find out sooner whether the judgement was any good.
Frequently Asked Questions
How long should I wait before judging a campaign?
Long enough to capture the great majority of your conversion lag, which you measure from your own history rather than guessing. Export the last six months of conversions with both the click date and the conversion date, and find the number of days at which about 90% have landed. That is your minimum outcome window. For most considered purchases it lands somewhere between two and six weeks; for impulse categories it can be a few days.
What if I inherited a campaign with no measurement plan?
Do what you can honestly do and label the limitation clearly. You can still establish a retrospective baseline from the prior period, still apply an appropriate window, still check site-wide totals for spillover. What you cannot do is invent a holdout after the fact or claim causality. Write "this is a before-and-after comparison, not a causal test" in the wrap, and write the measurement plan for the next campaign the same week.
Is the primary outcome always a conversion?
No. It is whatever the funding decision hangs on. For a recruitment campaign it might be qualified applications. For a category-education campaign it might be branded search volume or prompted awareness. For a retention campaign it might be ninety-day repeat rate. The requirement is that it is one number, measurable inside the window, and closer to business value than to media delivery.
How do I handle a campaign that ran across several platforms?
Judge the campaign on a blended figure — total spend across every platform divided by the total outcomes your own system recorded — and use the per-platform numbers only to decide where the next unit of budget goes. Summing platform-reported conversions will overcount, because more than one platform can legitimately claim the same person. Where the platforms disagree sharply, that is a signal about overlap in your audiences, not a puzzle to solve with a better attribution model.
What counts as a big enough difference to matter?
The threshold you wrote before launch, and it should have been set by what would change the decision rather than by statistical convention. If a 5% improvement in cost per outcome would not alter what you do next, then 5% is not a meaningful difference for this decision, no matter how it tests. Set thresholds by consequence first, then check whether you have the volume to detect a difference that size. If you do not, say so in the plan and either increase the budget or accept that the campaign will produce an inconclusive read.
Should I report an inconclusive result to executives?
Yes, plainly, in the first sentence, together with what it would take to get a conclusive answer and what it would cost. Executives handle uncertainty far better than they handle being confidently told something that turns out to be wrong. A team that reports inconclusive results honestly gets believed when it reports a win.
What to Do Before Your Next Launch
Take the campaign that is closest to going live and write its one-page measurement plan today, before the creative is signed off. Eight items, twenty minutes. Then do the harder half: measure your own conversion lag from the last six months of data and set the outcome window from that curve rather than from habit, because the window is where most wrong verdicts come from.
Then go back to the last campaign you wrapped and ask what decision it informed. If you cannot name one, that is not a reason for embarrassment — it is the single most common finding when teams run this exercise for the first time, and it is exactly the thing the plan fixes. The next campaign will have an answer written down before it starts, and the wrap deck will finally be able to answer the only question the room ever asks.
Stop Rebuilding This Plan From Scratch Every Time
Doing this properly by hand means someone has to pull numbers from several different places, line them up against a baseline that has to be estimated separately, wait out the lag before calling a result, and then write all of it into a deck that holds up under one hard question. That's real hours every single campaign, and most teams quietly skip steps when a deadline is close, which is exactly when the wrap deck goes back to reach and impressions.
Orova Insight is built to take that manual work off your plate — it pulls the campaign performance metrics together, tracks them against what you set as the decision and the baseline, and flags results as they're ready to call instead of leaving someone to guess. If a one-page measurement plan sounds right but you don't want to rebuild it every time, it's worth a look.
Put the real metrics on one board
Orova Insight pulls ad, web and CRM data into one report so success is measured on outcomes.
Start for free