
How to measure content marketing ROI: formulas, GA4 paths and a worked example

When executive leadership asks marketing teams to measure content marketing roi, presenting a deck filled with organic traffic growth, keyword rankings, and social media impressions is rarely enough to protect a department budget. Chief financial officers view marketing through capital allocation efficiency, demanding proof that dollars deployed into editorial production generate measurable cash inflows. The traditional response has relied on simplistic last-click conversion tracking in web analytics, crediting entire sales pipelines to the final contact form a buyer completed. That approach fundamentally misinterprets commercial buying journeys. Modern enterprise purchasers interact with multiple educational blog posts, comparative guides, and product specifications over several months before requesting a sales consultation. When organizations reduce their analytical scope to direct last-touch actions, top-of-funnel educational articles appear financially useless, leading to premature budget cuts. This guide deconstructs how to measure content marketing roi accurately by establishing full-funnel attribution models, accounting for compounding asset lifecycles, and calculating end-to-end commercial return.
Measure Content Marketing ROI: What It Is
Content marketing ROI is the financial metric that calculates the net revenue generated by content initiatives relative to their total production and distribution costs. It quantifies business profitability rather than vanity engagement, isolating commercial pipeline impact from passive brand awareness to justify long-term organic growth investments.
The practice originated within corporate finance management, where capital expenditure requires clear return on investment modeling. During the early 2010s, as digital marketing shifted from experimental corporate blogging into systematic inbound customer acquisition, practitioners adapted return on investment formulas to account for the direct and indirect pipeline contributions of digital editorial assets.
Marketers frequently conflate content marketing ROI with related performance metrics. Understanding where boundaries lie prevents costly reporting errors across executive presentations.
| Concept | How It Differs | Everyday Example |
|---|---|---|
| Content Marketing ROI | Measures net commercial revenue against full lifecycle editorial costs across the entire organic funnel. | A software company spending 15,000 dollars on articles that generate 144,000 dollars in closed customer contract value. |
| SEO ROI | Evaluates total organic search revenue against all search engine optimization expenses, including technical audits and site migrations. | Calculating company revenue gains after fixing site architecture, core web vitals, and metadata site-wide. |
| Digital Ad ROAS | Measures short-term gross revenue generated directly by paid advertising clicks divided exclusively by ad media spend. | An e-commerce shop spending 5,000 dollars on Google Search Ads to generate 20,000 dollars in immediate checkout receipts. |
Consider an everyday scenario involving a commercial bakery purchasing a ten-thousand-dollar industrial deck oven. The bakery owner did not fill out a contact form upon first discovering the manufacturer. Six months earlier, they read a detailed technical maintenance guide on heating element longevity, downloaded a flour hydration calculator, and subsequently returned via a branded search query to request a consultation. Evaluating return on investment requires linking that early technical maintenance guide to the ten-thousand-dollar purchase rather than attributing full revenue credit solely to the final contact form page.
Why Measuring Content Marketing ROI Matters in Business Strategy
Content marketing ROI exists to solve the accountability gap between marketing output and financial performance. For content strategists, marketing directors, and financial controllers, systematic measurement transforms creative writing from a perceived expense into an accountable revenue engine.
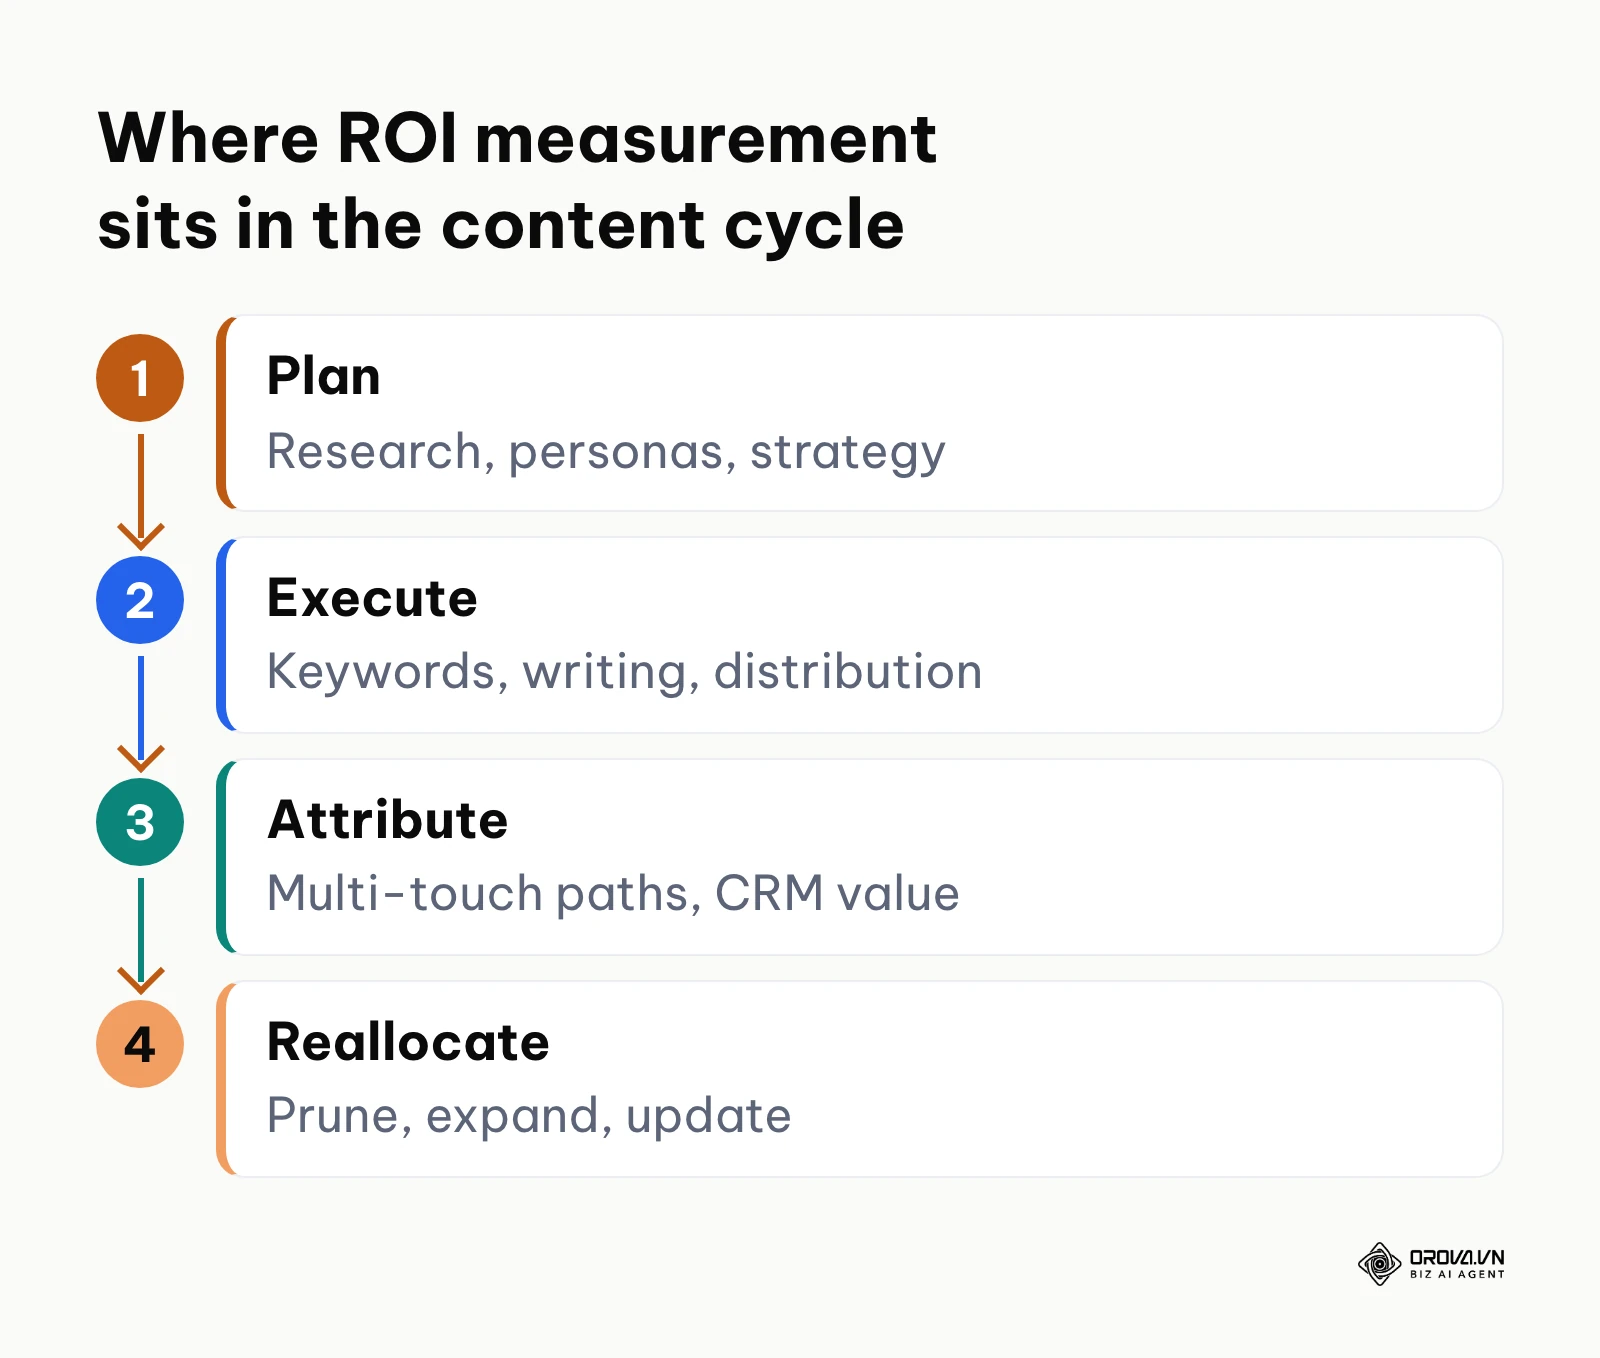
Within the broader business framework, content measurement occupies a pivotal position between strategy formulation and budget expansion:
- Strategic Planning: Market research, buyer persona definition, and a documented content strategy framework.
- Execution and Distribution: Keyword mapping, editorial production, technical search optimization, and syndication.
- Attribution and Valuation: Capturing multi-touch user sessions, isolating assisted conversions, and reconciling pipeline value in customer relationship management (CRM) software.
- Capital Reallocation: Pruning underperforming topics, expanding winning subject clusters, and updating decaying historical articles.
If an organization ignores content return measurement, editorial roadmaps default to volume-based vanity metrics. Content writers chase search volume rather than buyer intent. When economic contractions force leadership to trim operational expenses, unmeasured content programs are inevitably the first to be eliminated because marketing leadership cannot demonstrate financial downside to executive stakeholders. Proving content ROI is consistently cited by B2B marketers as one of their hardest measurement problems, which is exactly why unmeasured programs are vulnerable.
When You Do Not Need to Measure Content Marketing ROI Yet
There are specific operational stages where calculating formal content return on investment is premature or unproductive. Early-stage startups operating on pre-seed funding with brand-new websites under three months old lack the conversion data volume needed to calculate statistically valid financial ratios. Similarly, dedicated public relations announcements, crisis communications, or experimental narrative thought leadership aimed exclusively at category positioning should not be evaluated through direct sales formulas. When a site still attracts only a small volume of monthly organic visits, calculating multi-touch revenue yields erratic percentages. In these circumstances, teams should focus on indexation velocity, search intent resonance, and leading user engagement signals before building complex financial ledgers.
The Real Value and Benefits of Content Marketing ROI Tracking
Establishing a reliable attribution framework provides distinct advantages at both the corporate governance level and the day-to-day tactical level. For executive leadership, it delivers capital allocation efficiency, cash flow predictability, and risk mitigation against volatile digital advertising auction prices. For marketing teams, it secures headcount, clarifies editorial priorities, and establishes shared objectives with sales departments.
Defending Marketing Budgets and Securing Executive Buy-In
Before implementing rigorous financial tracking, marketing leaders regularly face budget scrutiny during annual planning cycles. Department heads present charts showing traffic gains, only to encounter skepticism from finance executives who cannot trace those sessions to closed revenue. After connecting web sessions to CRM pipeline records, marketing leaders present verified revenue contribution reports. Content shifts from an ambiguous cost center to an authorized capital investment. Teams that cannot articulate a commercial return on organic channels are usually the first to lose budget when planning tightens.
Prioritizing Revenue-Generating Editorial Roadmaps
Before establishing commercial metrics, editorial teams prioritize keywords based solely on search volume. Writers publish broad definitional articles that attract large audiences with negligible commercial intent. After auditing revenue per topic cluster, editorial teams reallocate writing resources toward high-intent comparative reviews and technical evaluation guides. Editorial production concentrates on content assets that directly influence purchasing evaluations.
Shortening the B2B Sales Cycle Through Content Enablement
Before tracking multi-touch reading paths, sales representatives rarely leverage marketing content during prospect negotiations. Prospects spend months deliberating, repeatedly asking sales engineers for architectural clarifications. After mapping content consumption to customer accounts, marketing provides sales teams with high-impact bottom of funnel content assets that answer specific buyer objections. Prospects consume targeted implementation guides independently, reducing the sales cycle duration and increasing deal velocity.
| Tangible Benefit | Primary Evaluation Metric | Expected Timeframe to Realize |
|---|---|---|
| Editorial Budget Protection | Percentage of marketing-sourced pipeline revenue | 6 to 12 months |
| High-Intent Topic Focus | Conversion rate from organic session to qualified lead | 3 to 6 months |
| Sales Cycle Acceleration | Average days from first opportunity creation to closed deal | 6 to 9 months |
| Lower Blended Acquisition Cost | Customer Acquisition Cost (CAC) reduction across organic channels | 9 to 18 months |
Discover Orova.vn – a Biz AI Agent platform with OROVA SEO, a complete solution for every website. The system supports search engine optimization from A to Z with features including keyword research, writing new SEO-ready articles, optimizing existing content, rank tracking, plus competitor analysis and in-depth technical analysis. Sign up today to experience OROVA SEO completely free (offer valid through July 7, 2027).
How Content Marketing ROI Actually Works: Core Mechanics and Formulas
Measuring content return on investment requires establishing transparent financial accounting across both expenditure and revenue generation. The standard mathematical foundation appears straightforward:
Content Marketing ROI = (Attributed Content Revenue − Total Content Costs) ÷ Total Content Costs × 100%
While the formula is simple, its practical application often fails because teams either underestimate total production expenditures or misattribute multi-touch digital conversions.
Component 1: Calculating the True Cost of Content Production and Maintenance
Calculating accurate expenditure requires aggregating every direct and indirect cost incurred to produce, publish, and maintain editorial assets. Relying exclusively on freelancer invoices distorts profitability by ignoring internal overhead.
- What it does: Aggregates fully loaded financial expenditures incurred across the entire editorial lifecycle.
- Inputs required: Internal staff salaries prorated by hours dedicated to content, freelance copywriter invoices, external graphic design fees, dedicated software subscriptions (keyword research, editing, content management), and ongoing technical maintenance expenses.
- Outputs generated: Fully loaded cost per published article and cumulative program expenditure over a defined measurement period.
- Common breakdown points: Teams frequently overlook annual content refresh hours, internal editorial review meetings, and specialized software licensing, resulting in an artificially low baseline cost that distorts subsequent ROI calculations.
Component 2: Capturing Full-Funnel Cash Flow with a Complete Financial Example
To bridge abstract theory with commercial reality, consider an end-to-end B2B financial scenario evaluating a targeted content program over a twelve-month lifecycle.
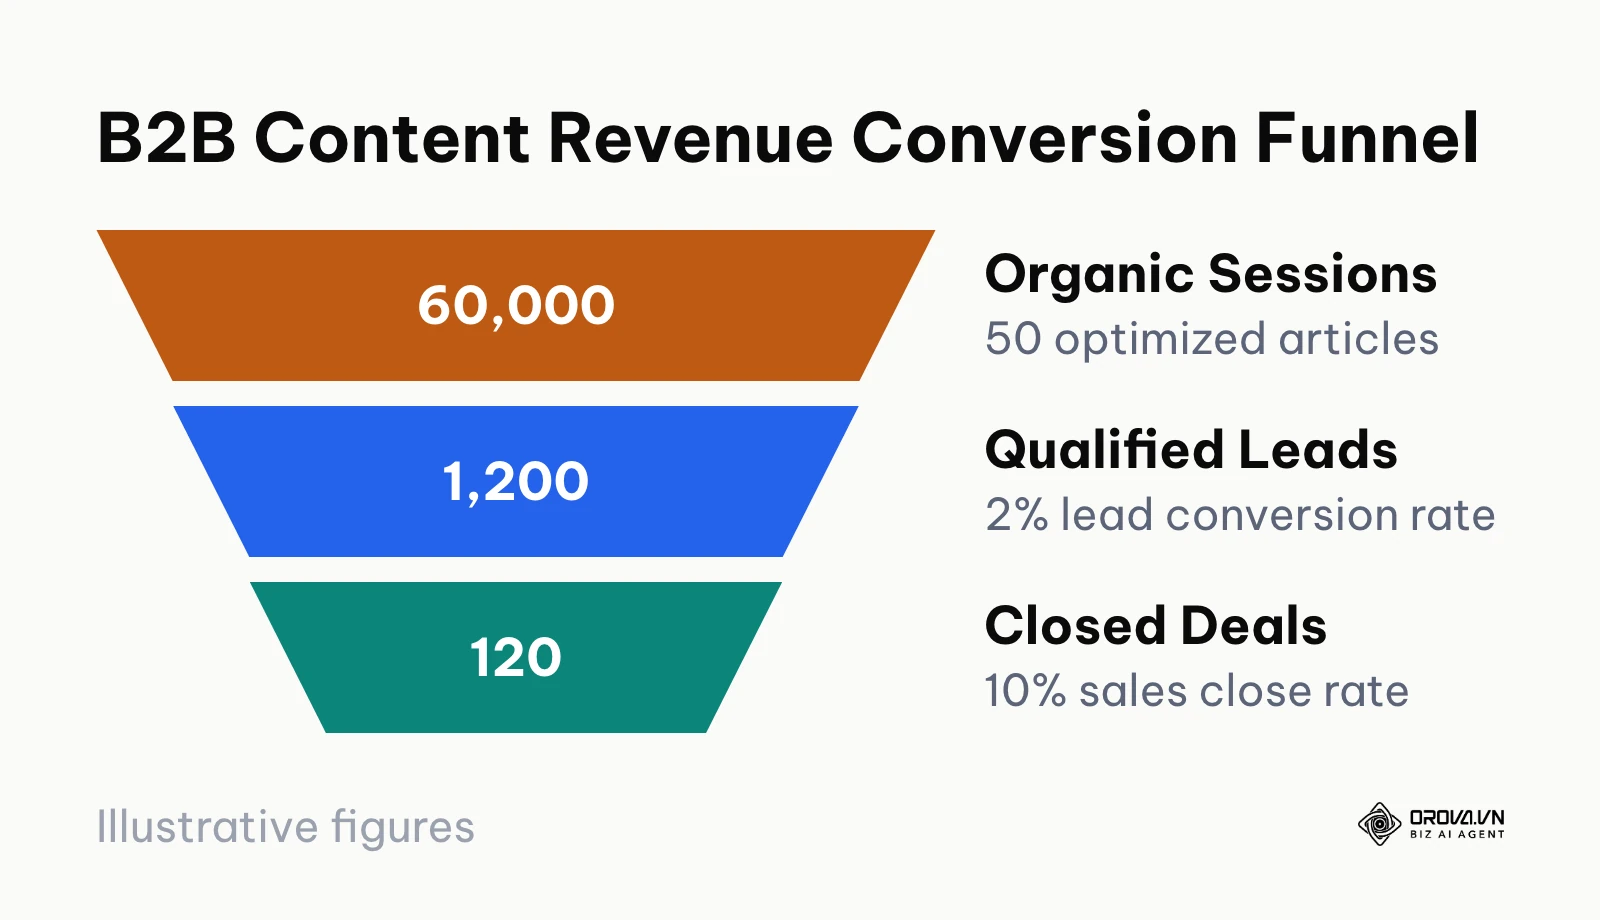
An enterprise software company produces an editorial library of 50 targeted search articles over six months. The fully loaded investment totals 15,000, dollars averaging 300 dollars per asset (covering research, expert writing, visual assets, and editorial review).
Once indexed and ranking, the library accumulates 60,000 organic search sessions over its first twelve months. Conversion tracking indicates a 2% visitor-to-lead conversion rate on whitepaper downloads, pricing calculators, and product demo forms, producing 1,200 marketing qualified leads in that year. The sales organization operates at a 10% opportunity-to-win close rate, converting those inbound inquiries into 120 closed customer contracts. With an average annual contract value of 1,200 dollars:
- Gross Attributed Revenue: 120 × 1,200 dollars = 144,000 dollars
- Total Production Investment: 15,000 dollars
- Net Commercial Profit: 144,000 dollars − 15,000 dollars = 129,000 dollars
- Return on Investment: 129,000 dollars ÷ 15,000 dollars × 100% = 860%
The funnel diagram in this section illustrates the session drop-off across each conversion stage.
Example illustration: A mid-market B2B logistics software company with twenty-five employees sought to quantify the commercial performance of its technical shipping guides. The marketing team assigned dedicated CRM campaign tags to each content asset, instituted closed-loop deal tracking in their CRM, and configured goal completions for demo bookings originating from organic sessions. During initial reporting, the sales team failed to associate incoming telephone leads with website articles because sales representatives manually bypassed lead source fields. The team resolved this by integrating automated reverse-IP company identification on the website and adding mandatory referral source drop-down menus within the CRM interface. This tracking adjustment revealed twelve previously untracked enterprise shipping contracts directly influenced by their customs compliance guide, providing concrete financial justification to renew the company's content production budget. For organizations seeking to implement similar inbound capture systems, establishing systematic lead generation content marketing workflows ensures that incoming visitor demand is properly attributed from the first touchpoint.
Component 3: Multi-Touch Attribution and Assisted Conversions in Google Analytics 4
Traditional analytics reporting relies heavily on last-click attribution, awarding 100% of conversion credit to the final URL a visitor visited immediately prior to submitting a form. In enterprise sales cycles spanning multiple weeks, buyers often consume several educational articles before visiting a product pricing page. Last-click attribution incorrectly values those top-of-funnel guides at zero dollars, leading marketers to eliminate the very content that initiates customer acquisition journeys.
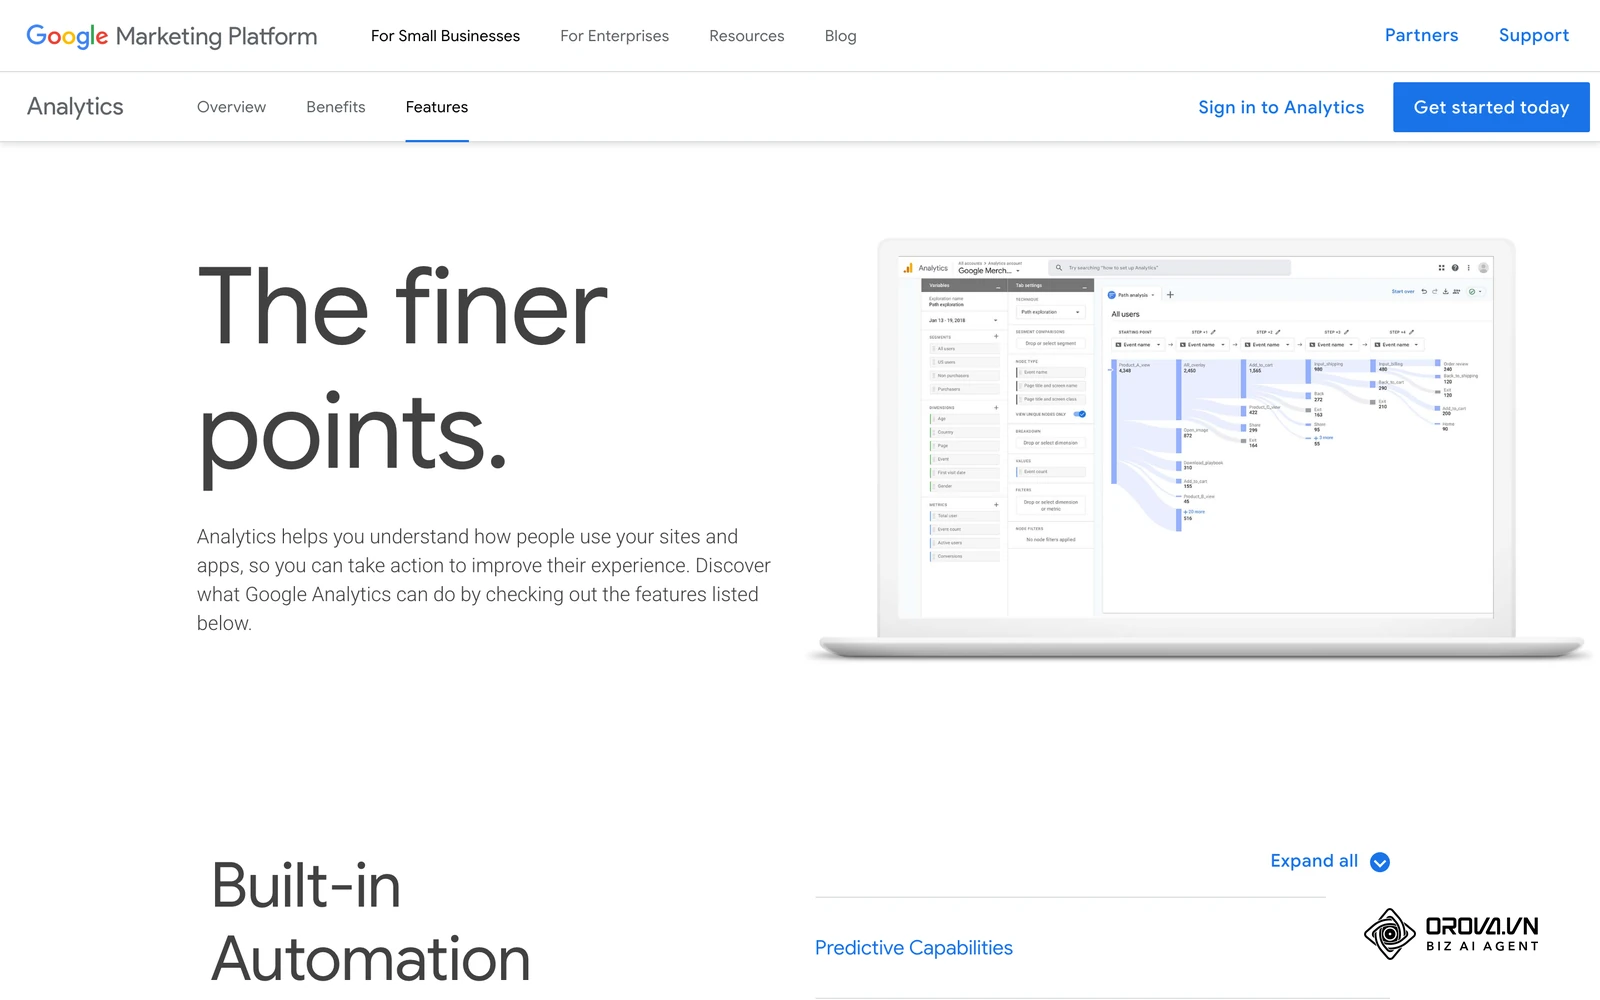
Modern tracking in Google Analytics 4 (GA4) uses data-driven attribution models to assign fractional credit across all touchpoints in a conversion path. According to Google Support in their official About Attribution and Attribution Modeling in GA4 documentation (2024), data-driven attribution evaluates both converting and non-converting touchpoints to assign fractional credit across multiple user visits.
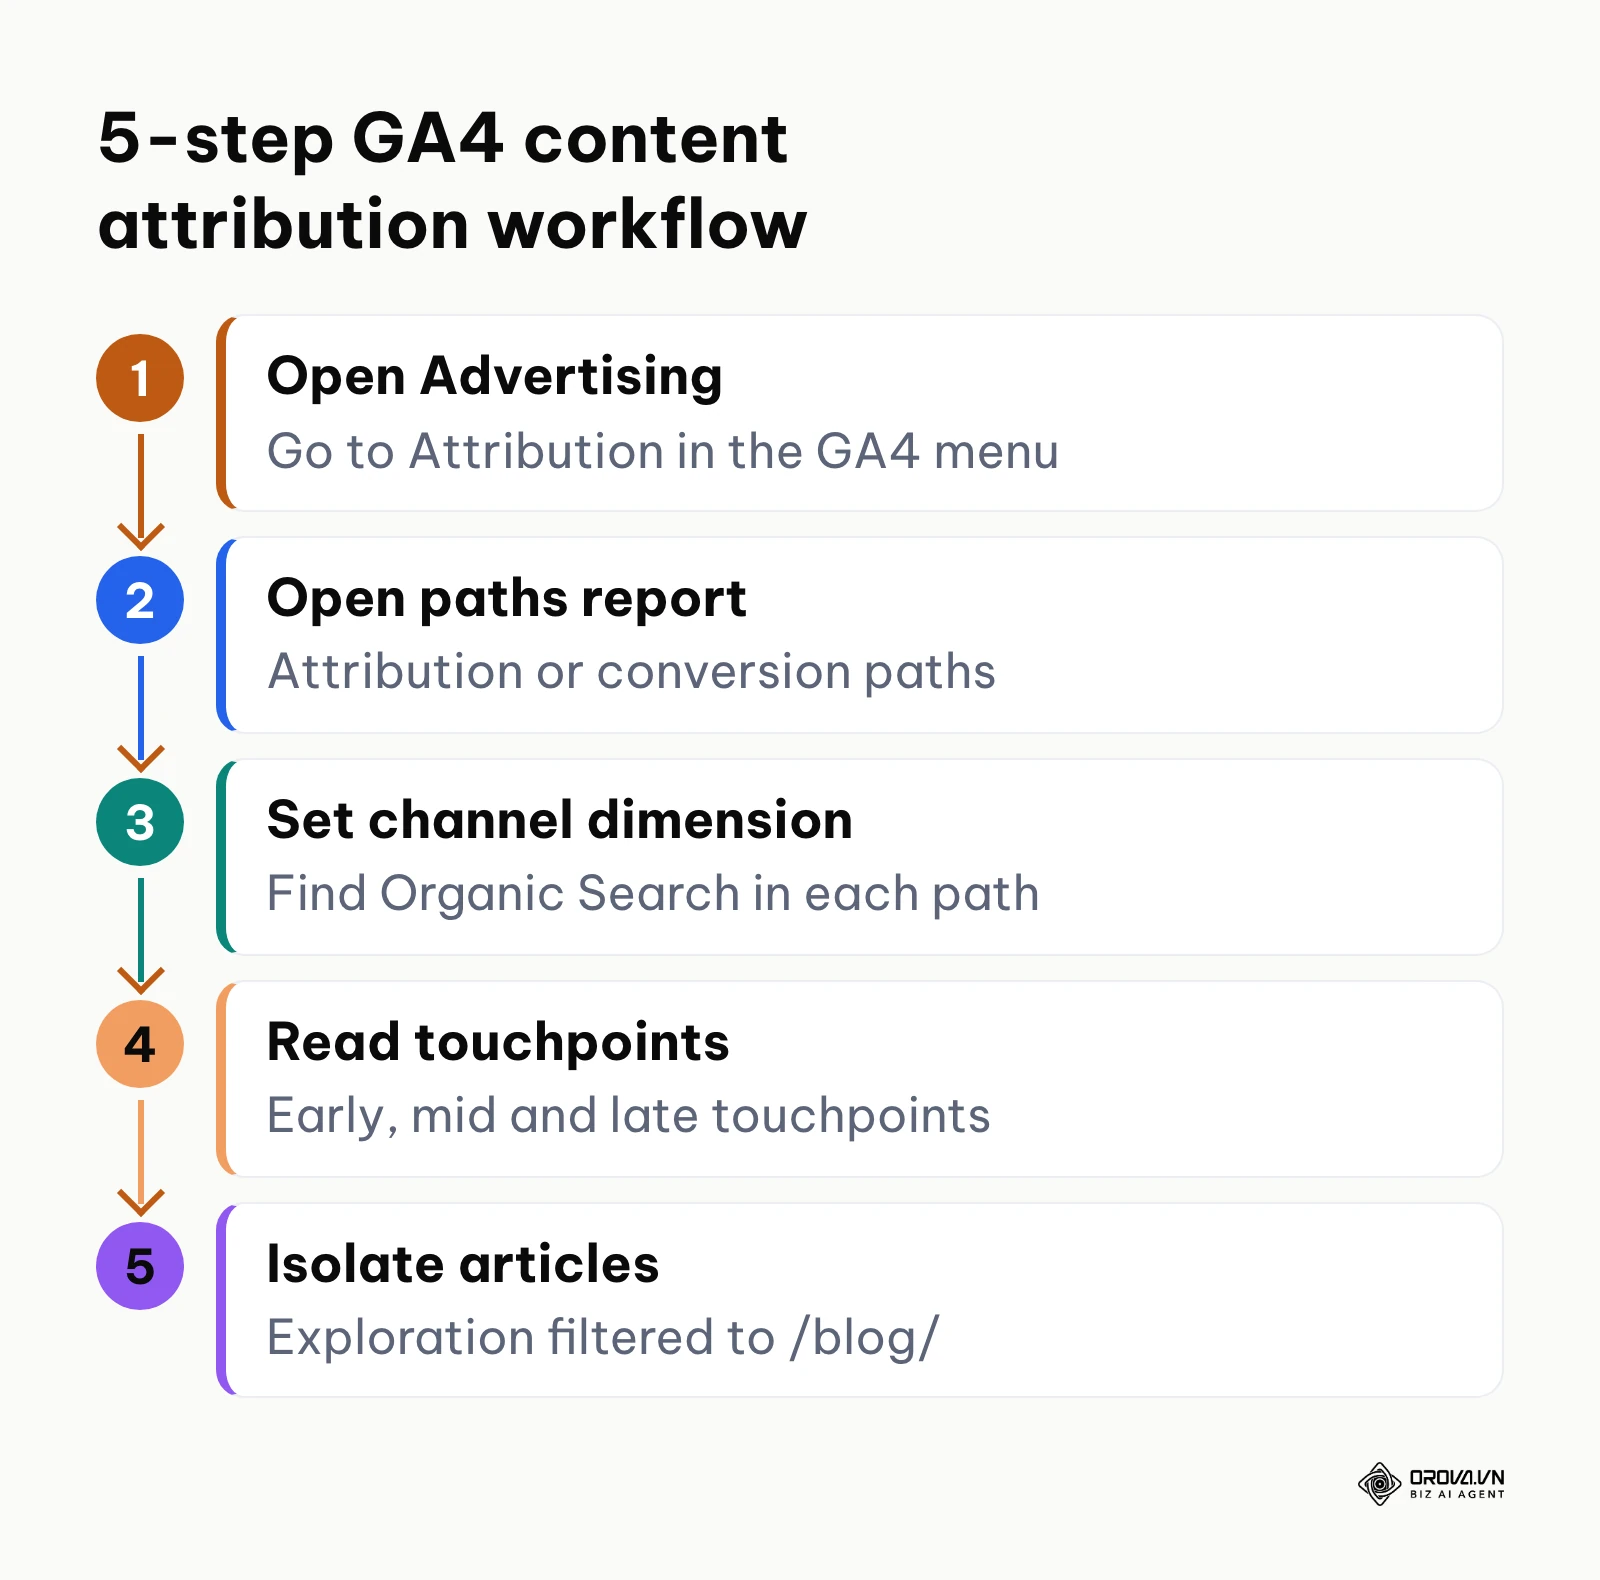
To view assisted conversions and multi-touch paths for content in GA4:
- Open your GA4 property and select the Advertising section from the left navigation panel.
- Under Attribution, open the paths report (labelled Attribution paths or Conversion paths, depending on when your property's menus were last updated).
- Set the path dimension to the default channel group so you can see where Organic Search appears in each path.
- Review the visualization across Early touchpoints, Mid touchpoints, and Late touchpoints to observe where organic visits initiate or assist conversion paths.
- To isolate individual articles, build a free-form Exploration with the landing page dimension filtered to your editorial directory (for example, containing /blog/), then compare key events and revenue per article.
Example illustration: A specialized cybersecurity consultancy with fifty consultants published weekly vulnerability teardowns but struggled to understand why their top-performing traffic pages showed zero contact form submissions in default web analytics. The digital marketing manager opened the Attribution workspace in Google Analytics 4, filtered user conversion paths for URLs within the research directory, and compared the last-click view of each path against the data-driven attribution model. The primary obstacle was that enterprise security directors read technical teardowns on desktop devices but submitted contact inquiries weeks later via direct search after internal committee approvals. By evaluating assisted conversions rather than last-click metrics, the team identified that four foundational vulnerability guides had participated in eighteen qualified enterprise penetration testing deals, preventing the ill-advised deletion of highly valuable top-funnel research assets.
Component 4: Compounding Asset Value and Multi-Year Cost Amortization
A major flaw in basic marketing accounting is charging the entire production cost of an article against the initial month of publication while ignoring its multi-year revenue generation. Unlike paid advertising, which ceases to deliver traffic the moment ad spend stops, search-optimized content functions as a compounding capital asset. Understanding the broader SEO ROI formula and measurement dynamics clarifies how upfront technical investments yield dividends over extended horizons.
When an article published two years ago generates a contract today, attributing zero production cost to that sale while charging the entire initial production fee against year one distorts financial reality. A practical content accounting approach amortizes initial production expenditures over a twenty-four to thirty-six month asset lifecycle, charging only routine content update costs against subsequent fiscal periods.
| Operating Year | Annual Cost | Cumulative Organic Traffic | Cumulative Revenue Generated | Cumulative Actual ROI |
|---|---|---|---|---|
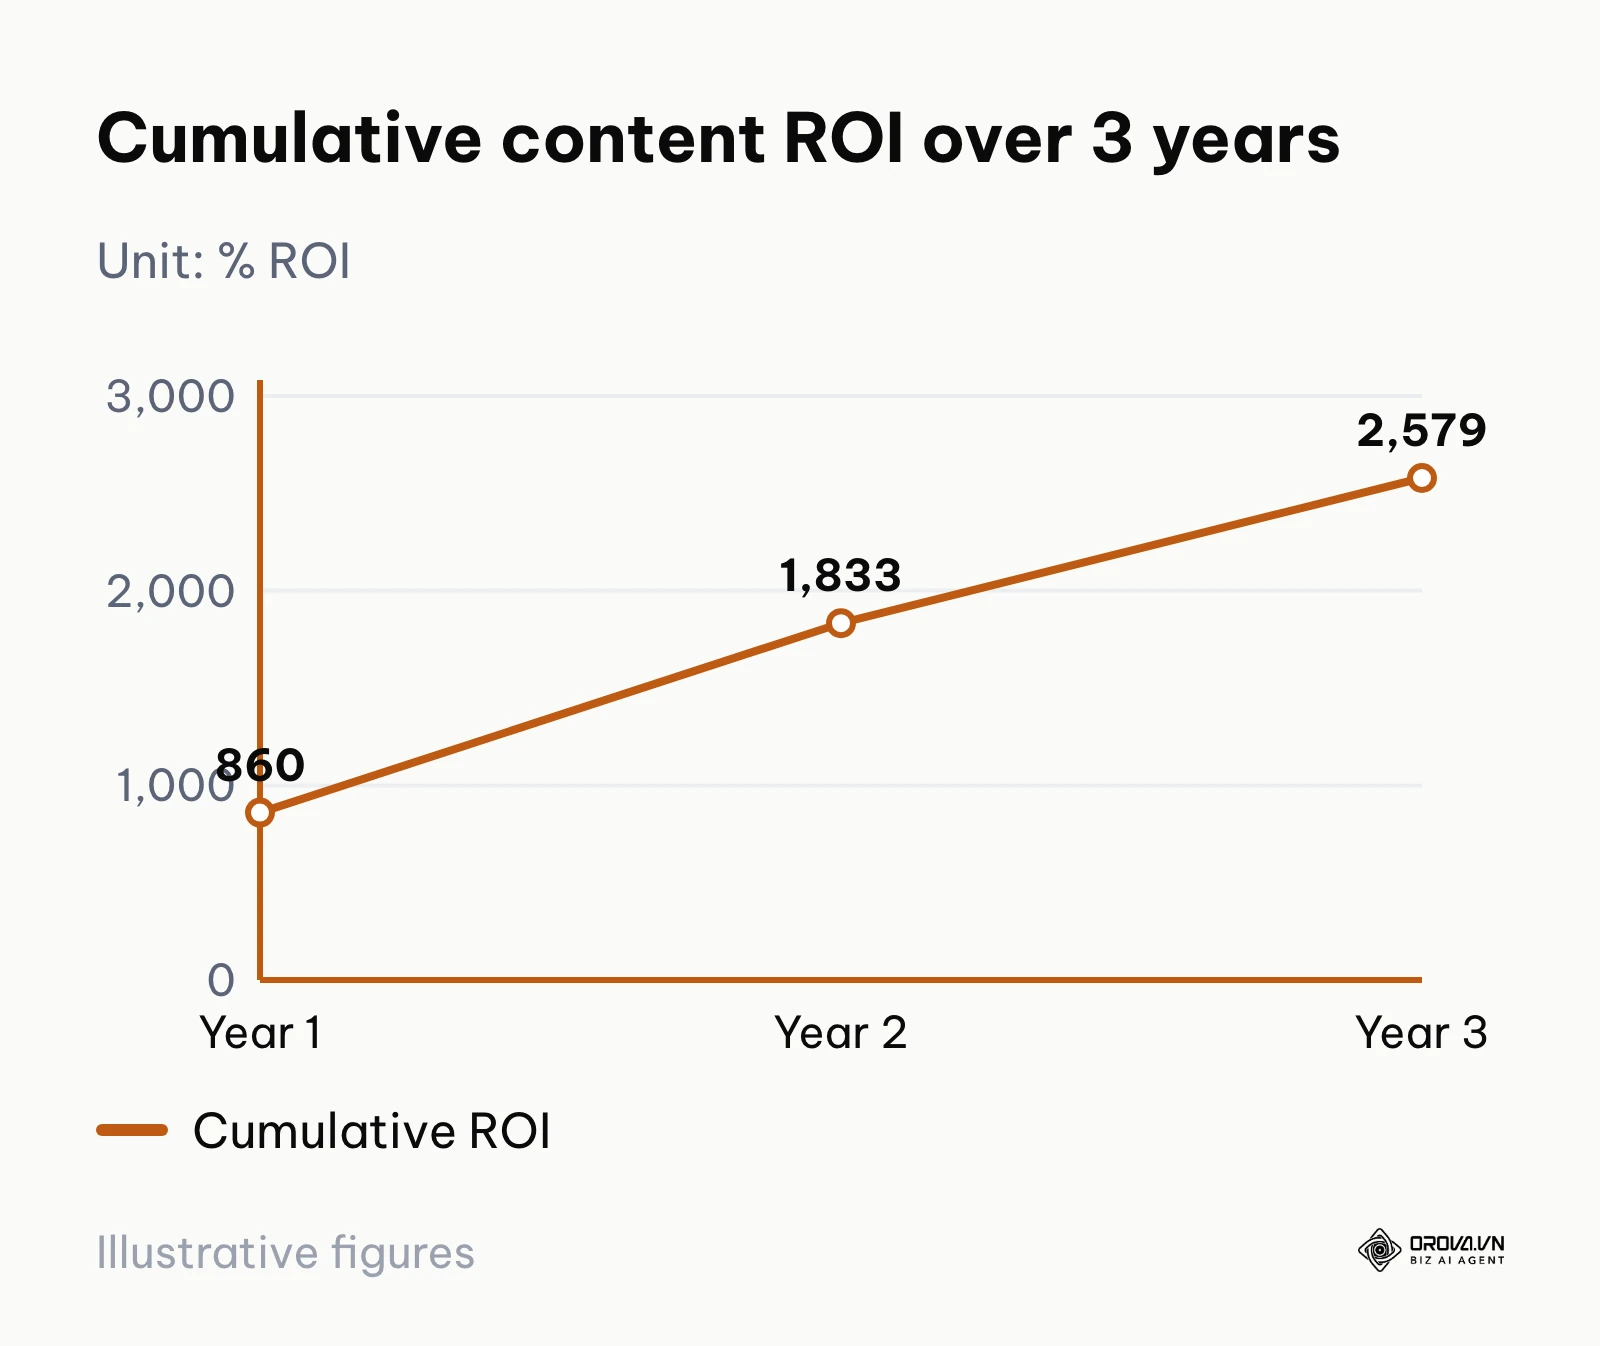
| Year 1 | 15,000 dollars (Initial Creation) | 60,000 Sessions | 144,000 dollars | 860% |
| Year 2 | 3,000 dollars (Updates & Audits) | 145,000 Sessions | 348,000 dollars | 1,833% |
| Year 3 | 3,500 dollars (Refreshes & Expansions) | 240,000 Sessions | 576,000 dollars | 2,579% |
These are illustrative figures that extend the worked example: cumulative ROI compares cumulative revenue (at the same 2.40 dollars of revenue per session as Year 1) with cumulative cost to date (15,000, dollars 18,000 dollars and 21,500 dollars). As shown in the table above, the initial production cost of 15,000 dollars in Year 1 yields substantial returns, but the compounding nature of organic search results in an ROI that reaches 2,579% by Year 3 as maintenance costs remain flat while cumulative pipeline value escalates. The trend line in this section plots the same three years.
Component 5: Measuring Topic Cluster ROI Over Individual Blog Posts
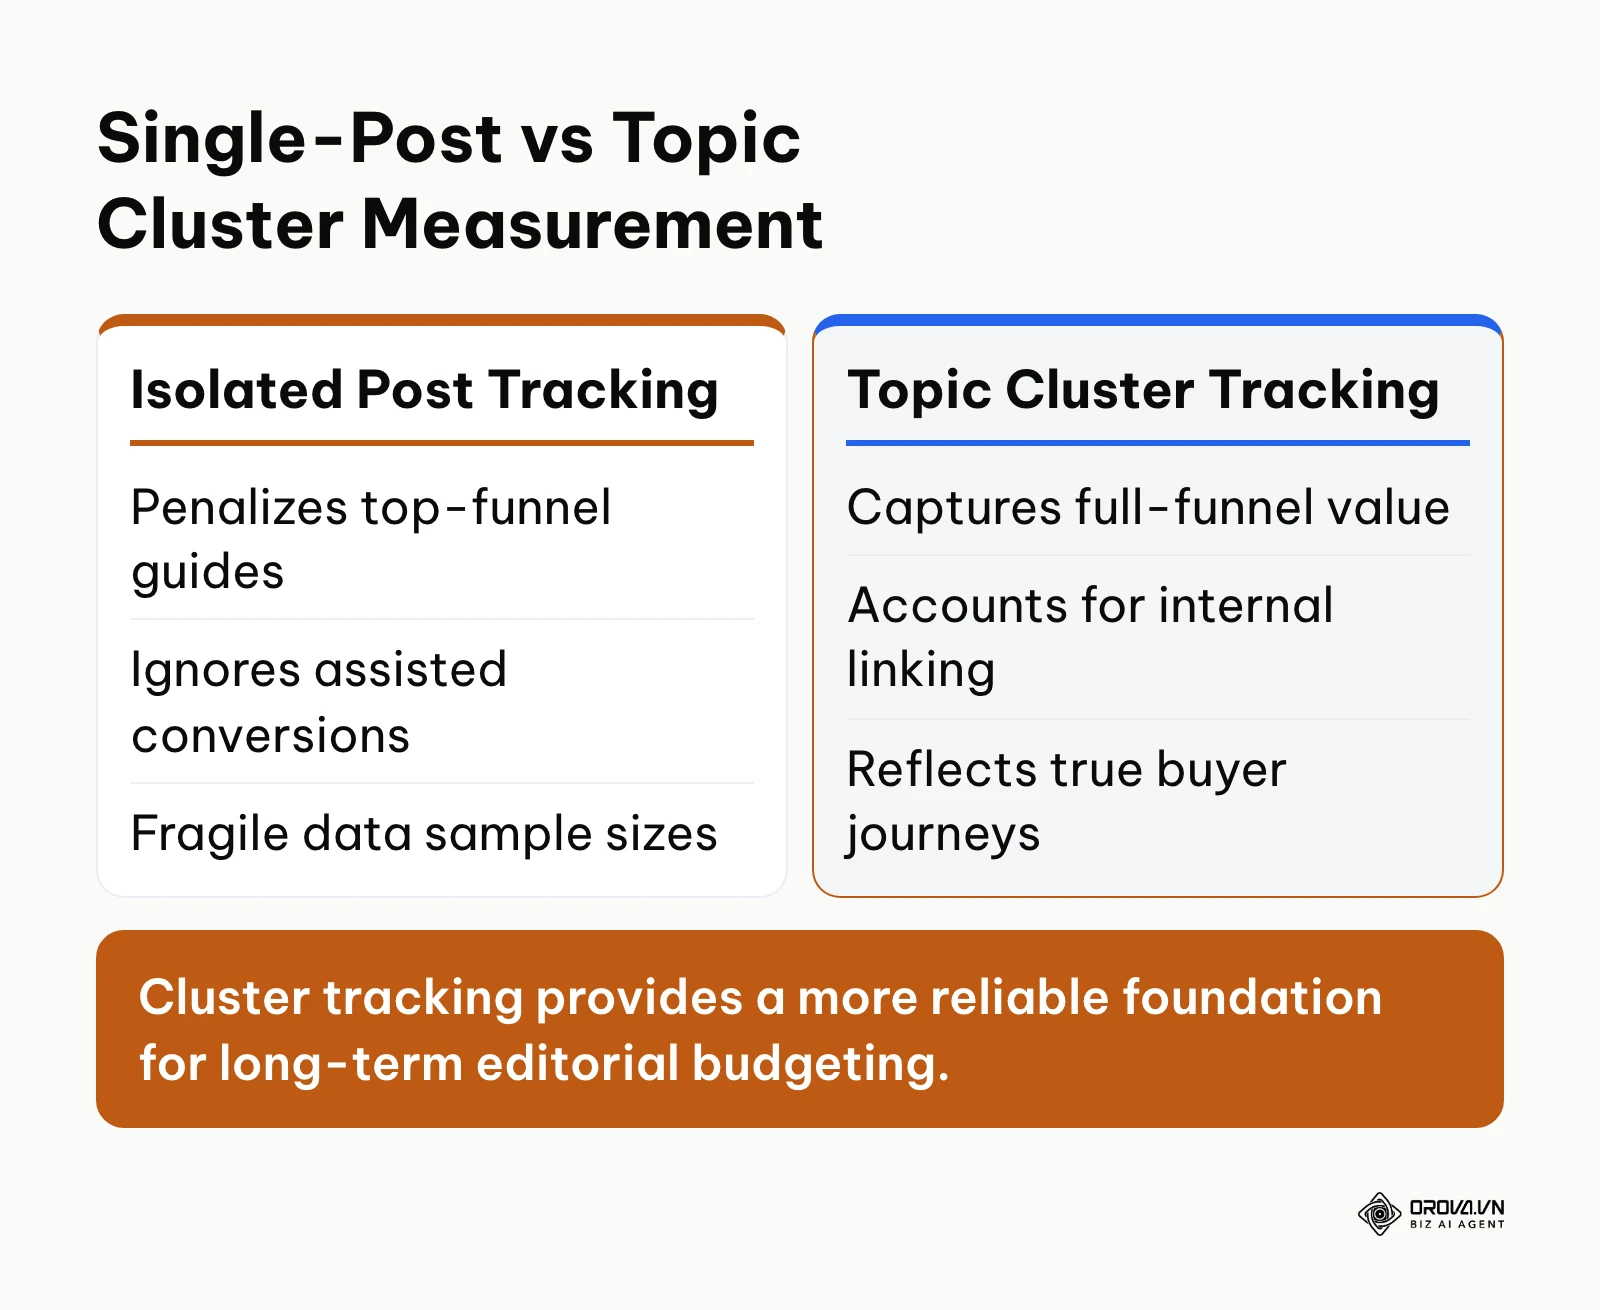
Modern search engine optimization operates on semantic topic clusters rather than isolated keywords. A comprehensive pillar page typically secures high-intent commercial rankings because it is supported by a set of specialized sub-pages linked via deliberate internal site architecture. Measuring the return of each URL in isolation fails because supporting sub-pages rarely generate direct sales form submissions; their value lies in passing topical authority to the central pillar asset.
To measure topic cluster ROI:
- Group URLs within your analytics and CRM software by directory or taxonomy tag (for example, /solutions/cloud-security/*).
- Aggregate total production and maintenance expenditures for all articles within that specific cluster.
- Calculate total direct and assisted revenue generated by every page within the cluster boundary.
- Evaluate cluster profitability as a unified unit, identifying which overarching themes drive the highest customer lifetime value.
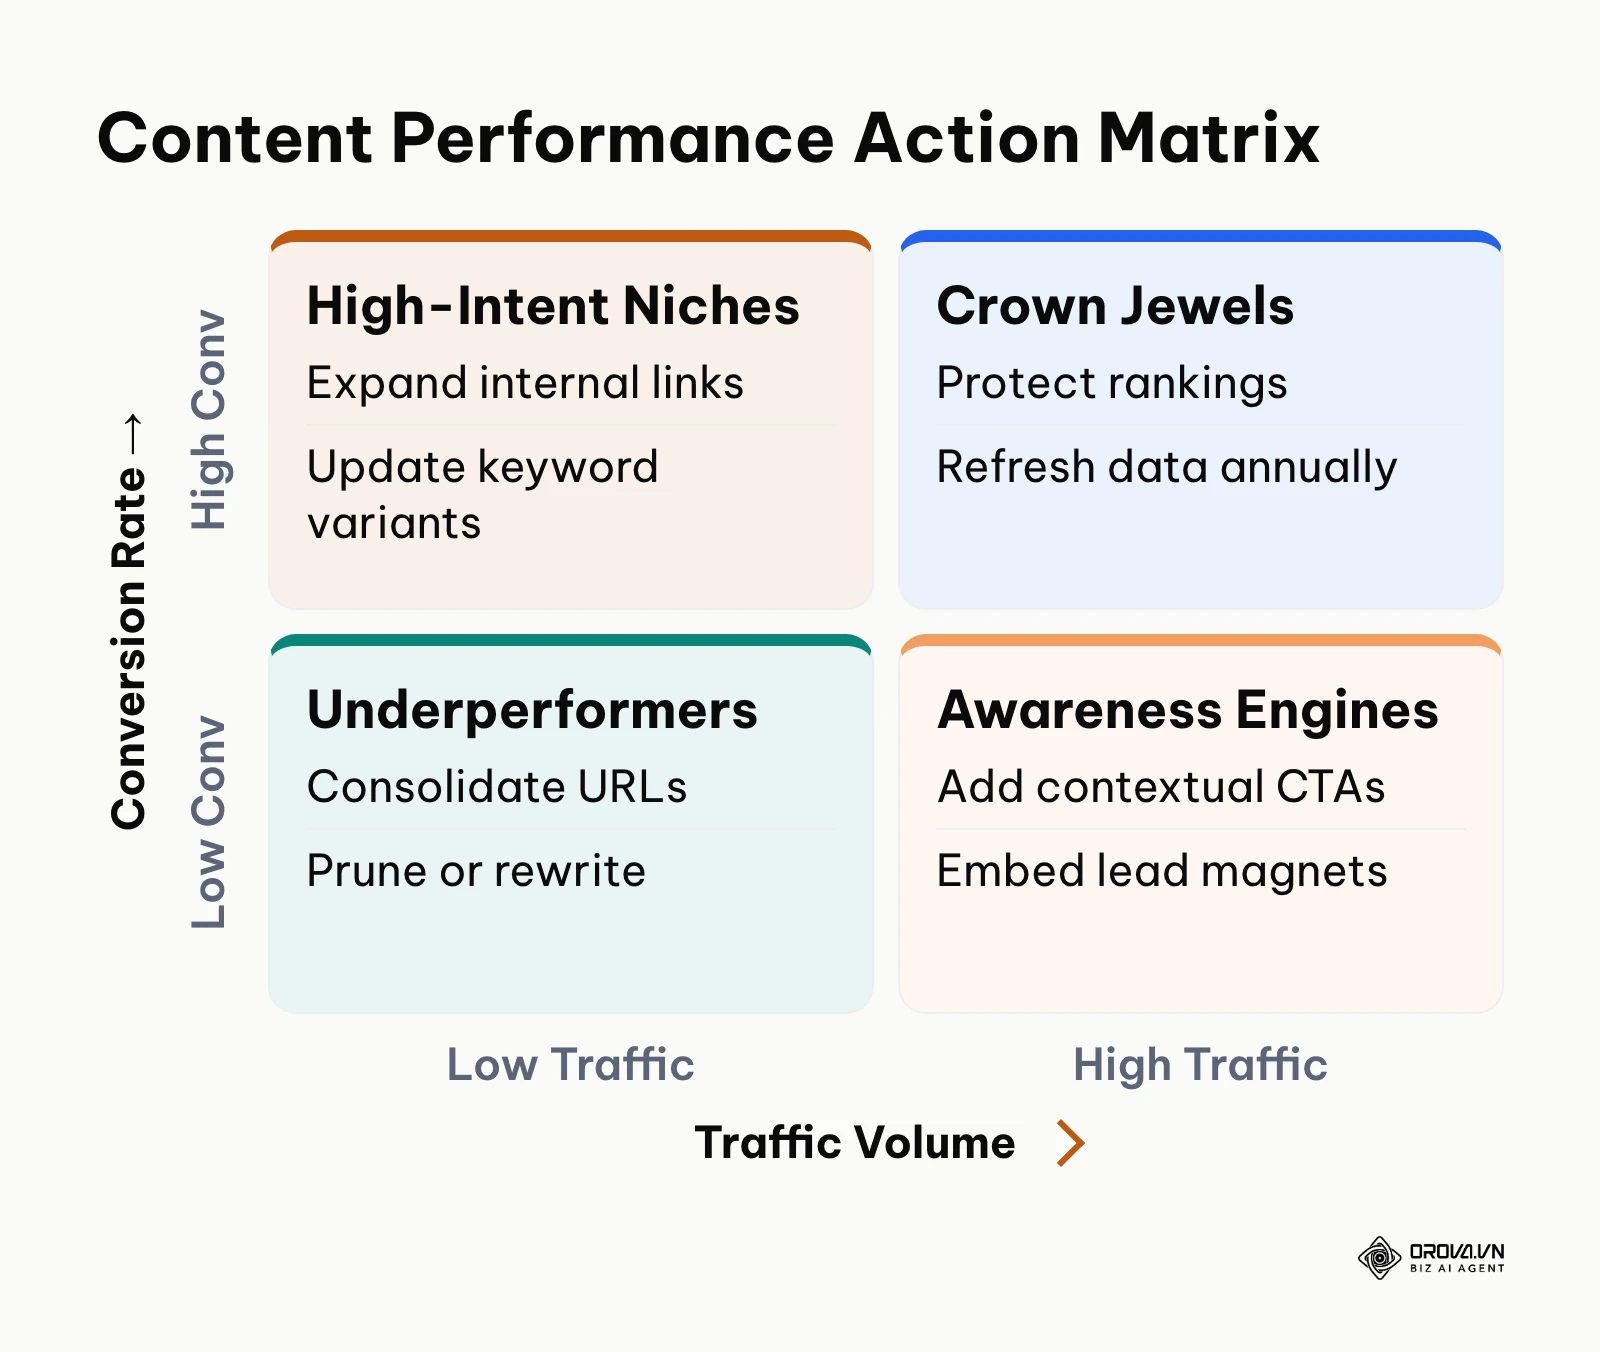
To operationalize cluster performance, plot individual URLs into a four-quadrant performance matrix based on organic session volume and conversion rate:
| Performance Quadrant | Characteristics | Prescribed Strategic Action |
|---|---|---|
| Crown Jewels | High traffic volume and high conversion rate | Protect search rankings, update statistical citations annually, and build additional internal links. |
| High-Intent Niches | Low traffic volume and high conversion rate | Preserve existing copy, expand secondary keyword variations, and distribute across sales enablement channels. |
| Awareness Engines | High traffic volume and low conversion rate | Introduce contextual calls to action, embed targeted downloadable lead magnets, and add internal links pointing to conversion pages. |
| Underperformers | Low traffic volume and low conversion rate | Audit search intent alignment, consolidate thin content into stronger pillar guides, or remove and redirect URLs. |
Depending on your organizational goals, return on investment manifests across several distinct business categories. The table below outlines these variations.
| Content ROI Model | Primary Objective | Key Attribution Metrics | Best Suited For |
|---|---|---|---|
| Direct Pipeline ROI | Generate immediate commercial sales inquiries | Form submissions, demo requests, closed won deal value | B2B SaaS and high-ticket service firms |
| Assisted Pipeline ROI | Support multi-stage customer evaluation paths | First-touch attribution, assisted conversion value | Enterprise solutions with sales cycles over 90 days |
| Customer Retention ROI | Reduce customer churn through education | Product adoption rates, help ticket reduction, expansion revenue | Subscription businesses and client service agencies |
| Organic Share of Voice ROI | Displace paid advertising spend with organic rankings | Organic traffic value, equivalent pay-per-click ad savings | Competitive retail and consumer digital brands |
Example illustration: A vertical SaaS provider specializing in dental clinic practice management maintained sixty blog posts grouped into three distinct subject clusters: clinical scheduling, patient billing, and regulatory compliance. The growth director exported annual organic session volumes and CRM opportunity pipelines, aggregating total production expenditures and won deal values by category subfolder. The team initially encountered distorted revenue data because individual blog posts lacked standardized URL directory tagging, making automated clustering impossible. They resolved the taxonomy issue by establishing clear parent-child directory structures in their CMS and applying custom content groupings inside their analytics platform. The aggregated audit revealed that while the patient billing cluster generated only one-third of the total traffic, it generated four times more closed software subscriptions than the clinical scheduling cluster, leading management to reassign editorial resources toward billing automation topics.
What Different Roles Must Do to Implement Content Marketing ROI Tracking
Establishing a dependable measurement framework requires distinct operational procedures depending on an organization's internal structure and resources. The comparison diagram in this section illustrates the fundamental differences between measuring isolated URLs and measuring unified topic clusters.
Small Business Owners and Bootstrapped Founders
Founders operating with limited personnel must focus exclusively on high-impact conversion tracking without overcomplicating data infrastructure:
- This Week's Task: Audit existing website forms in Google Analytics 4, verifying that every contact or quote submission correctly registers as a key conversion event.
- Implement standardized UTM parameter links across all external promotion channels to prevent paid or social traffic from masquerading as organic search.
- Add a simple self-reported attribution field to contact forms ("Where did you first discover us?") to capture qualitative buyer journeys.
- Review customer inquiries monthly against the initial landing page URL recorded in web analytics to identify which specific articles initiated real sales dialogues.
In-House Content Strategists and Marketing Leads
Marketing leads managing cross-functional teams require institutional alignment across analytics, content production, and CRM pipelines:
- This Week's Task: Review the attribution paths report in GA4 and build a landing-page Exploration filtered to the primary blog directory to identify early-touch assisted conversions.
- Establish a unified content cost tracker that records direct contractor fees alongside estimated internal review hours for every published piece.
- Partner with sales operations to ensure CRM lead records retain initial landing page URL and campaign parameters through the entire sales pipeline.
- Establish quarterly content audits that categorize articles into the four-quadrant performance matrix to guide editorial budget reallocation.
Marketing Agencies and Independent SEO Consultants
Agency professionals must prove client commercial value to protect retainer contracts and demonstrate clear accountability:
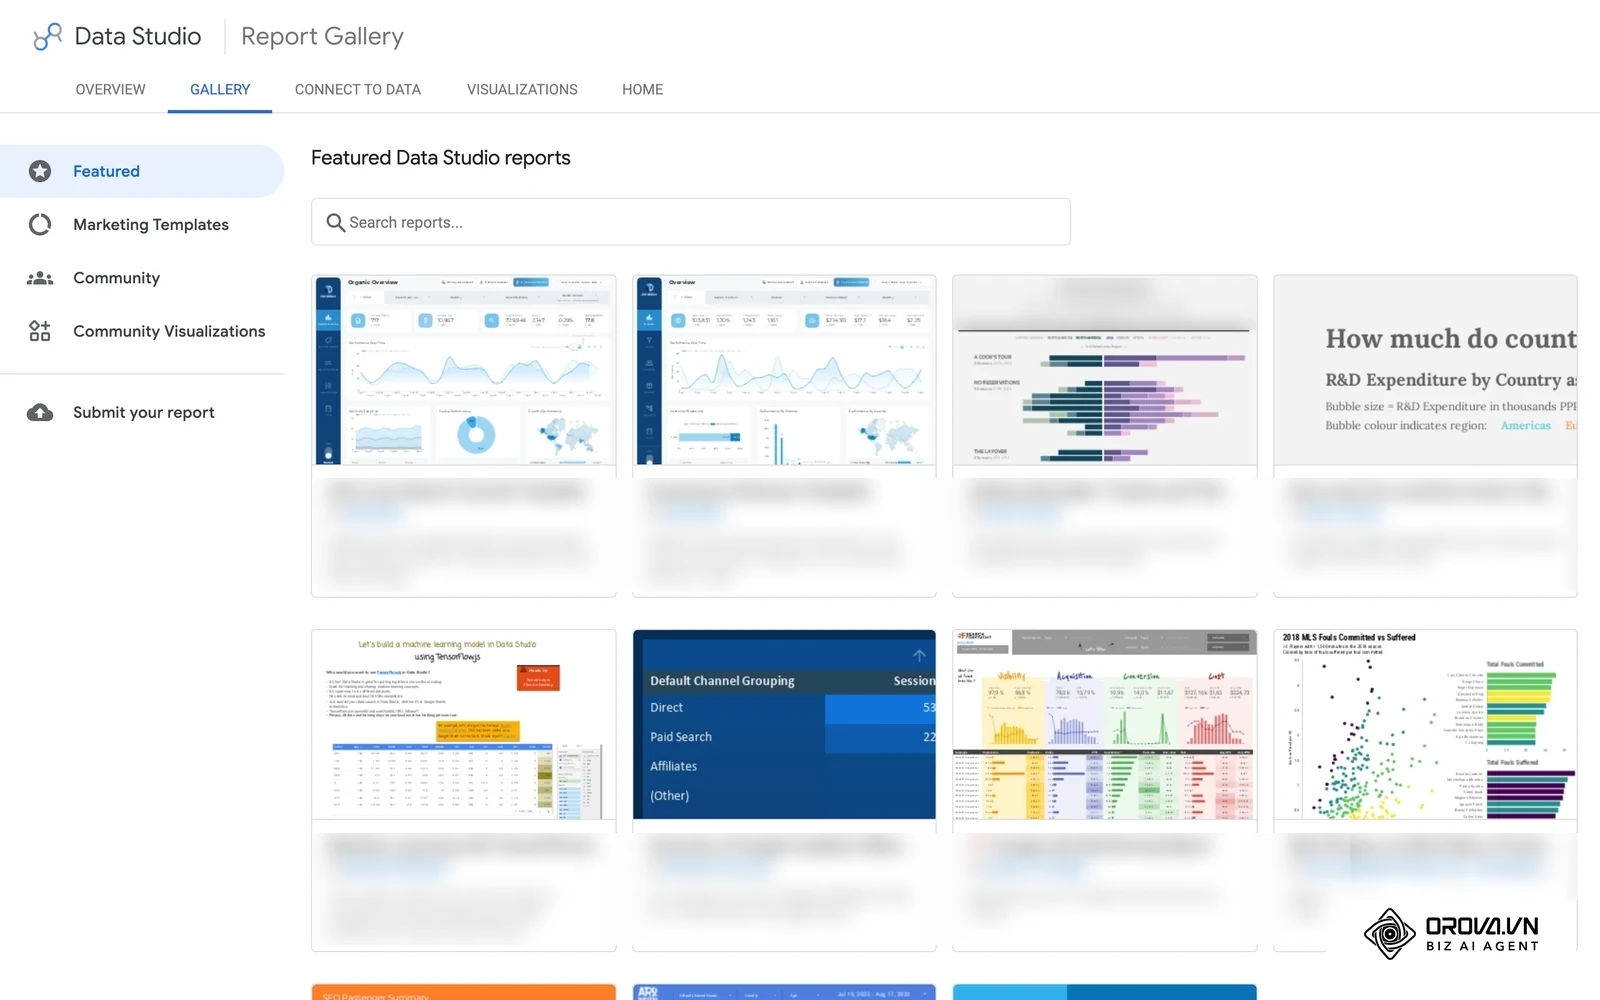
- This Week's Task: Build a customized Looker Studio dashboard that maps client organic landing pages directly to goal conversion events and estimated pipeline values.
- Transition client reporting decks away from pure organic traffic graphs toward multi-touch attribution and assisted conversion totals.
- Establish baseline customer acquisition costs with client stakeholders prior to launching new topic clusters to set realistic financial benchmarks.
- Present compounding asset amortization schedules during annual reviews to demonstrate how historical client retainers continue to produce recurring pipeline value.
| Common Implementation Mistake | Immediate Business Consequence | Corrective Prevention Strategy |
|---|---|---|
| Relying solely on last-click attribution | Top-of-funnel educational articles are canceled because they appear to produce zero revenue. | Implement GA4 data-driven attribution and monitor assisted conversion paths. |
| Omitting internal staff and tool costs | Baseline expenses appear artificially low, leading to unrealistic ROI projections that finance rejects. | Calculate fully loaded costs, including internal salaries, design hours, and software subscriptions. |
| Evaluating content on 30-day windows | Content programs are terminated before search indexing matures and organic ranking stabilizes. | Establish twelve-month evaluation horizons and amortize initial production costs over three years. |
| Tracking pageviews without CRM integration | Marketing teams report large traffic gains while company sales pipelines continue to decline. | Connect web analytics conversion events directly to closed CRM opportunity records. |
With OROVA.VN and the OROVA SEO module, you put an end to the exhausting days of manual work for good. Instead of struggling for hours to write articles and compile reports, the entire process is now optimized and completed in just 5 minutes.
Future Trends in Content Marketing ROI: The Author's Perspective
Looking at the trajectory of search infrastructure as of 2026, content attribution models face unprecedented structural changes. Below are three specific developments that I believe will redefine how organizations calculate editorial returns over the next two to three years.
The Shift from Organic Pageviews to AI Citation Authority
Today, search engines increasingly synthesize direct conversational answers, reducing outbound click-through rates on broad informational topics. I argue that within the next two to three years, traditional organic pageviews will cease to be a dependable indicator of top-funnel content health. Instead, return on investment will be determined by whether an organization's proprietary data is cited as a trusted source inside generative answer engines. Marketers should prepare now by producing original research, proprietary survey benchmarks, and structured data that generative engines must cite as foundational evidence. This perspective could prove incorrect if major search engines adopt revenue-sharing syndication models or implement universal pay-per-click monetization inside conversational responses.
First-Party CRM Integration Replacing Client-Side Tracking
The ongoing erosion of third-party tracking cookies and browser privacy restrictions has degraded traditional client-side multi-touch modeling. I believe that within thirty-six months, commercial content measurement will rely almost exclusively on server-side tracking connected directly to closed-loop CRM revenue records. Organizations that fail to tie content consumption to authenticated user identifiers will lose visibility into buyer journeys. Marketing leaders must prepare by implementing robust UTM taxonomy standards and integrating lead scoring software with CRM pipelines today. This expectation could be invalidated if unified, privacy-preserving browser attribution standards gain universal cross-platform adoption.
The Financial Collapse of Commodity Content Production
The proliferation of automated generative tools has flooded web indexes with generic informational articles, causing their search rankings to deteriorate rapidly. In my view, the return on investment for generic glossary guides and high-level how-to posts will drop below zero as production costs exceed diminishing traffic returns. Companies should pivot resources immediately toward bottom-funnel product comparisons, customer case studies, and specialized technical problem-solving. This projection could prove false if algorithmic search updates fail to reward authentic domain expertise and continue rewarding sheer publishing volume.
Frequently Asked Questions About Measuring Content Marketing ROI
Is measuring content marketing ROI still necessary with generative AI?
Yes, because while generative artificial intelligence lowers the cost of drafting text, it does not guarantee commercial pipeline creation. Calculating return on investment becomes even more critical when production volumes surge, as organizations must verify whether published assets generate qualified pipeline or merely consume indexing overhead. Measuring financial impact separates profitable subject matter authority from unrewarded generative noise.
How should you account for a two-year-old blog post that continues to generate sales?
Historic content assets that generate revenue should be evaluated using an amortized capital expenditure model rather than attributing original production costs entirely to the current calendar year. By allocating initial creation costs across a multi-year depreciation schedule and accounting only for annual content refresh expenses, teams reflect true compounding asset returns. This approach prevents mature organic content from artificially inflating current-period production budgets.
How can you view assisted conversions for specific blog posts inside Google Analytics 4?
Inside Google Analytics 4, open the Advertising section and the paths report under Attribution to see where Organic Search sits in each conversion path as an early, mid or late touchpoint. To narrow this to specific articles, build an Exploration with the landing page dimension filtered to your editorial subfolder, such as /blog/, and compare key events and revenue per article.
When does an organic SEO content campaign typically reach its breakeven point?
There is no universal month: breakeven depends on how fast articles rank, your conversion rates and your deal size. The first months typically represent net negative cash flow because production and technical optimization costs come before search rankings mature, so track cumulative revenue against cumulative cost each month and mark the month the line crosses zero. Once articles secure top organic positions and accumulate domain authority, recurring traffic converts into qualified pipeline without proportional increases in marginal cost.
How do you measure content marketing ROI when the B2B sales cycle exceeds six months?
When sales cycles span several quarters, organizations must establish leading pipeline milestone metrics alongside closed revenue calculations. Track initial marketing qualified leads, pipeline opportunity value, and sales stage progression attributed to specific content assets within your CRM. Once deals close, reconcile historic first-touch and multi-touch touchpoints against final contract values to calculate realized financial return.
What is considered a strong benchmark for B2B content marketing ROI?
Returns vary too much by industry, deal size and sales cycle for a single benchmark to be reliable. A more useful benchmark is your own: compare content ROI with the return of your paid channels over the same period, and track whether cumulative content ROI rises year over year. Programs with weak returns usually suffer from high production overhead, poor conversion paths, or topics with little commercial intent.
Where Should You Start to Measure Content Marketing ROI?
Initiating a structured measurement framework does not require purchasing enterprise attribution software immediately. The correct starting point depends on your organization's current analytics maturity. The summary roadmap in this section highlights the foundational steps required to transition from vanity metrics to commercial attribution.
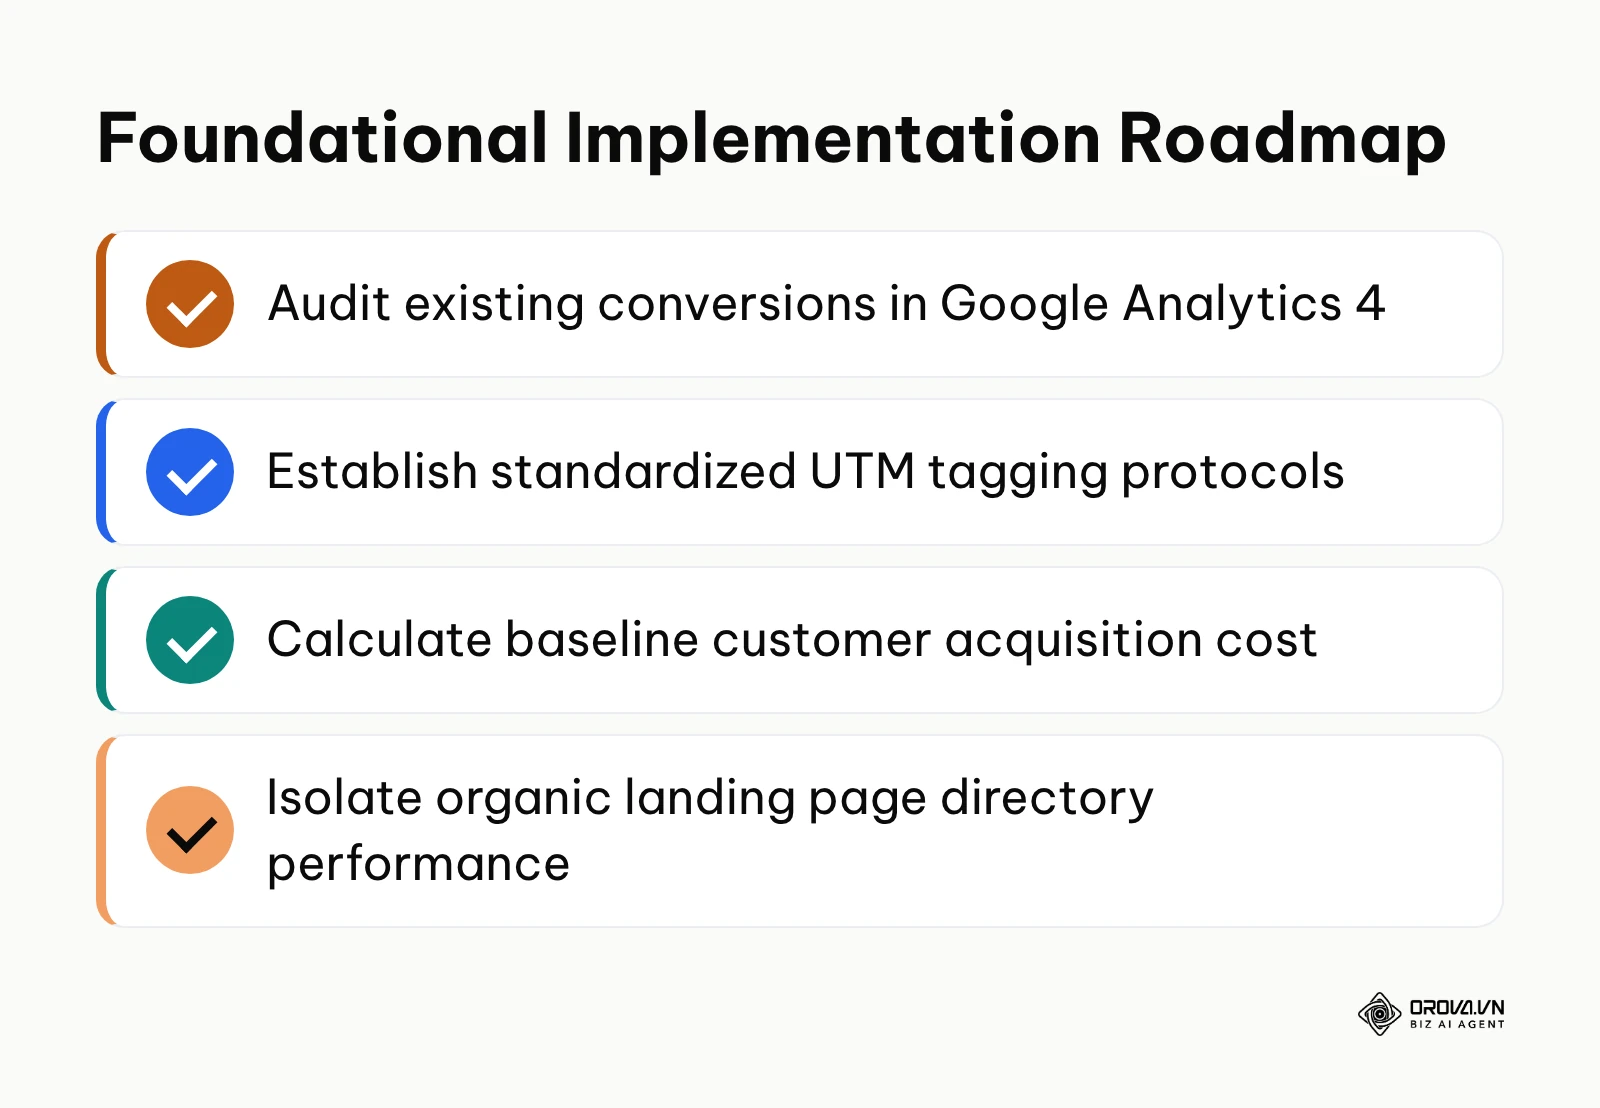
If you are starting from scratch with no analytics infrastructure, your single immediate priority for this afternoon is configuring Google Analytics 4 conversion events for your primary lead generation forms. Define clear event triggers for demo requests, pricing page visits, and contact inquiries, ensuring that every submission records the landing page URL where the visitor began their session.
If you already collect data but your tracking systems remain fragmented across disconnected tools, your afternoon objective is establishing a standardized UTM parameter tracking sheet. Create consistent naming conventions for content campaigns, mediums, and source tags so that every inbound link distributed across social channels, email newsletters, and partner websites feeds structured attribution data directly into your customer relationship management system.
If your team actively publishes high volumes of editorial content without financial measurement, your immediate task is conducting a content revenue audit on your top ten highest-traffic URLs. Cross-reference the organic landing pages of your most popular articles with your sales pipeline records to identify which specific pieces have contributed to qualified customer conversations over the past six months.
Establishing these baseline practices creates the empirical foundation necessary to eliminate speculative marketing expenses. Whether you are building your initial analytics stack or restructuring an existing departmental budget, taking that first concrete step today will permanently transform how your organization evaluates and succeeds when you measure content marketing roi.
About the author

Builder of Orova
Nguyễn Đỗ Trọng Ân has 8 years of experience in marketing, including 6 years managing market development across Asia. He builds Orova, a Biz AI Agent that never sleeps: it plans, runs and optimizes work for businesses.
Run your business with AI Agents
Orova is the always-on Biz AI Agent — it plans, runs, and optimizes the work for you.
Save time, unlock productivity.