
How to calculate engagement rate: formulas, worked examples, and clean data

You are staring at a monthly performance report, trying to figure out if your content actually resonated with your audience or if it just existed in the void. You see thousands of likes on the dashboard, but website traffic has not moved, and sales remain flat. This frustrating disconnect happens because most marketers rely entirely on default platform metrics instead of knowing exactly how to calculate engagement rate for their specific business objectives. Relying on basic follower counts or blended metrics provided by native apps often paints a wildly inaccurate picture of your campaign success. When your baseline denominator is flawed, your entire marketing strategy is built on unstable ground.
The short answer: add up the engagements on a post (likes, comments, shares, and saves), divide that total by the post's reach, and multiply by 100. A post with 500 engagements and a reach of 10,000 has an engagement rate of (500 ÷ 10,000) × 100 = 5%. The rest of this guide covers which denominator to choose, how to clean the data first, and how to handle video and multi-platform campaigns.
The digital landscape has fundamentally shifted. Gone are the days when a chronological feed guaranteed that your carefully crafted message would be seen by the people who explicitly opted in to follow you. Today, we operate in an era of algorithmic curation, where content is served based on predictive behavioral models rather than simple subscription graphs. In this environment, surface-level vanity metrics—such as total follower count or raw accumulated likes—are not just unhelpful; they are actively deceptive. They create an illusion of momentum while masking underlying stagnation. If your leadership team is making budgetary decisions based on these inflated, uncalibrated numbers, they are effectively flying blind.
This comprehensive, analytical guide will show you the exact formulas used by professional data analysts, explain how to scrub your data of bot traffic, and give you a spreadsheet layout you can copy. We will explore the nuances of measuring short-form video accurately and how to present these numbers to executives without causing confusion. Furthermore, we will delve into the advanced methodologies required to separate passive consumption from active intent, ensuring that every marketing dollar you spend can be definitively tied back to genuine audience interest and, ultimately, commercial outcomes. By mastering these calculations, you transform yourself from a passive reporter of platform data into a strategic architect of audience growth.
How to Calculate Engagement Rate: The Core Definition
Calculating the engagement rate is the process of measuring the level of interaction a piece of content receives relative to the size of the audience that had the opportunity to see it. It tells you what percentage of your audience found your content compelling enough to take a measurable action, rather than just scrolling past it. This metric is primarily used by social media managers, content strategists, and digital analysts to evaluate content quality, guide creative decisions, and prove the return on investment for organic marketing efforts.
The Evolution of Engagement Metrics
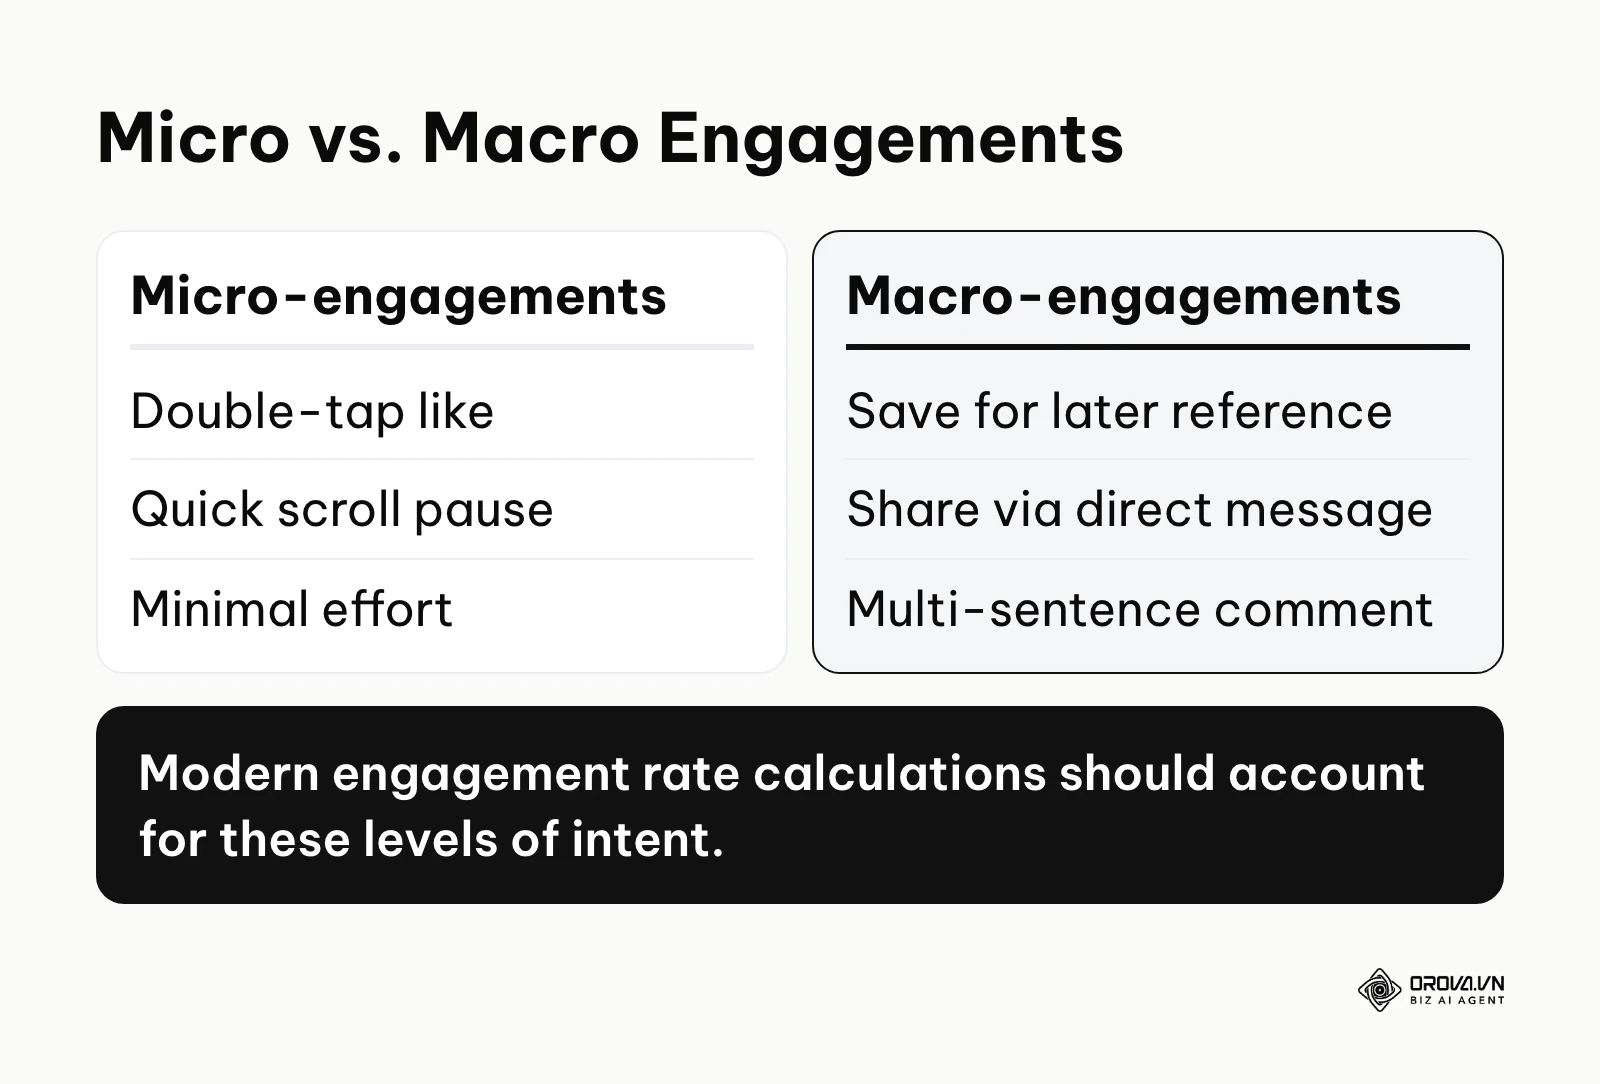
Historically, engagement was a simple tally. If you posted a photo and it received one hundred likes, that was the engagement. However, as platforms evolved to prioritize user retention, the definition of an "interaction" expanded dramatically. Today, engagement encompasses a complex spectrum of user behaviors. It includes micro-engagements, which require minimal cognitive effort (like a double-tap or a quick scroll pause), and macro-engagements, which signal high intent and deeper psychological investment (such as saving a post for later reference, sharing it via direct message, or leaving a multi-sentence comment). Modern engagement rate calculations must account for these varying levels of intent to provide a true picture of content resonance.
Why the Denominator Matters
The fundamental principle of any rate calculation is the relationship between the numerator (the actions) and the denominator (the baseline audience). The core definition of engagement rate is heavily dependent on how you define that baseline. If you define it as your total follower count, you are measuring your content's performance against a largely hypothetical audience—many of whom may be inactive, algorithmic ghost accounts, or simply not logged in on the day you posted. Conversely, if you define the denominator as reach (the unique number of screens your content actually appeared on), you are calculating a much more precise and actionable metric: out of the people who actually saw this, how many cared?
You should rigorously calculate this rate when testing new content formats, running community-building campaigns, or evaluating influencer partnerships. However, if your campaign's sole objective is pure brand awareness—where simply being seen by as many people as possible is the goal—obsessing over the interaction percentage might distract you from optimizing for maximum reach. In those specific scenarios, raw impressions hold more weight than the engagement formula. Understanding the delicate balance between reach optimization and engagement optimization is the hallmark of a mature digital strategy.
What You Need Before Measuring Engagement
Before you start plugging numbers into a calculator, you must gather the right raw data. Trying to calculate metrics using surface-level public numbers will lead to inaccurate reporting. You need backend access to extract the granular details of your post performance. Furthermore, you need to establish a Data Governance protocol within your team to ensure that everyone pulling numbers is using the exact same definitions and extraction windows.
Establishing a Single Source of Truth
One of the most common reasons marketing teams fail to calculate engagement accurately is internal data fragmentation. The social media manager might be looking at native mobile app insights, the performance marketer might be looking at Google Analytics conversions, and the agency partner might be using a third-party scraping tool. Before any math occurs, you must designate a Single Source of Truth (SSOT). This means deciding exactly which dashboard or export file serves as the official record for the company. If you are still deciding where those numbers should come from, our buyer's framework for social analytics tools walks through the options by team size.
| Required Item | Where to Get It | Time Needed to Prepare | Why It Is Essential for Accuracy |
|---|---|---|---|
| Native Platform Analytics Access | Facebook Business Suite, Instagram Professional Dashboard, LinkedIn Page Analytics | 5 minutes to locate and export CSV files. | Third-party tools often face API delays or rate limits. Native backend data provides the most unfiltered, raw numbers regarding reach and saves. |
| Definition of "Engagement" | Internal team agreement (decide if clicks count, or just social actions like comments) | 15 minutes of team alignment. | Prevents metric inflation. If one team member counts link clicks and another doesn't, your month-over-month comparisons become mathematically invalid. |
| Historical Baseline Data | Previous monthly reports or a scrape of the last 90 days of content | 30 minutes to aggregate past performance. | Engagement rates are relative. A 2% rate is meaningless unless you know your historical average was 1.2% (a massive win) or 4.0% (a severe drop). |
| Clear Campaign Objectives | Marketing brief or strategy document | Varies; must be established before measurement. | Determines whether you should optimize for shares (virality) or saves (educational retention) within your overall formula. |
| Spreadsheet Software | Microsoft Excel, Google Sheets, or Apple Numbers | Instant availability. | Allows you to manipulate raw CSV dumps, build pivot tables, and apply automated formulas across thousands of data rows instantly. |
| Unified Extraction Window | Team calendar or reporting schedule | 5 minutes to set a recurring calendar invite. | Post metrics change daily. Extracting data exactly 7 days after publication ensures every post is measured on an equal, normalized timeline. |
Gathering this information ensures that when you apply an engagement rate calculator by reach or followers, your inputs are pristine. Without this preparation, your final percentages will be meaningless figures that cannot guide business decisions. You cannot build a structurally sound analytical house on a foundation of messy, misaligned data.
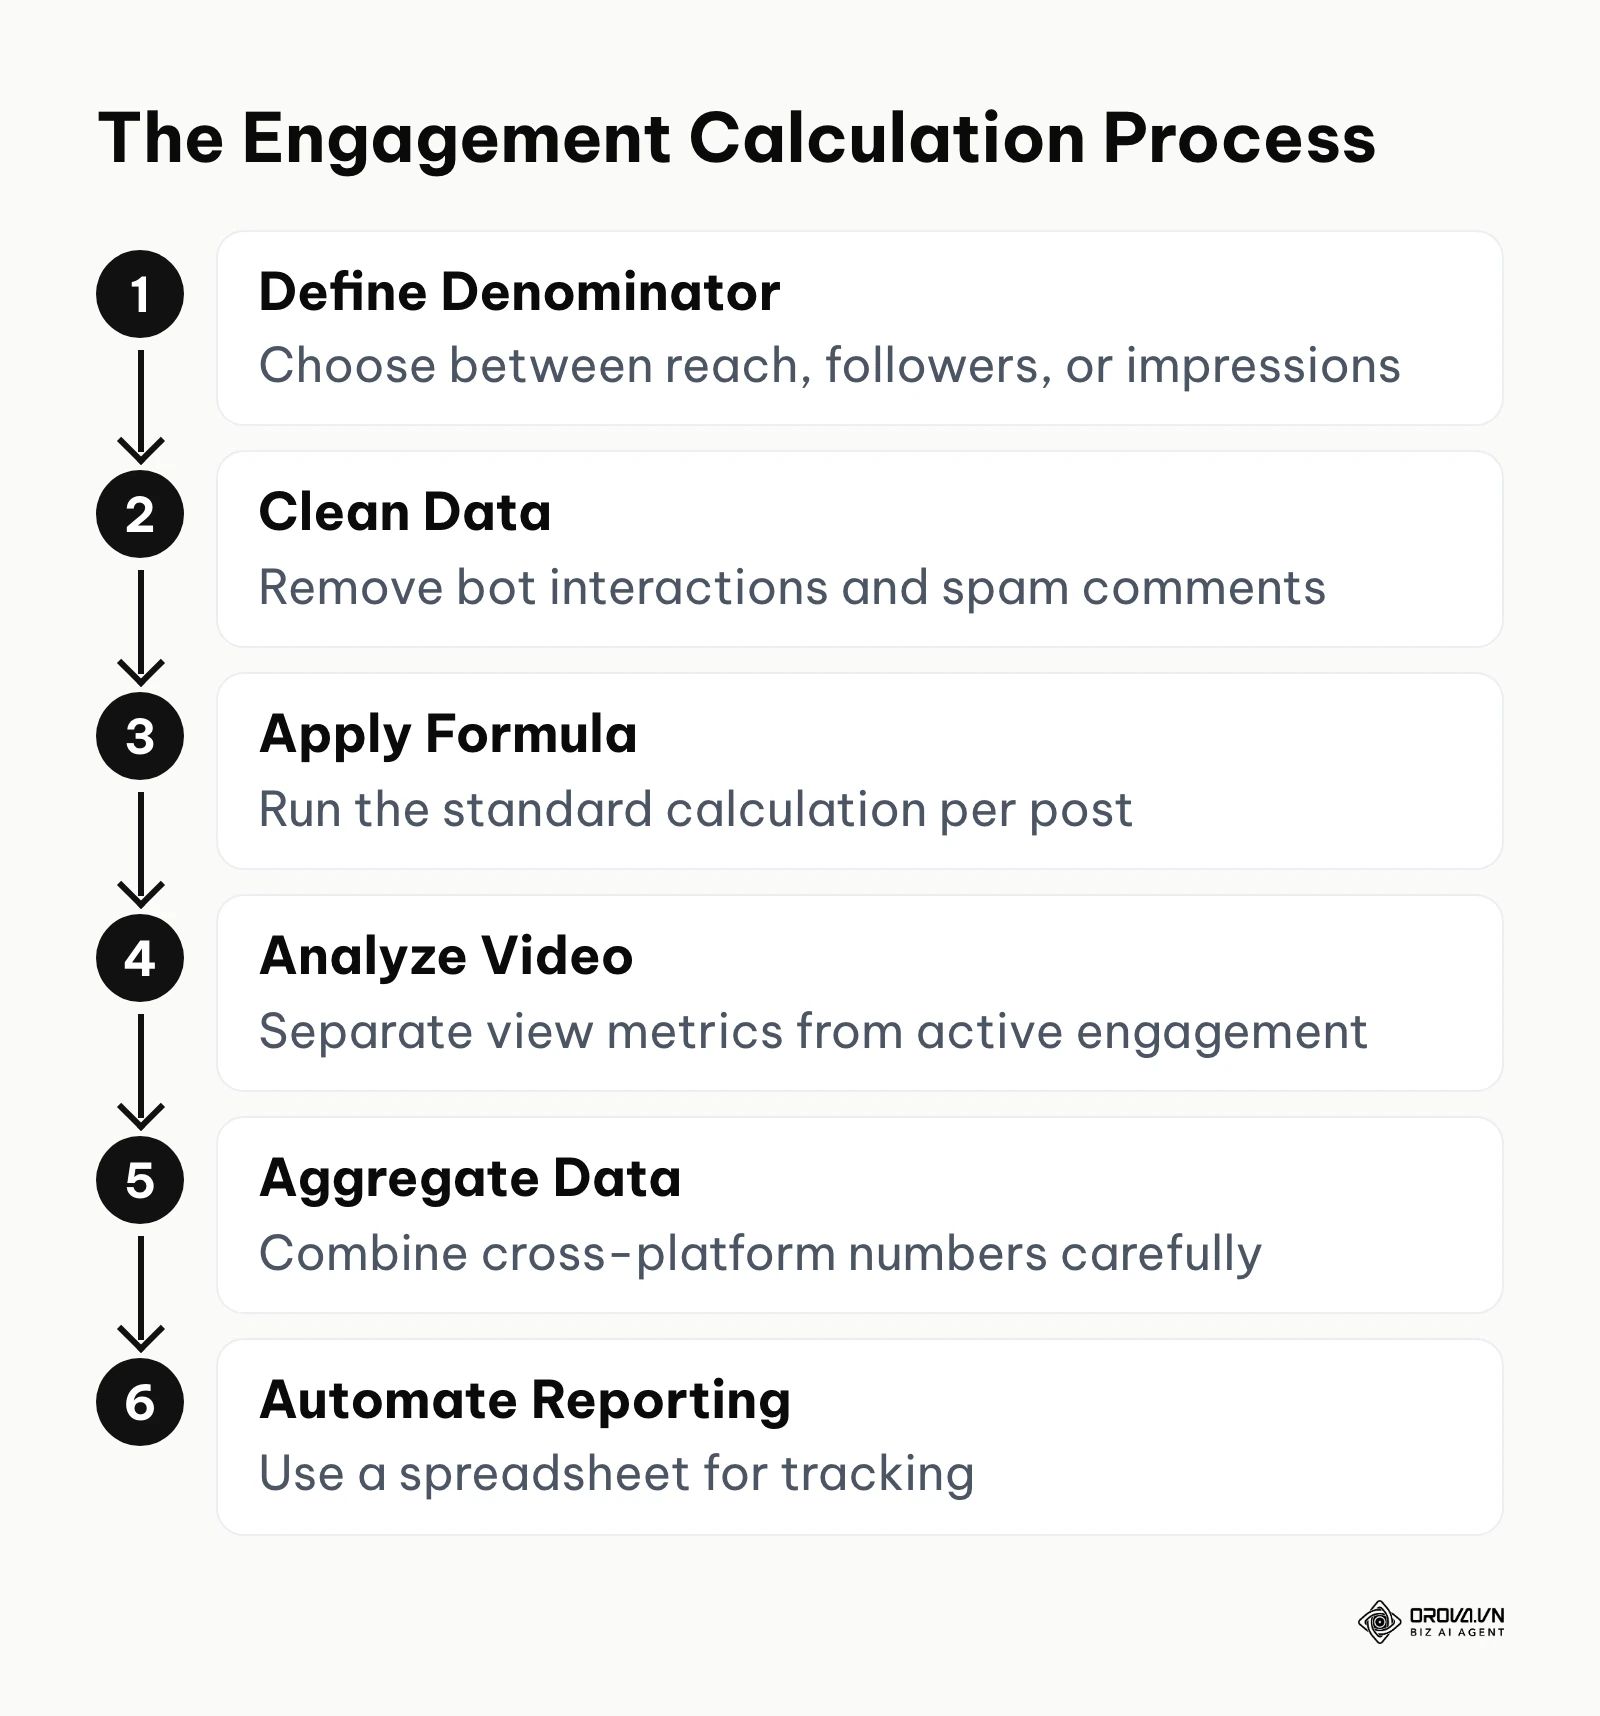
6 Steps to Calculate Engagement Rate Accurately
The process of determining your true engagement requires more than just looking at a dashboard. It demands a systematic approach to data selection, cleaning, and mathematical application. Skipping any of these steps results in "dirty data" that can severely mislead your strategic planning.
Step 1: Define Your Denominator (Reach vs. Followers vs. Impressions)
The most critical decision in your calculation is choosing the number that sits at the bottom of your fraction. The three common choices are Followers, Reach, and Impressions. This choice fundamentally alters the resulting percentage and the narrative you present to leadership.
Using Followers assumes your entire audience sees every post, which is factually incorrect due to algorithmic limitations: on most established platforms, only a fraction of your followers see any given organic post. Using Impressions counts every single time the post appeared on a screen, meaning one highly active user who scrolled past your post four times will count as four impressions, artificially inflating the denominator and diluting your final rate.
Using Reach counts the unique individual accounts that saw the post. For most analytical purposes, Reach is the most accurate representation of your actual audience size for a specific piece of content. It answers the crucial question: "Of the unique human beings who were exposed to this message, what percentage cared?" You must decide on one denominator and use it consistently across all your reports; switching between them month-to-month will invalidate your historical comparisons and destroy data continuity.
Step 2: Clean Your Data (Removing Spam and Bot Interactions)
Raw data exports often contain inflated numbers due to automated bot activity, spam accounts, and coordinated "engagement pods." If a post receives one hundred comments, but fifty of them are bots promoting cryptocurrency scams or fake luxury watches, your raw engagement rate will look artificially high. This gives you a false sense of success while yielding zero commercial value. Inflated numbers also weaken the trust signal that genuine engagement sends to new visitors; our playbook on social proof and conversions explains why that signal only works when it is real.
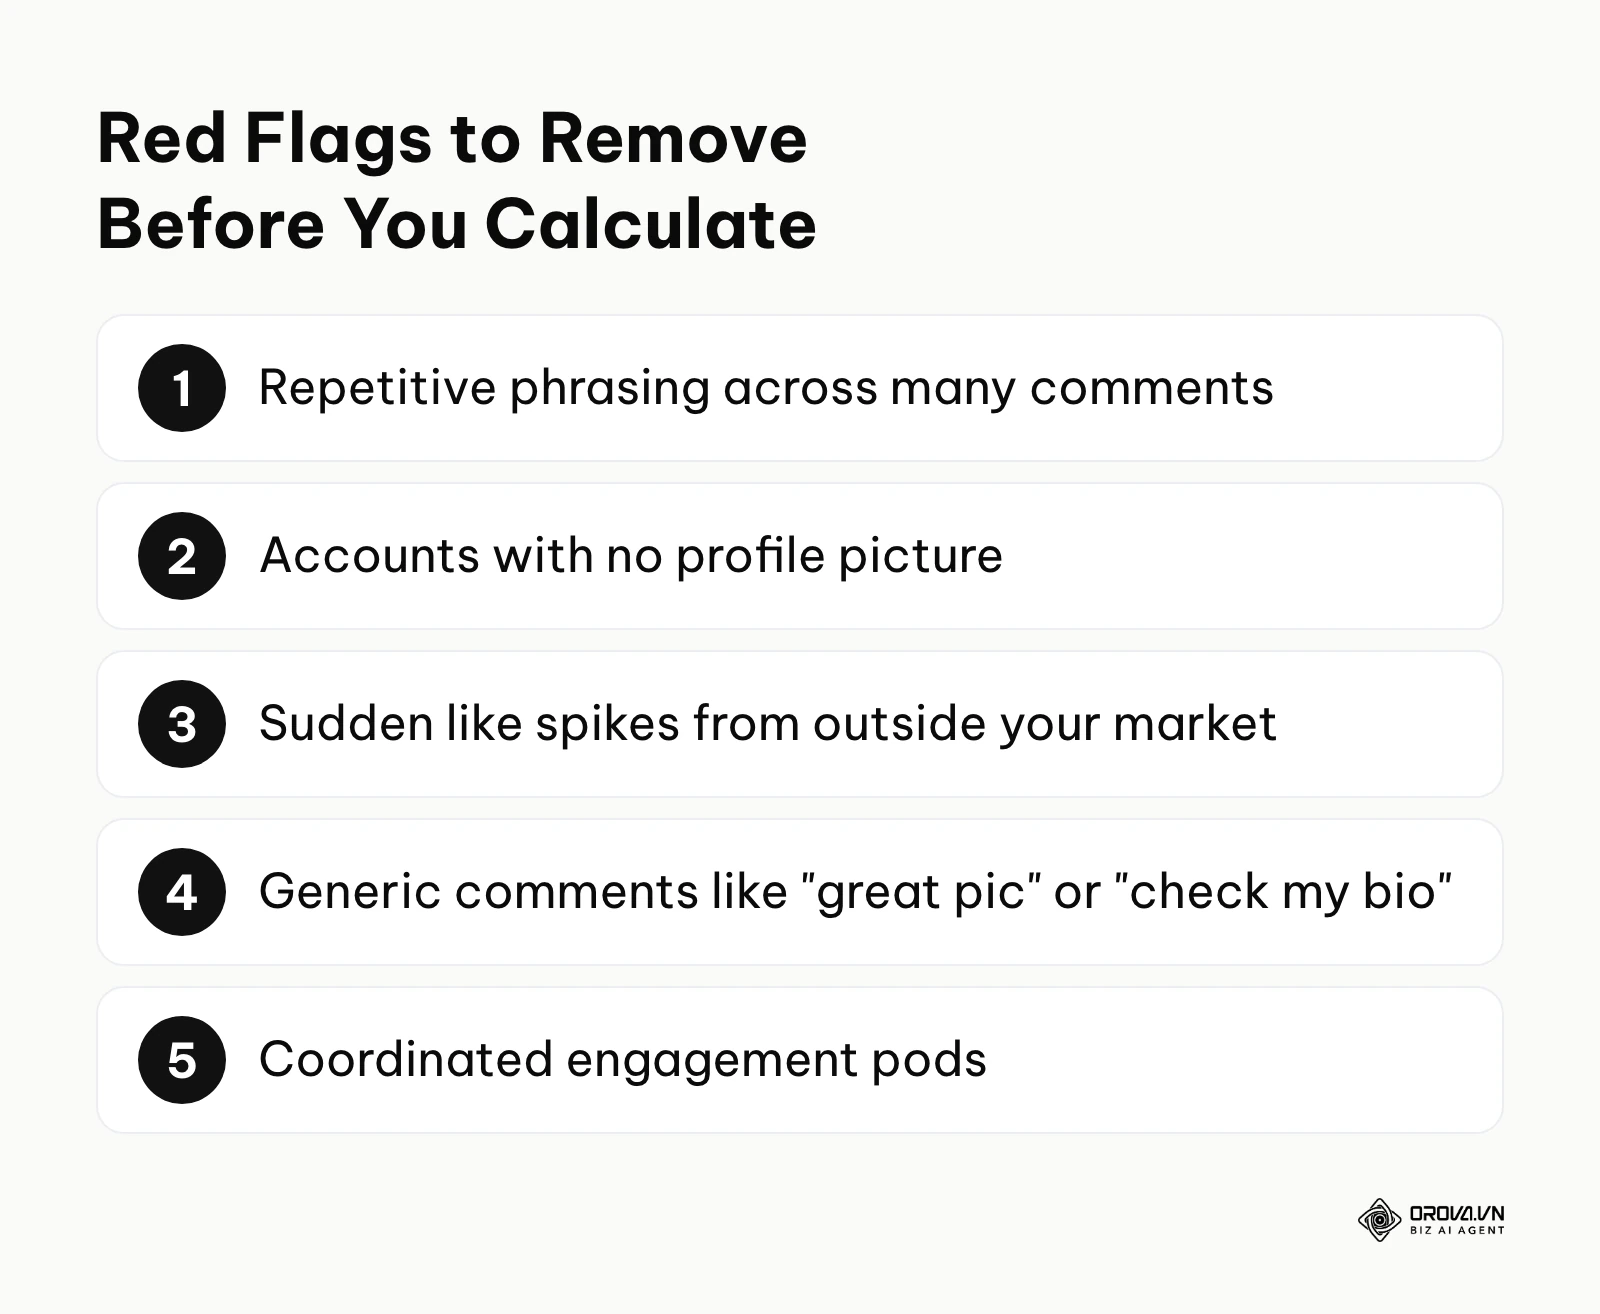
To clean your data, you must manually or programmatically filter out these low-quality interactions before applying your formula. Look for repetitive phrasing, comments from accounts with no profile pictures, and sudden, inexplicable spikes in likes from geographic regions entirely outside your target market or shipping zones.
Illustrative example: You are managing the social presence for a regional B2B software company.
- Context: You noticed a sudden spike in comments on a highly technical post about healthcare data compliance. The raw engagement rate jumped from 3% to 11% overnight.
- Steps taken: You exported the comment data to a spreadsheet. You applied a text filter and geographic overlay to highlight comments. You discovered that about three-quarters of the interactions came from accounts far outside the company's service area leaving generic comments like "great pic" or "check my bio," which are entirely unrelated to the B2B topic. You deleted these rows from the total interaction count.
- Hurdle and fix: It was time-consuming to manually check every user, and the client was initially thrilled with the 11% rate. You fixed this by setting up keyword moderation rules on the platform to automatically hide these comments in the future, preventing them from hitting the analytics dashboard. You then had to carefully explain the data cleanup process to the client to manage expectations.
- Result: Removing roughly three-quarters of the interactions brought the rate from 11% down to about 2.8% (11% × 0.25 ≈ 2.8%). The adjusted figure was lower, but it sat in line with the account's usual baseline and with the modest number of qualified leads the website received that week.
Step 3: Apply the Standard Engagement Rate Formula
Once your data is clean and your denominator is chosen, you can run the math. The most widely accepted formula is the Engagement Rate by Reach (ERR).
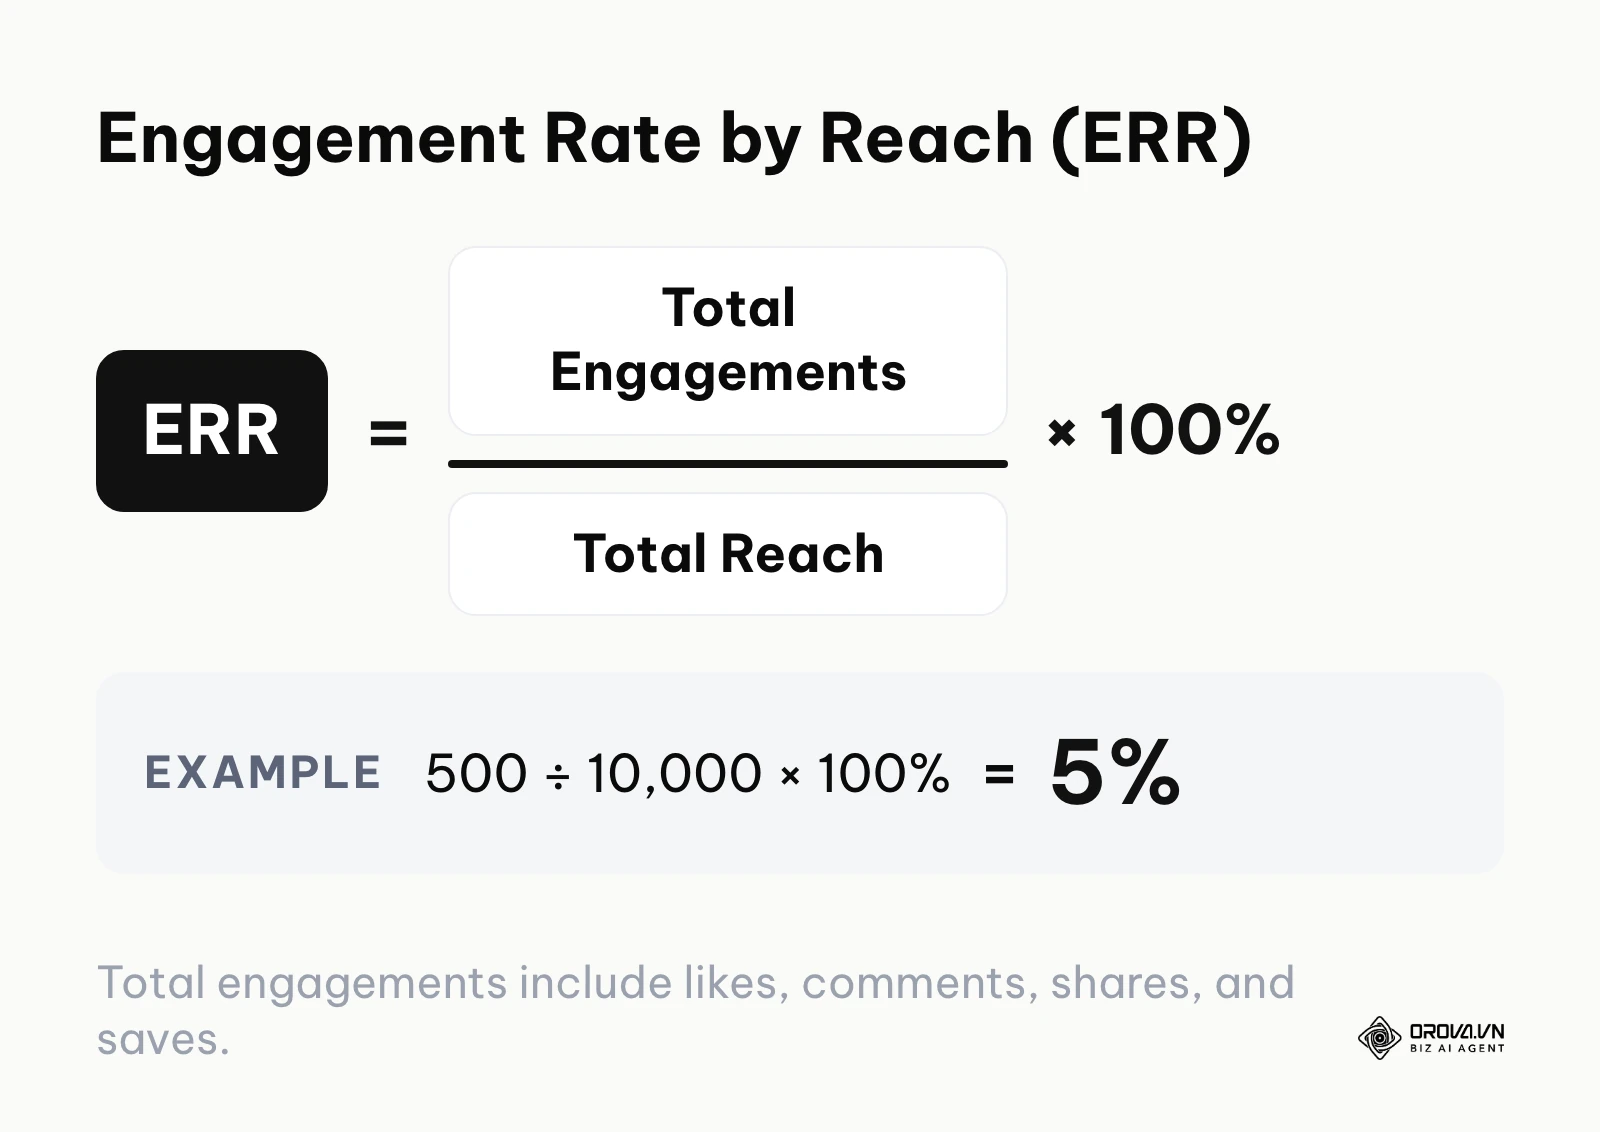
The basic formula is: (Total Engagements ÷ Total Reach) × 100 = ERR Percentage
Total engagements encompass the sum of likes, comments, shares, saves, and in some cases, profile clicks or link clicks, depending on your internal definitions. To execute this, take the sum of those actions, divide it by the unique reach number provided by the platform, and multiply by one hundred to get a readable percentage. Worked example: a post with 380 likes, 50 comments, 30 shares, and 40 saves has 500 total engagements. With a reach of 10,000, the ERR is (500 ÷ 10,000) × 100 = 5%. A common error at this step is forgetting to multiply by one hundred, resulting in a confusing decimal like 0.05 instead of 5%.
The same numerator works with the other two denominators, so you can see how much the choice changes the result:
- Engagement Rate by Followers (ERF): (Total Engagements ÷ Followers) × 100. If the account has 25,000 followers, the same post scores (500 ÷ 25,000) × 100 = 2%.
- Engagement Rate by Impressions (ERI): (Total Engagements ÷ Impressions) × 100. If the post logged 16,000 impressions, it scores (500 ÷ 16,000) × 100 = 3.125%, or about 3.1%.
One post, three honest answers: 5%, 2%, and 3.1%. That is why the denominator must be named in every report.
Advanced Application: The Weighted Engagement Rate
For advanced teams, treating all engagements equally can hide what matters. A "save" usually signals more intent than a "like." To account for this, some teams use a Weighted Engagement Rate (WER), with weights they agree on internally. One example set of weights gives this formula: (((Saves × 4) + (Shares × 3) + (Comments × 2) + (Likes × 1)) ÷ Total Reach) × 100 = WER Score. Using the same post: (40 × 4) + (30 × 3) + (50 × 2) + (380 × 1) = 160 + 90 + 100 + 380 = 730 weighted points, and (730 ÷ 10,000) × 100 = a WER score of 7.3. Because of the weights, this is a score rather than a true percentage, so compare it only with other WER scores calculated with the same weights. It reflects the quality of your engagement, not just the volume, helping you optimize for high-intent actions rather than passive likes.
Step 4: Calculate Short-Form Video Engagement (TikTok, Reels, Shorts)
Short-form video operates on a completely different psychological paradigm than static imagery or text posts. A user scrolling past an image might double-tap it passively. A user watching a highly compelling 60-second video might sit through it twice, utterly captivated, without ever hitting the like button or leaving a comment. Therefore, calculating engagement for video requires nuanced, format-specific adjustments.
Separating passive views from active engagements is critical for evaluating short-form content. You must look at metrics like 'Average Watch Time', 'Completion Rate', and 'Hook Rate' (the percentage of viewers who stay past the crucial 3-second mark) alongside traditional social actions.
Illustrative example: A video producer is trying to scale a direct-to-consumer fitness brand's presence on TikTok.
- Context: The producer saw large view counts (around 500,000 on one video) but very low standard engagement (likes/comments), leading to internal doubts from the executive team about the content's actual business value.
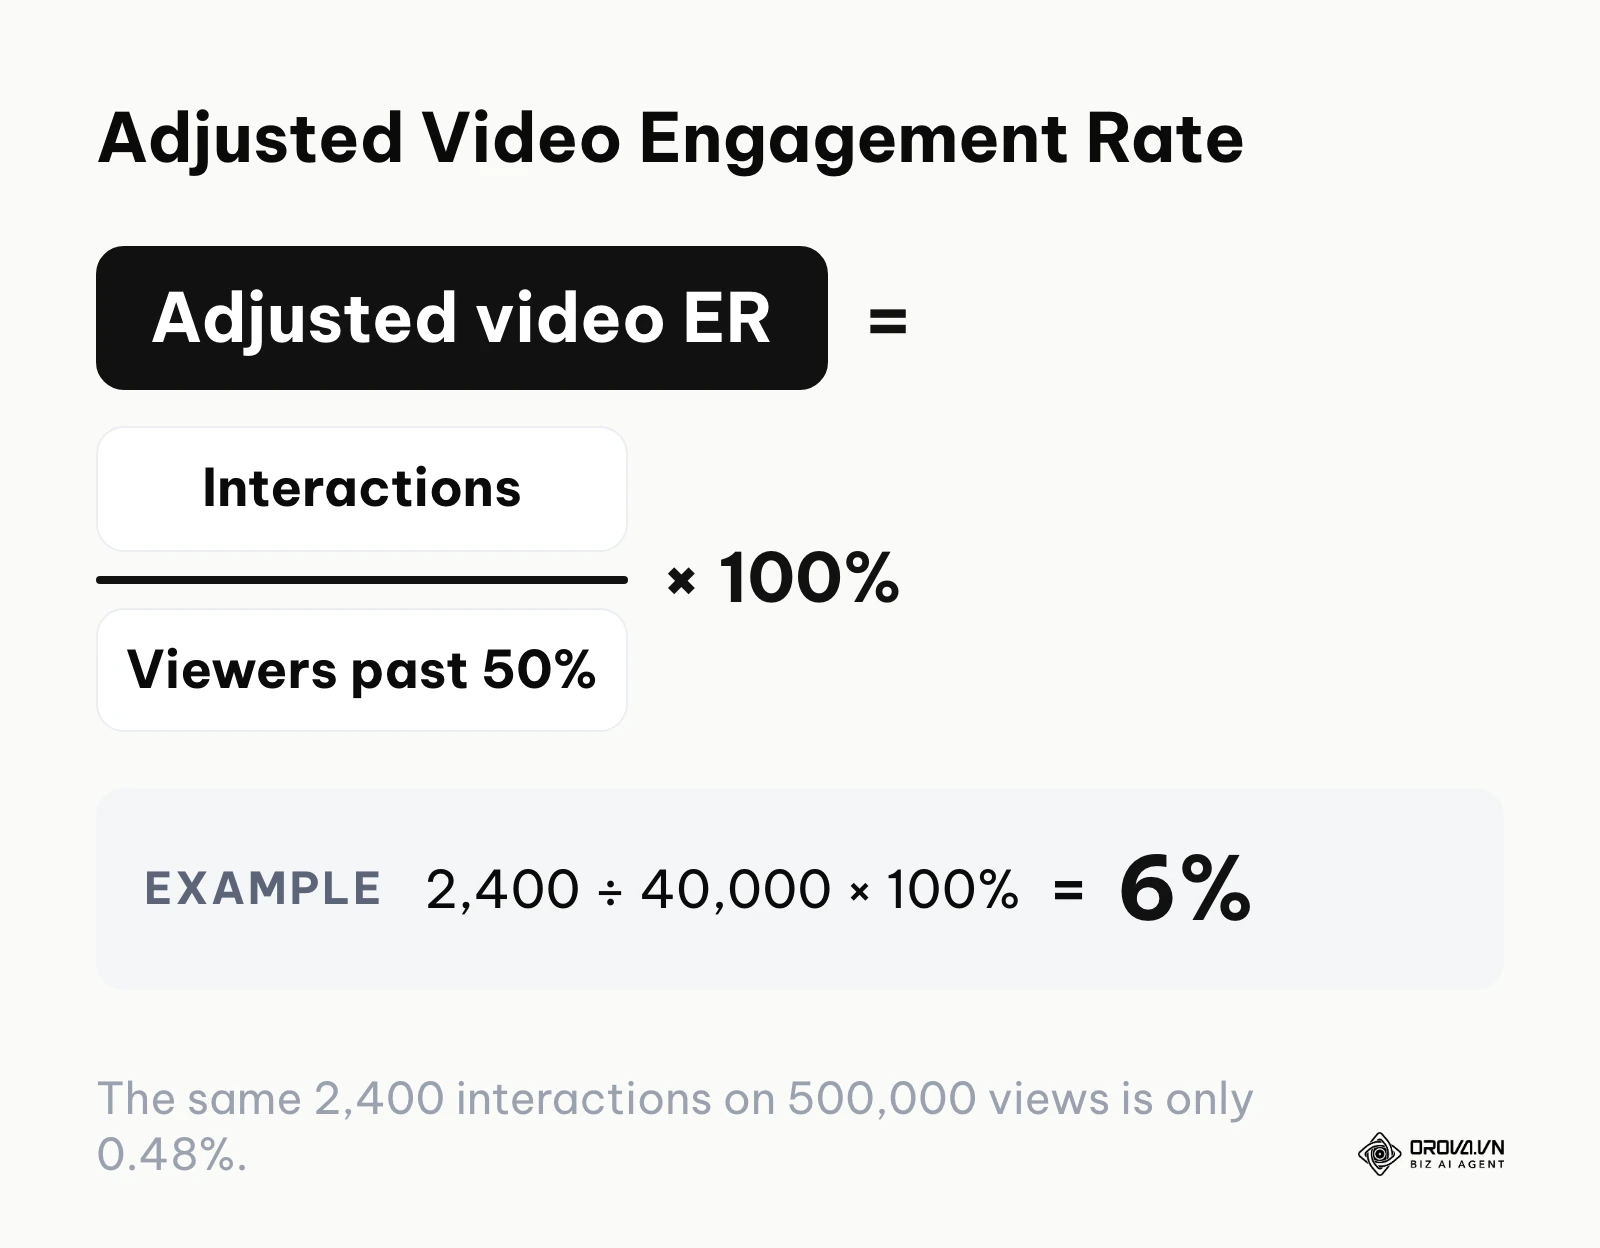
- Steps taken: They accessed the detailed, second-by-second video analytics. They separated the standard 3-second view metric from the full video completion metric. They then calculated an "Adjusted Video Engagement Rate" based only on the retained audience—users who watched past the 50% mark.
- Hurdle and fix: The platform's default export did not calculate this retained audience automatically. They fixed this by creating a custom column in their spreadsheet that divided total interactions only by the number of viewers who made it past the halfway point: (Interactions ÷ Viewers Past 50%) × 100.
- Result: The video had 2,400 interactions. Against 500,000 views that is (2,400 ÷ 500,000) × 100 = 0.48%; against the 40,000 viewers who watched past the halfway point it is (2,400 ÷ 40,000) × 100 = 6%. The adjusted metric showed that the core audience that stayed was engaged. The retention curves in the new report also showed where passive scrollers dropped off, which gave the team a concrete target for stronger hooks in the next video shoot.
Step 5: Aggregate Cross-Platform Campaign Data
If you run a cohesive marketing campaign simultaneously across Instagram, LinkedIn, YouTube Shorts, and Facebook, you cannot simply add the final percentages of each platform together and divide by four. That unweighted average of rates gives a tiny post the same say as a huge one, and it can point the wrong way (the same trap that produces Simpson's paradox in statistics). Different platforms have vastly different baseline reaches, and treating them equally mathematically skews the reality of your campaign's performance.

To find a true cross-platform rate, you must aggregate the raw numbers first, before any division takes place. Sum up the total engagements across all platforms into one massive aggregate number. Then, sum up the total unique reach across all platforms (accounting for potential audience overlap if your analytics tools allow it). Finally, divide the total combined engagements by the total combined reach.
This weighted mathematical approach ensures that a viral post on one platform that reached 2 million people appropriately influences the overall campaign metric much more than a quiet post on another platform that only reached 2,000 people. Worked example: Platform A earns 60,000 engagements on 2,000,000 reach (3%), and Platform B earns 200 engagements on 2,000 reach (10%). Averaging the two rates gives (3% + 10%) ÷ 2 = 6.5%, which overstates the campaign. Pooling the raw numbers gives (60,200 ÷ 2,002,000) × 100 ≈ 3.0%, which is the figure that reflects what most of the audience actually did. Understanding how these aggregated social numbers drive actual, measurable site visits is crucial; for a deeper dive into moving from social metrics to site metrics, review our guide on how to measure website traffic.
Step 6: Use an Engagement Rate Formula Excel Template
Calculating these granular metrics manually for every single post across multiple platforms is an immense waste of professional time and highly susceptible to human error. You need to transition to an automated workflow using an engagement rate formula excel template, or ideally, a dynamic data dashboard.
Set up a master spreadsheet with standardized columns for Date, Platform, Campaign Name, Post Link, Total Reach, Impressions, Likes, Comments, Shares, Saves, and Link Clicks. Create a 'Total Engagements' formula column that automatically sums the interaction columns. Then, create an 'Engagement Rate by Reach' column that automatically divides the Total Engagements by the Total Reach. A minimal layout, with the example post from Step 3 in row 2 (columns A to L, headers in row 1):
| A: Date | B: Platform | C: Reach | D: Impressions | E: Followers | F: Likes | G: Comments | H: Shares | I: Saves | J: Total Engagements | K: ERR | L: WER Score |
|---|---|---|---|---|---|---|---|---|---|---|---|
| 2026-09-14 | 10,000 | 16,000 | 25,000 | 380 | 50 | 30 | 40 | =SUM(F2:I2) → 500 | =J2/C2 → 5.0% | =(I2*4+H2*3+G2*2+F2)/C2*100 → 7.3 |
Format column K as a percentage so Excel or Google Sheets shows 5.0% instead of 0.05. Add =J2/E2 and =J2/D2 columns if you also need ERF (2%) and ERI (about 3.1%). By doing this, you only have to paste in the raw exported data dumps each week. The spreadsheet handles the complex math instantly, highlighting posts that fall below your baseline in red, and posts that over-perform in green. This transitions your role from a data entry clerk to a strategic data analyst, giving you time to actually think about what the numbers mean.
Calculating engagement is easier when your posting history lives in one place. With Orova Social, you can publish to eight social channels, schedule posts, and download your content calendar to an Excel file to line up against your engagement numbers. Start organizing your cross-platform posting today.
Deep Dive: Choosing the Right Formula for Executive Reporting
When presenting data to stakeholders, the formula you choose dictates the story you tell. Executives often want simple numbers, but providing the wrong simple number can lead to disastrous strategic pivots. The debate usually centers around whether to use Followers, Reach, or Impressions as the baseline. The reality is that different levels of leadership require different mathematical translations of success.
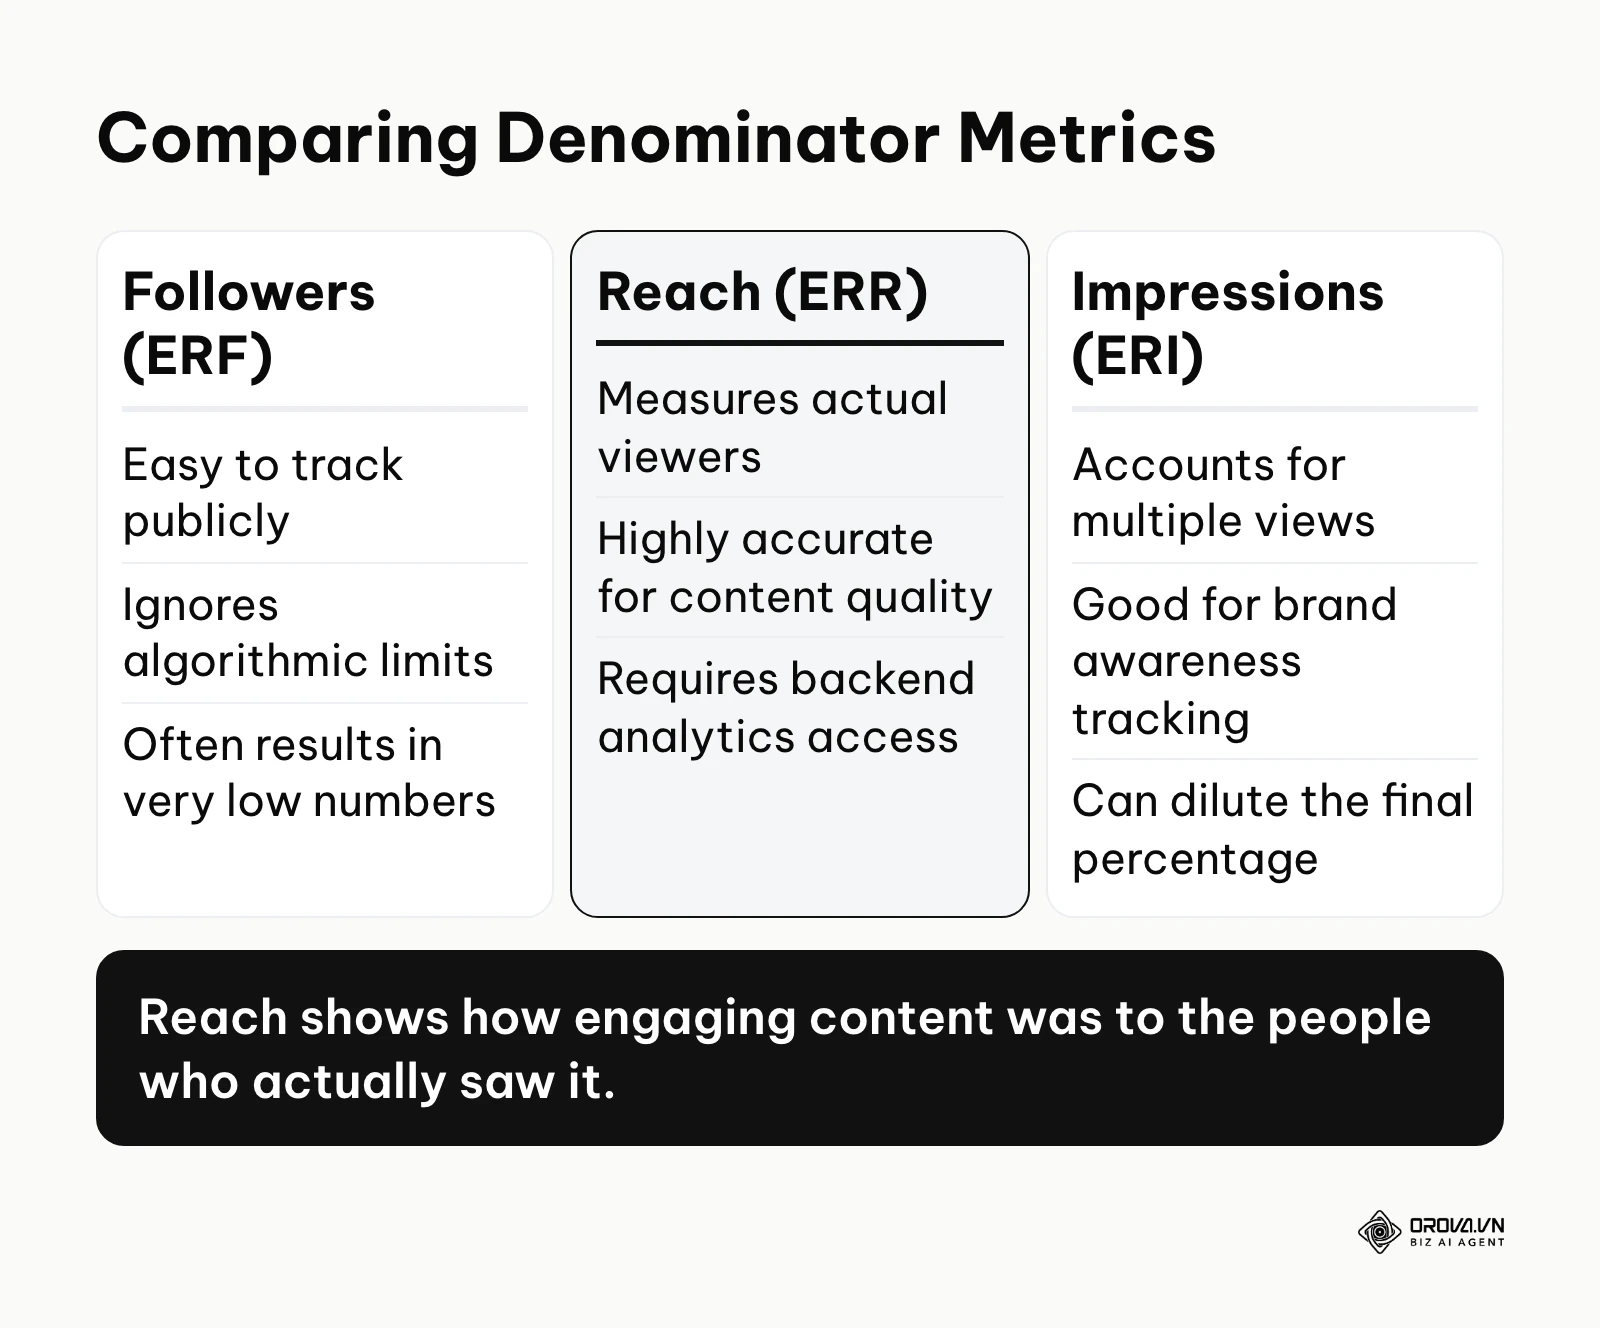
Relying purely on follower counts can distort how effective a campaign looks. This happens because algorithms actively limit organic content from brands; your followers simply are not seeing your posts unless they have interacted with you recently. Reporting to a CFO using a follower-based metric makes your department look inefficient, whereas reporting using a reach-based metric proves you are highly effective with the audience you actually capture.
| Formula Type | Best Used For | Major Weakness | Executive Persona Fit |
|---|---|---|---|
| Engagement Rate by Followers (ERF) | Benchmarking against public competitors where their backend reach data is hidden from you. | Highly inaccurate for measuring actual content resonance; penalizes legacy accounts that have accumulated years of inactive "ghost" followers. | Competitive Intelligence Directors tracking share of voice. |
| Engagement Rate by Reach (ERR) | Determining exactly how compelling a specific piece of content was to the people who actually saw it on their screens. | Harder to calculate historically if older reach data is no longer available in native analytics, so export it on a schedule. | CMOs and Marketing Directors assessing creative asset quality. |
| Engagement Rate by Impressions (ERI) | Evaluating high-frequency ad campaigns designed for repeated exposure and brand recall. | Can artificially lower the percentage if users view a post multiple times without engaging again, making good content look bad. | Media Buyers and Paid Advertising Managers tracking ad fatigue. |
| Daily Engagement Rate (Daily ER): (engagements in one day ÷ followers) × 100 | Assessing the overall health, daily pulse, and conversational velocity of a brand's community presence. | Does not isolate which specific posts performed well, blending viral hits and total flops together into a mediocre average. | Community Managers and Public Relations Officers tracking sentiment. |
Choosing the wrong metric can derail an entire marketing team and lead to budget cuts.
Illustrative example: An in-house marketing team at a fintech startup is reporting quarterly results to their fiercely analytical CEO.
- Context: The team had spent six months and a massive budget growing their follower count rapidly through broad awareness tactics and influencer shoutouts. However, their engagement rate based on followers had plummeted from 4% down to 0.5%.
- Steps taken: Anticipating executive panic, the marketing director completely switched the reporting model from Follower-based ER to Reach-based ER. They created side-by-side visualization charts showing that while the follower percentage looked terrible (due to denominator bloat), the percentage of actual viewers engaging was 6%, in line with the account's own earlier reach-based results.
- Hurdle and fix: The CEO was initially highly skeptical of changing the measurement standard mid-year, accusing the team of "moving the goalposts." The director fixed this by showing the account's own reach data, post by post: only a small share of followers saw each organic post, so the follower math was measuring people who never had a chance to engage. The director also kept reporting both figures side by side, so nothing looked hidden.
- Result: The CEO stopped demanding viral vanity metrics, understood the algorithmic reality, and approved the budget for targeted community management, realizing the active, reached audience was actually highly engaged and ready to convert.
If you are also struggling to align these nuanced social metrics with wider, revenue-focused business goals, you must define exactly what are marketing dashboard KPIs for your specific organizational stage, ensuring your social metrics map directly to your customer acquisition costs.
Measuring Results: What Is a Good Engagement Rate for Your Account?
The question "what is a good engagement rate" is incredibly common, but the answer depends on the platform, your industry niche, the content format, the denominator you chose, and your audience size. Published averages are measured with different denominators, different definitions of an engagement, and different samples of accounts, so a number from someone else's report rarely transfers cleanly to yours. As a general rule, smaller, niche accounts tend to see higher percentages because their audience is tightly knit, whereas large, generalized accounts carry more casual followers in the denominator.
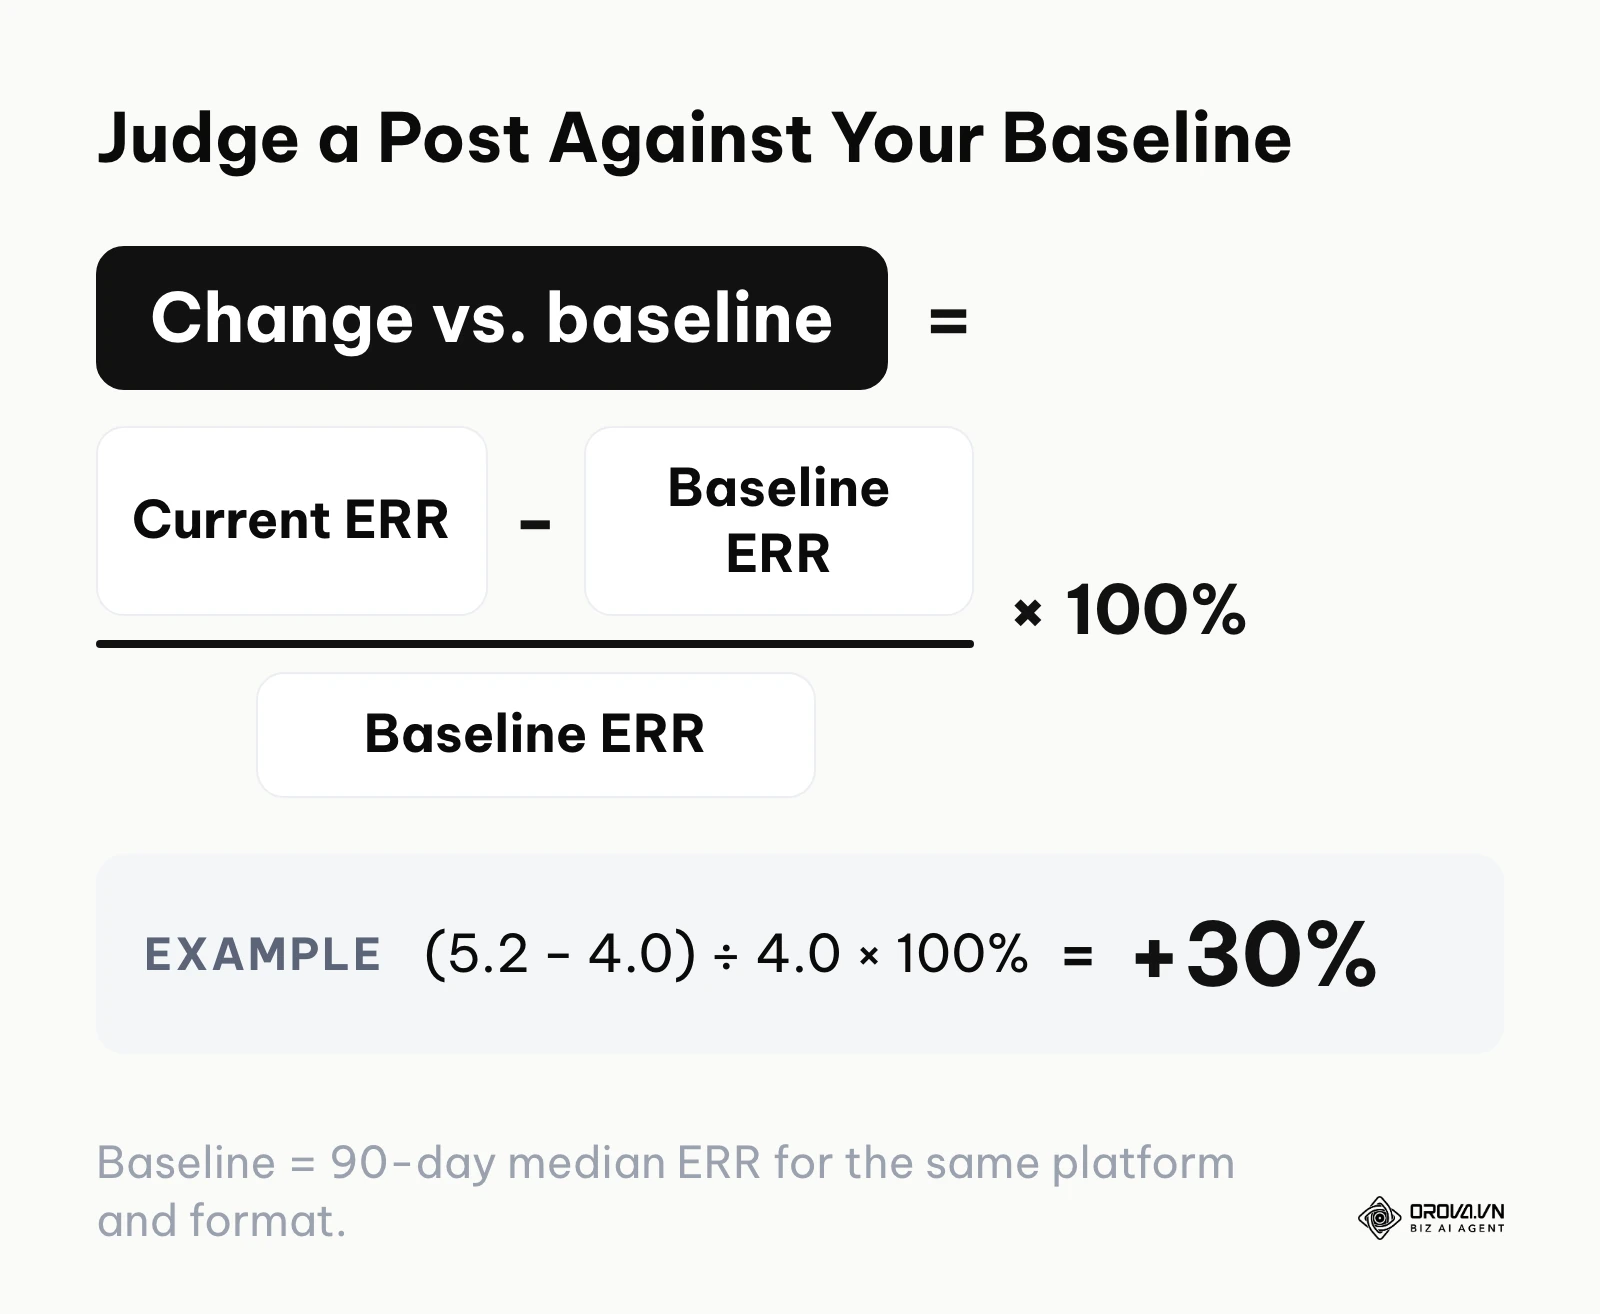
The most reliable yardstick is your own history. A good engagement rate is one that beats your own baseline for the same platform, format, and denominator. To measure that, compare each post with the median of your last 90 days of similar posts:
Change vs. Baseline = ((Current ERR − Baseline ERR) ÷ Baseline ERR) × 100
For example, if your Reels have a 90-day median ERR of 4.0% and a new Reel reaches 5.2%, the change is ((5.2 − 4.0) ÷ 4.0) × 100 = +30%. A static post at 1.5% against a static baseline of 2.0% is ((1.5 − 2.0) ÷ 2.0) × 100 = −25%.
| Comparison | How to Calculate It | Example | What It Tells You |
|---|---|---|---|
| Post vs. its own format | This post's ERR compared with the 90-day median ERR of the same format on the same platform | Reel at 5.2% vs. Reel median 4.0% → +30% | Whether the creative, hook, or topic outperformed what this format usually does for you. |
| Month vs. previous month | Pooled ERR for the month (total engagements ÷ total reach × 100) compared with last month's pooled ERR | 3.6% vs. 3.0% → +20% | Whether the overall content mix is improving, independent of a single viral post. |
| Same month, last year | Pooled ERR for this month compared with the same month a year earlier | 2.4% vs. 3.0% → −20% | Whether a dip is seasonal (holidays, budget cycles) or a real decline. |
| Topic vs. topic | Median ERR of posts tagged with one content pillar compared with another | Tutorials 4.8% vs. announcements 2.4% → tutorials score twice as high | Which themes earn attention, so you can shift your calendar toward them. |
| Organic vs. paid reach | ERR on organic reach only compared with ERR on paid reach only | Organic 4.0% vs. paid 1.0% | How much paid distribution dilutes the blended rate (see mistake #2 below). |
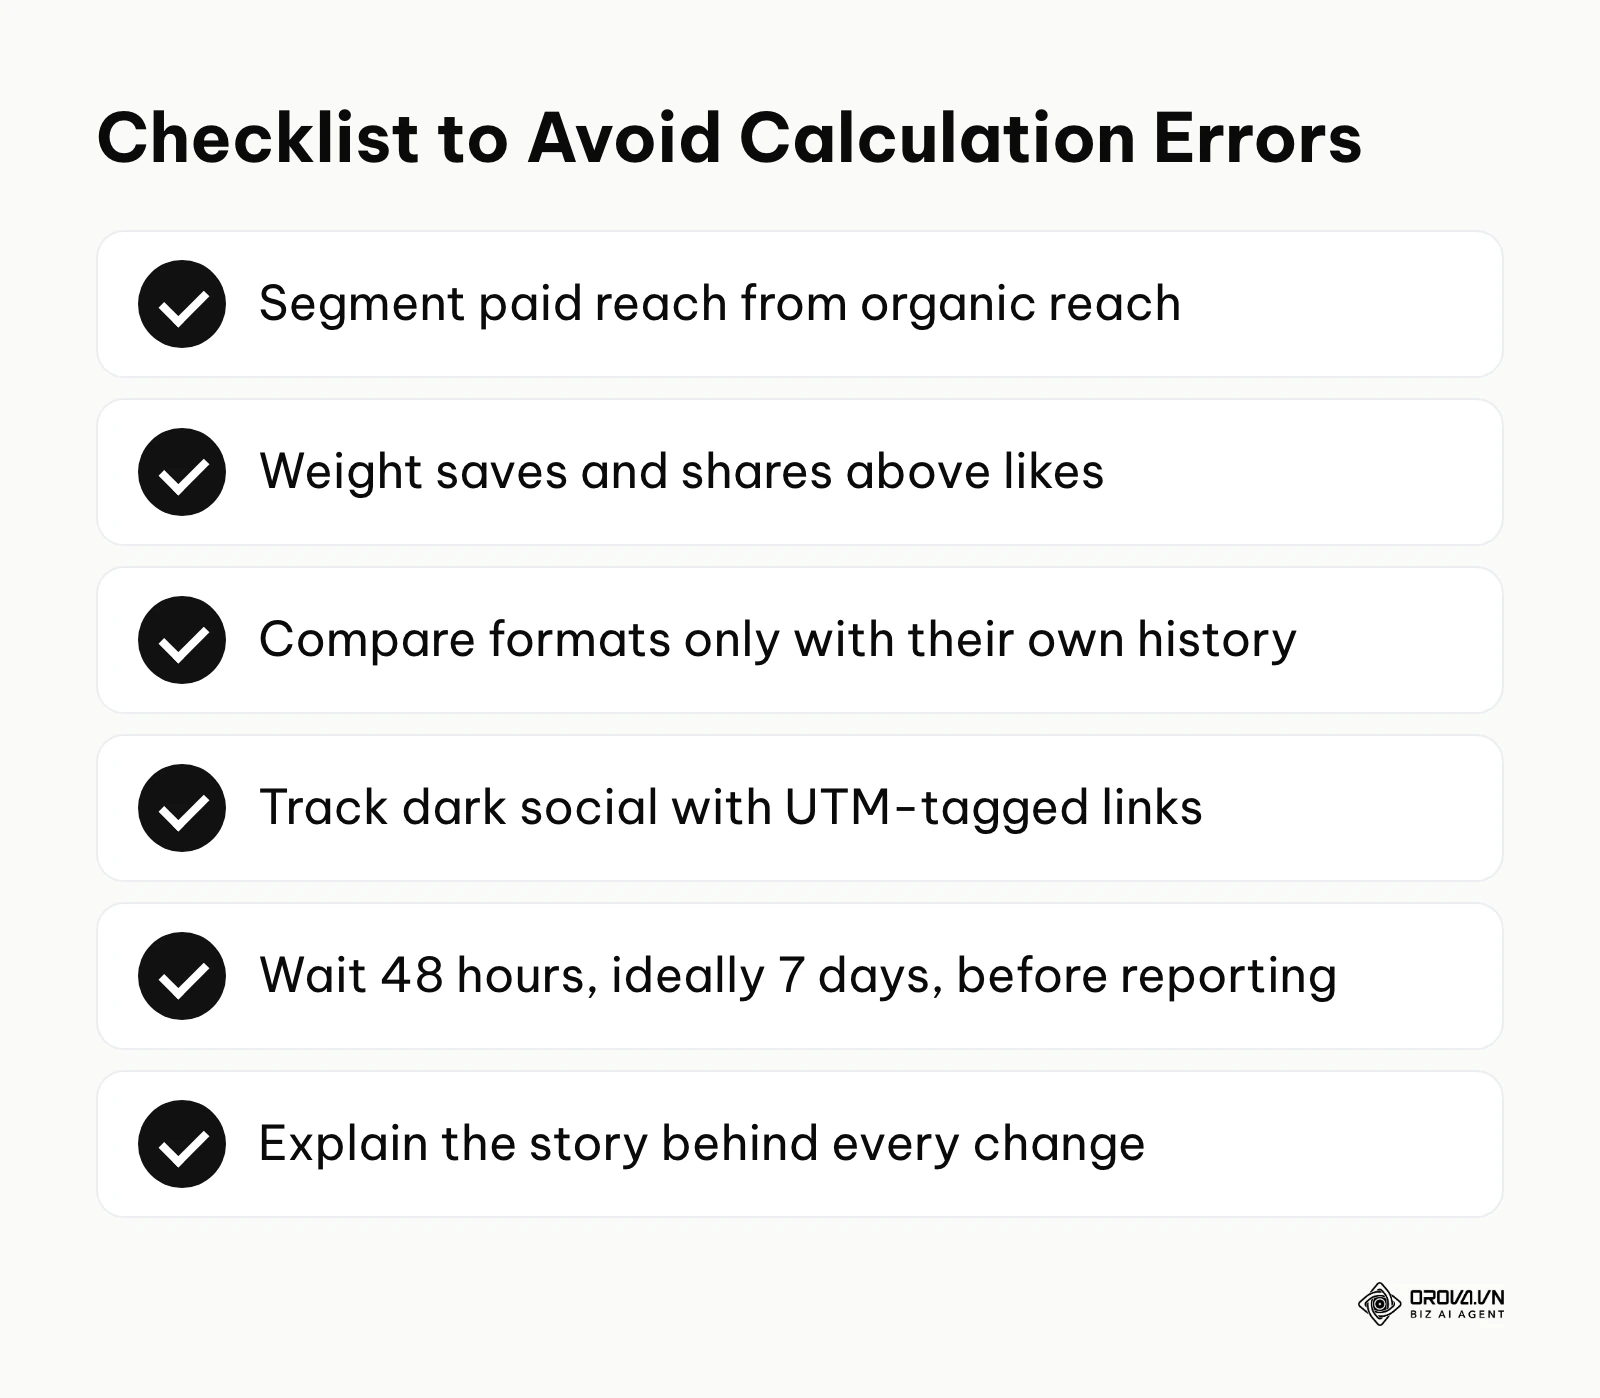
Use these warning signs instead of fixed thresholds: a post more than 25% below its format baseline deserves a look at the hook and the visual, and if several posts in a row slip on one platform, check reach first, because a distribution change can look like a creative problem. Applying an e-commerce benchmark to a B2B SaaS company will only result in disappointment, so benchmark against your own reality.
You must view these metrics over a rolling 90-day period. A sudden drop in engagement might not mean your content quality degraded overnight; it often signifies a backend algorithm change altering how reach is distributed across the network. When a platform changes its rules to favor a new format, your reach might spike or plummet instantly, which mathematically alters your engagement rate even if the raw number of likes stayed exactly the same.
This is why tracking both the absolute raw numbers and the calculated percentages simultaneously is vital for accurate analysis. If you only look at the percentage, you miss the context of the algorithmic distribution. If you are struggling with maintaining consistency across platforms during these turbulent algorithmic shifts, learning how to schedule Instagram posts properly can help stabilize your baseline reach metrics by ensuring you hit your audience when they are most active.
6 Common Mistakes When Measuring Engagement
Even experienced marketers, armed with advanced spreadsheets, fall into statistical traps when analyzing social data. Avoid these six critical pitfalls to ensure your reports maintain absolute integrity and drive smart business decisions.
Mistake 1: Treating All Engagements as Equal
A "like" takes half a second of minimal cognitive effort; it is a fleeting reaction. A "save" indicates the user found the content valuable enough to bookmark and reference later. A "share" means they are willing to put their own personal or professional reputation behind your message by broadcasting it to their peers. Treating them all as equal points in a raw sum fails to capture the true depth of audience sentiment. You should apply weighted values (as discussed in Step 3) to different actions for advanced reporting. Valuing a share the same as a like is like valuing a window shopper the same as a paying customer.
Mistake 2: Forgetting to Remove Paid Reach
If you put money behind a post to "boost" it, you add paid impressions and paid reach on top of the organic numbers. Paid traffic is inherently colder and less engaged than organic traffic. If you calculate your organic engagement rate using that artificially inflated, blended reach denominator, your percentage will look disastrously low, making your organic content look like a failure. Always meticulously segment organic reach from paid reach in your platform dashboards before doing the math. If you need help structuring your financial strategy regarding paid content and understanding how it skews metrics, review this ads budget deep dive: how to calculate and allocate your spend.
Mistake 3: Comparing Oranges to Apples
You cannot accurately compare the engagement rate of a complex, ten-slide educational carousel explaining dense industry regulations to a fast-paced, highly entertaining fifteen-second trending audio video. They serve entirely different purposes in the marketing funnel. The video is designed for broad, top-of-funnel reach with low-barrier engagement, while the carousel is designed for mid-funnel, high-intent saves and shares. Benchmark content types against their own historical averages—videos against past videos, text against past text—never against entirely different formats.
Mistake 4: Ignoring Dark Social Metrics
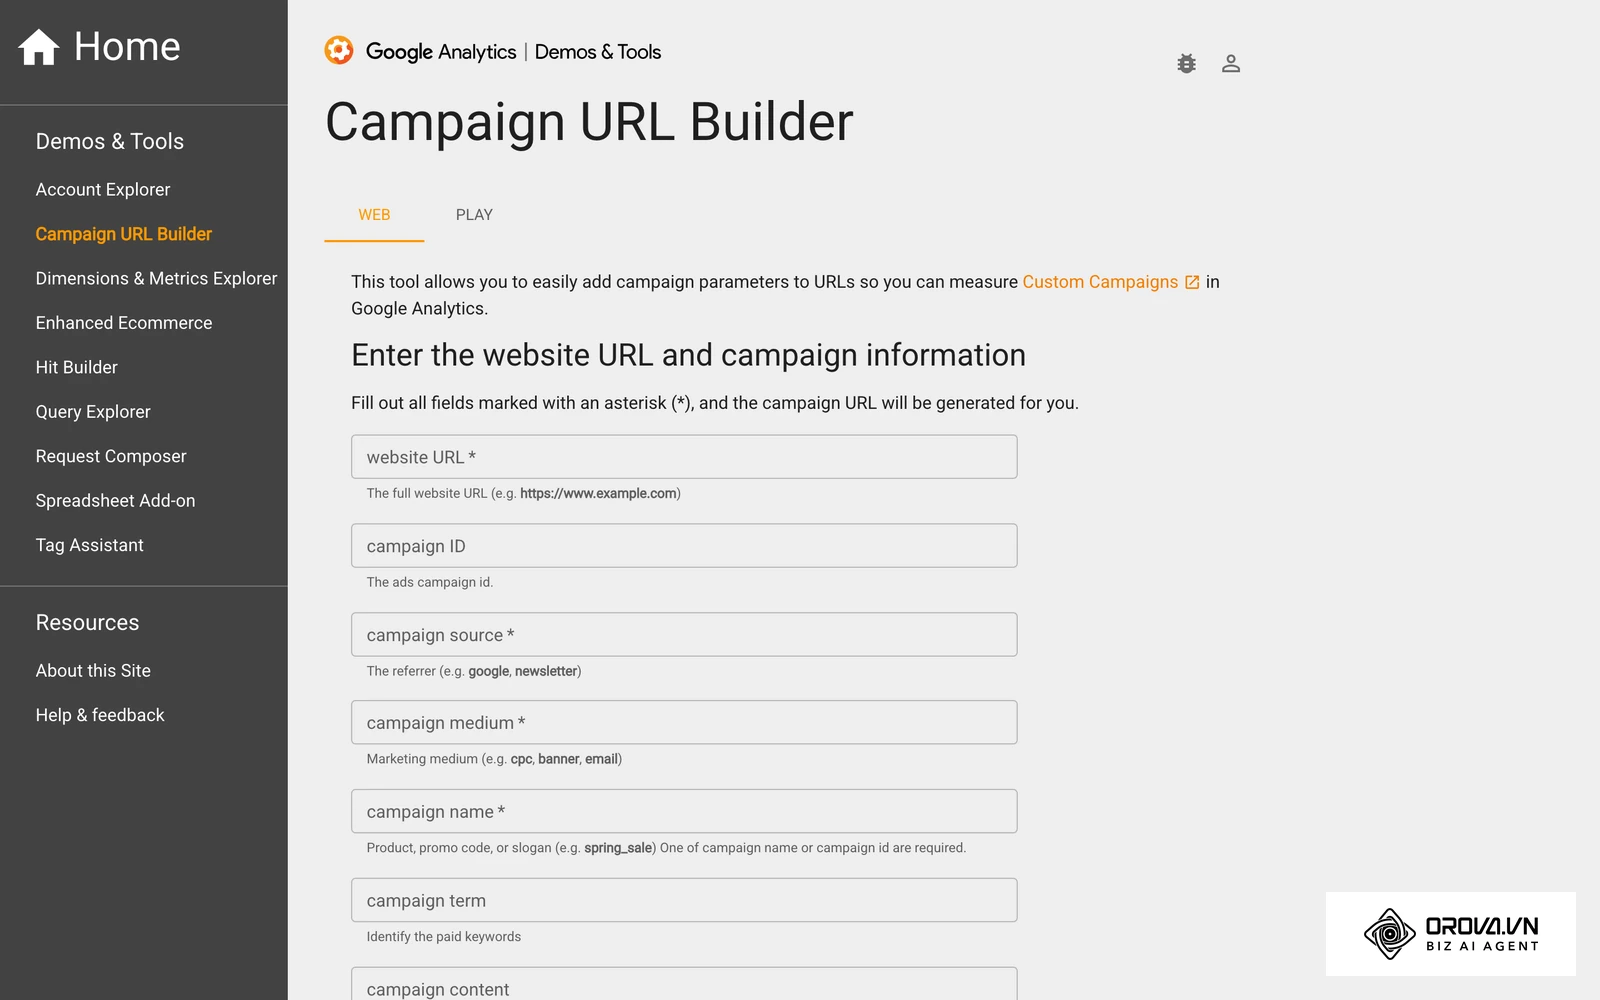
"Dark social" refers to content shared privately via direct messages (DMs), Slack channels, Discord servers, WhatsApp, or standard text messages. Native analytics often miss this entirely because the traffic source is stripped of its tracking data. While hard to calculate precisely, ignoring the fact that your content might be driving massive private conversations leads to severely undervaluing your work. Track link clicks closely with custom UTM parameters as a proxy for dark social sharing, and implement "How did you hear about us?" fields on your intake forms to capture this hidden engagement.
Mistake 5: Analyzing Too Soon After Publishing
Calculating the rate two hours after a post goes live is a pointless exercise in anxiety. Modern algorithms do not operate on chronological timelines; they operate on prolonged engagement testing. Algorithms continue to serve content for days, and short-form video content can sometimes spike weeks or even months later as it indexes in search features. Wait at least forty-eight hours, but ideally establish a strict seven-day retroactive window, before pulling the final numbers for your monthly wrap-up to ensure you are capturing the long-tail engagement.
Mistake 6: Failing to Provide Narrative Context
Presenting a dense spreadsheet full of decimal percentages to a client or executive without a narrative summary is a total failure of communication. Data without context is just noise. If the overall engagement rate dropped by 2% this month, you must explain why in clear, business terms (e.g., a strategic shift in content pillars to target a colder demographic, a known platform outage, or expected seasonal audience behavior during holidays) rather than just delivering the bad news without a diagnosis. You must tell the story behind the math.
Do not let an inconsistent posting schedule muddy your baseline. Orova Social lets you schedule posts and write captions with AI in your brand voice across eight channels, and it is free until July 7, 2027, so you can keep a steady rhythm without the manual workload.
Engagement Measurement Trends in the Next Few Years: My Perspective
Looking ahead to the continuous evolution of digital analytics, the fundamental way we calculate and interpret these metrics is going to change significantly. Based on the current trajectory of platform development, privacy legislation, and artificial intelligence up to 2026, here is how I view the future of engagement measurement.
AI-Driven Sentiment Analysis Will Reduce Reliance on Raw Counting
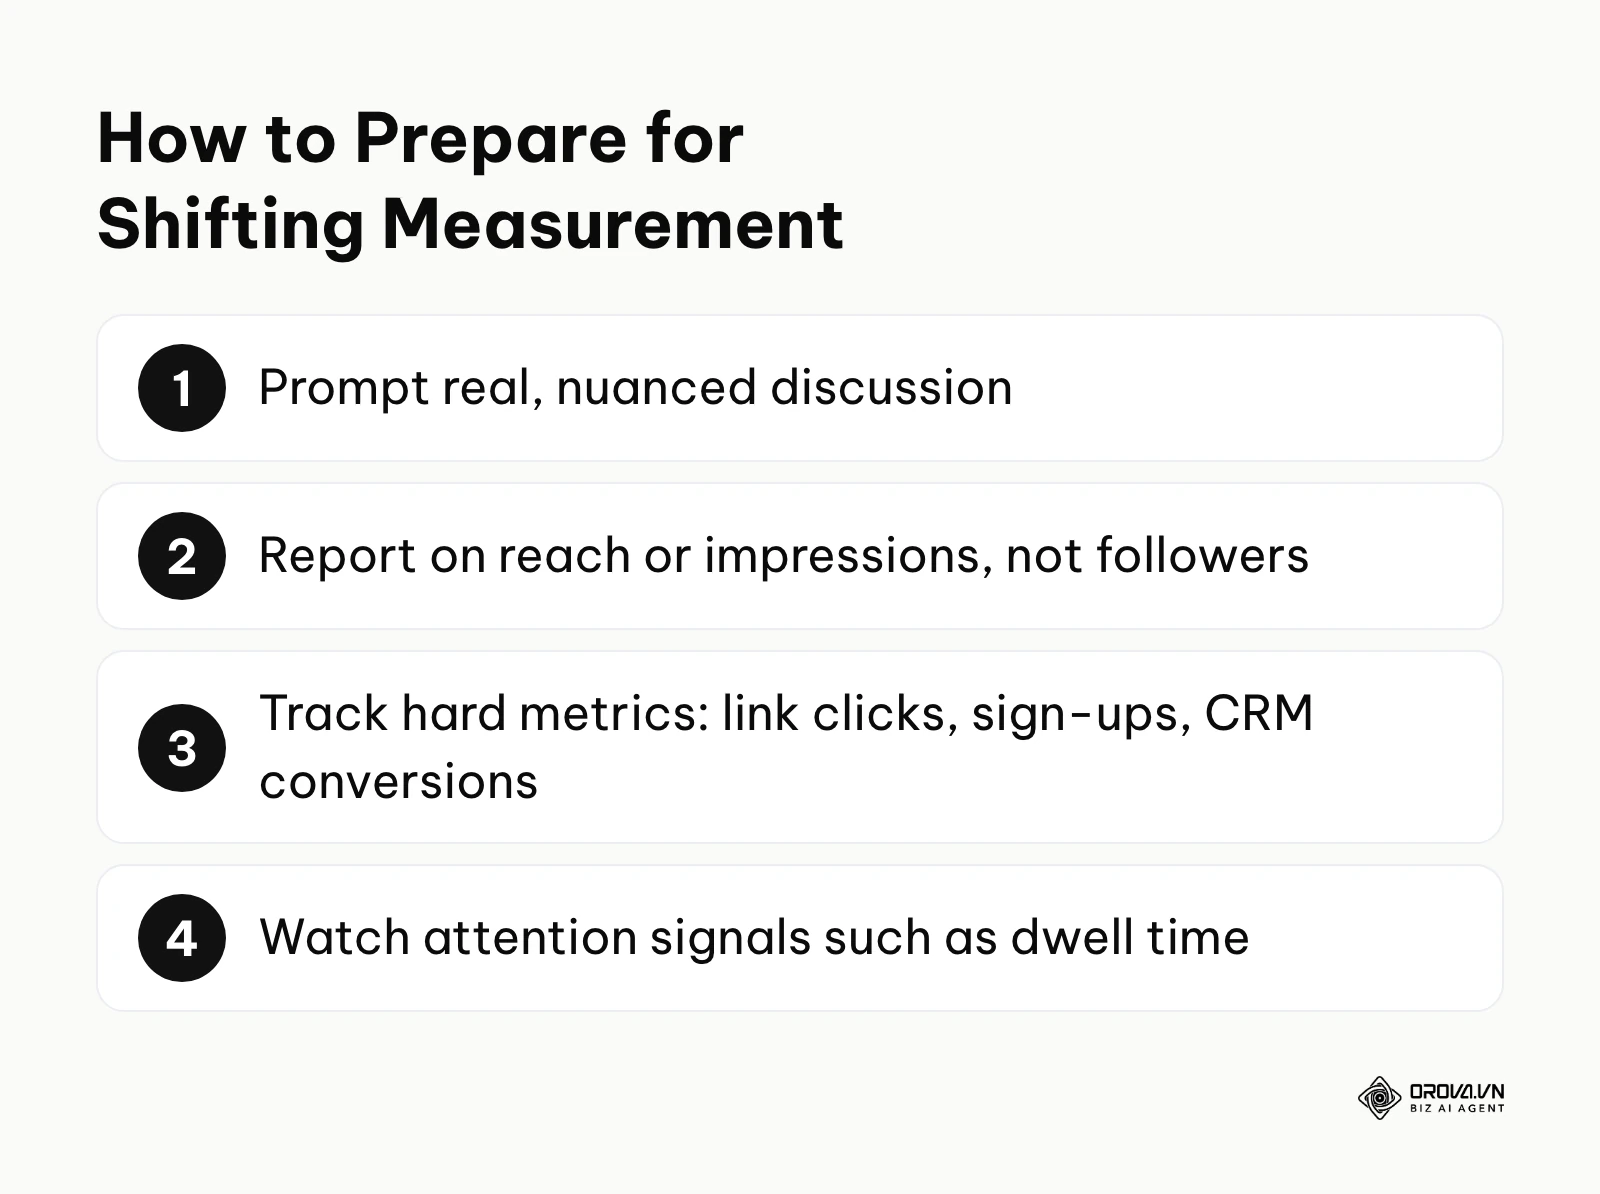
I believe that in the coming years, simply counting the volume of comments will matter less and less. We are already seeing the beginnings of this with the rise of generative AI bots that can flood posts with believable, generic comments. Instead of a formula based purely on volume, I think AI analytics will increasingly analyze the actual semantic sentiment and linguistic depth of the interactions. A post with twenty thoughtful, multi-sentence comments debating the nuances of the topic deserves a higher "quality engagement score" than a post with two hundred bot-generated fire emojis. You can prepare for this shift now by focusing on content that prompts real, nuanced discussion rather than relying on cheap engagement-bait tactics.
Follower-Based Metrics Will Keep Losing Relevance
I suspect that platforms will keep de-emphasizing follower counts in how they distribute content. As recommendation feeds take up more of the experience (where content is served based on interest signals, not only follow status), a follower denominator will say less and less about how content performed. I recommend moving your main reporting to reach-based or impression-based metrics now, while keeping follower-based figures only for public competitor comparisons.
Unified Cross-Platform Measurement Standards
Currently, what counts as a "view" differs from one platform to another, so the same word hides different thresholds. I expect continued pressure from advertisers and industry bodies for more consistent, auditable definitions across platforms. If definitions change, your historical numbers may shift when platforms update their reporting. To prepare for this volatility, focus on the hardest metrics to fake—like outbound link clicks, newsletter signups, and actual CRM conversions—rather than obsessing over platform-specific view counts that could be redefined tomorrow.
The Rise of "Zero-Click" Engagement Measurement
As platforms actively try to keep users from leaving their apps (throttling posts with outbound links), we will see a rise in measuring "Zero-Click Engagement." This involves using proxy metrics like "Dwell Time" (exactly how many seconds a user spent hovering over your text post without clicking anything) or "Image Expand Rate." Measuring engagement will require sophisticated tools that can interpret micro-behaviors that signal attention, even when no tangible click or like occurred.
Frequently Asked Questions About How to Calculate Engagement Rate
How does an engagement rate calculator by reach actually work behind the scenes?
It works by pulling two specific, raw data points from a platform API or a manual spreadsheet entry: the total number of unique user accounts that saw the post on their screen (reach) and the sum total of all trackable actions taken on that post (likes, comments, saves, shares, profile clicks). It divides the total interactions by the unique reach and multiplies by 100 to yield a percentage. Many analysts prefer it because it excludes people who never had the chance to see the content in the first place, giving you a true measure of content quality.
How do I explain a sudden, massive drop in engagement to my clients or manager without sounding defensive?
First, rely on data to isolate the variable. Did the reach drop, or did the interactions drop? If reach dropped significantly while interactions stayed relatively stable (meaning the engagement rate might actually be high, but the volume is low), explain that a platform algorithm update restricted distribution, but the content quality remained high for the few who saw it. If reach was very high but interactions plummeted, you must professionally own the fact that the specific creative asset, hook, or topic did not resonate with the audience. Always bring 90 days of historical data to show long-term trends and contextualize the drop, rather than letting leadership panic over a single anomalous week.
Can AI help improve my engagement rates before I publish?
Yes, AI can significantly assist in the optimization and predictive process. By analyzing vast amounts of your historical data, AI tools can suggest posting times, analyze which visual color palettes or video formats perform best historically with your specific audience, and generate localized copy that aligns with high-performing linguistic patterns. While it cannot guarantee virality, it removes much of the intuitive guesswork from the drafting phase. For practical application, you can read about how to write Instagram captions with AI to see how this works in reality to boost early comment velocity.
Does saving a post count more than liking it algorithmically?
Platforms do not publish their exact weights, but they generally treat saves and shares as stronger signals of interest than likes. A basic manual formula treats them equally as 'one interaction,' which is why the weighted rate in Step 3 exists. A save indicates high-intent, long-term value, signaling to the platform that the content is a high-quality resource. That signal can help your content reach people beyond your existing followers. Always design your educational content to be highly "savable."
How often should we calculate and report these metrics?
For day-to-day community management and social listening, casually glancing at the dashboard numbers weekly is sufficient to catch immediate anomalies, PR crises, or viral spikes. However, formal mathematical calculations, deep analytical reporting, and strategic adjustments should be done on a monthly and quarterly basis. This longer timeframe smooths out the daily volatility of social media algorithms, accounts for weekend dips, and reveals true strategic trends that you can build reliable business plans around.
How do bot purges affect my historical engagement rate?
Periodically, platforms will delete millions of bot accounts overnight. When this happens, your follower count will drop, and your historical likes or comments may vanish. If you use follower-based engagement rates, your rate might ironically appear to improve after a purge because the denominator shrank. This is another critical reason to use reach-based metrics, which are generally less affected by historical bot purges, ensuring your year-over-year comparisons remain structurally sound.
Where to Start?
Measuring digital data can feel incredibly overwhelming, especially if you have never structured a formal, mathematical report before. Your next step depends entirely on your current professional situation, your resources, and the complexity of your marketing operation.
If you are an overwhelmed beginner managing one brand (Solo Marketer/Founder): Do not worry about gathering years of historical data or setting up complex APIs yet. Your first, most crucial step is to build the simple spreadsheet from Step 6. Block out one hour this afternoon and manually log the raw reach and interaction data from your last ten posts. Just getting comfortable with the math, understanding where to find the raw numbers, and seeing the real, unvarnished percentages for the first time is a massive leap forward. It will instantly change how you view your content.
If you are an agency worker dealing with messy client accounts (Account Manager/Strategist): Your immediate task is to audit the denominators across all your active client portfolios. Review your current monthly client reports and verify whether your team is dividing by followers or reach. If you discover you are using followers, spend your next deep-work session drafting a comprehensive, diplomatic brief to the client. Explain why the agency is transitioning to reach-based reporting in the upcoming quarter to provide them with more accurate, actionable insights that tie closer to their ROI. Frame it as an upgrade in your analytical rigor.
If you are a manager at a large enterprise brand (Marketing Director/VP): Your absolute priority is data hygiene and team alignment. Your massive audience size naturally attracts bot traffic and algorithmic anomalies that are skewing your multi-million dollar budget decisions. Dedicate your next analytics block to defining a strict internal protocol for identifying and removing spam interactions before any raw data is fed into your team's calculation models. Establish a Single Source of Truth dashboard, and mandate that all cross-platform campaigns utilize a Weighted Engagement Rate to properly value high-intent actions.
By understanding exactly how to calculate engagement rate, naming your denominator, and comparing results with your own baseline, you take back control of your data, your budget, and your marketing strategy. ---BAI---
About the author

Builder of Orova
Nguyễn Đỗ Trọng Ân has 8 years of experience in marketing, including 6 years managing market development across Asia. He builds Orova, a Biz AI Agent that never sleeps: it plans, runs and optimizes work for businesses.
Run your business with AI Agents
Orova is the always-on Biz AI Agent — it plans, runs, and optimizes the work for you.
Save time, unlock productivity.