
Ads budget deep dive: how to calculate and allocate your spend

You have just launched a new product, generated your first organic sales, and are now ready to scale your business. You open up your advertising platform of choice, navigate to the campaign setup screen, and suddenly stop. Staring back at you is a blank field asking for your daily ads budget. Set this number too low, and you will barely generate enough data for the algorithm to learn anything. Set this number too high, and you risk burning through your entire cash reserve before finding a winning campaign.
Most marketers rely on pure gut feeling when filling out this field. Others blindly copy what they assume their competitors are spending, leading to erratic cash flow and unprofitable campaigns. Setting a proper ads budget requires mathematical precision, not guesswork. The short answer: an ads budget is the amount you commit to paid media for a set period, and the reliable way to set it is to work backwards from your revenue goal, your margins, and your conversion rate, then split it across channels by how proven each one is. This guide walks through that calculation step by step, explains why budgets differ between industries, and gives you a cross-channel allocation framework and a ready-to-copy calculation template so every unit of currency you spend has a job. All figures in the examples below are illustrative round numbers in no particular currency; replace them with your own data.
What is an ads budget and why is it critical?
An ads budget is the specific financial allocation a company designates for paid promotional activities over a set period. It acts as a financial guardrail that prevents overspending, ensures marketing resources align with specific business targets, and provides a clear baseline to measure the return on your investment. Any business running paid media should create one, but you should avoid setting large budgets if your product has not yet achieved organic product-market fit.
At its core, a complete advertising budget is not just the money you hand over to platforms like Google or Meta. A mature budget encompasses three distinct pillars. First is the media spend, which is the actual cost of buying impressions and clicks. Second is the production cost, which covers the creation of assets like video graphics, copywriting, and landing pages. Third is the operational cost, which includes agency fees, tracking software, and team salaries. If you only account for media spend, your true profitability will be heavily skewed. Creating a strict boundary around these costs ensures you do not accidentally scale your business into bankruptcy.
What drives ads budget differences between industries
Before you start crunching your own numbers, you need context. Published "average ad spend by industry" figures circulate widely, but they mix company sizes, years, and definitions of what counts as advertising, so they rarely transfer cleanly to your business. A more useful reference point is understanding why some sectors can afford to spend aggressively while others cannot. Once you see the economics behind the gap, you can judge whether your own spend is too timid or dangerously high.
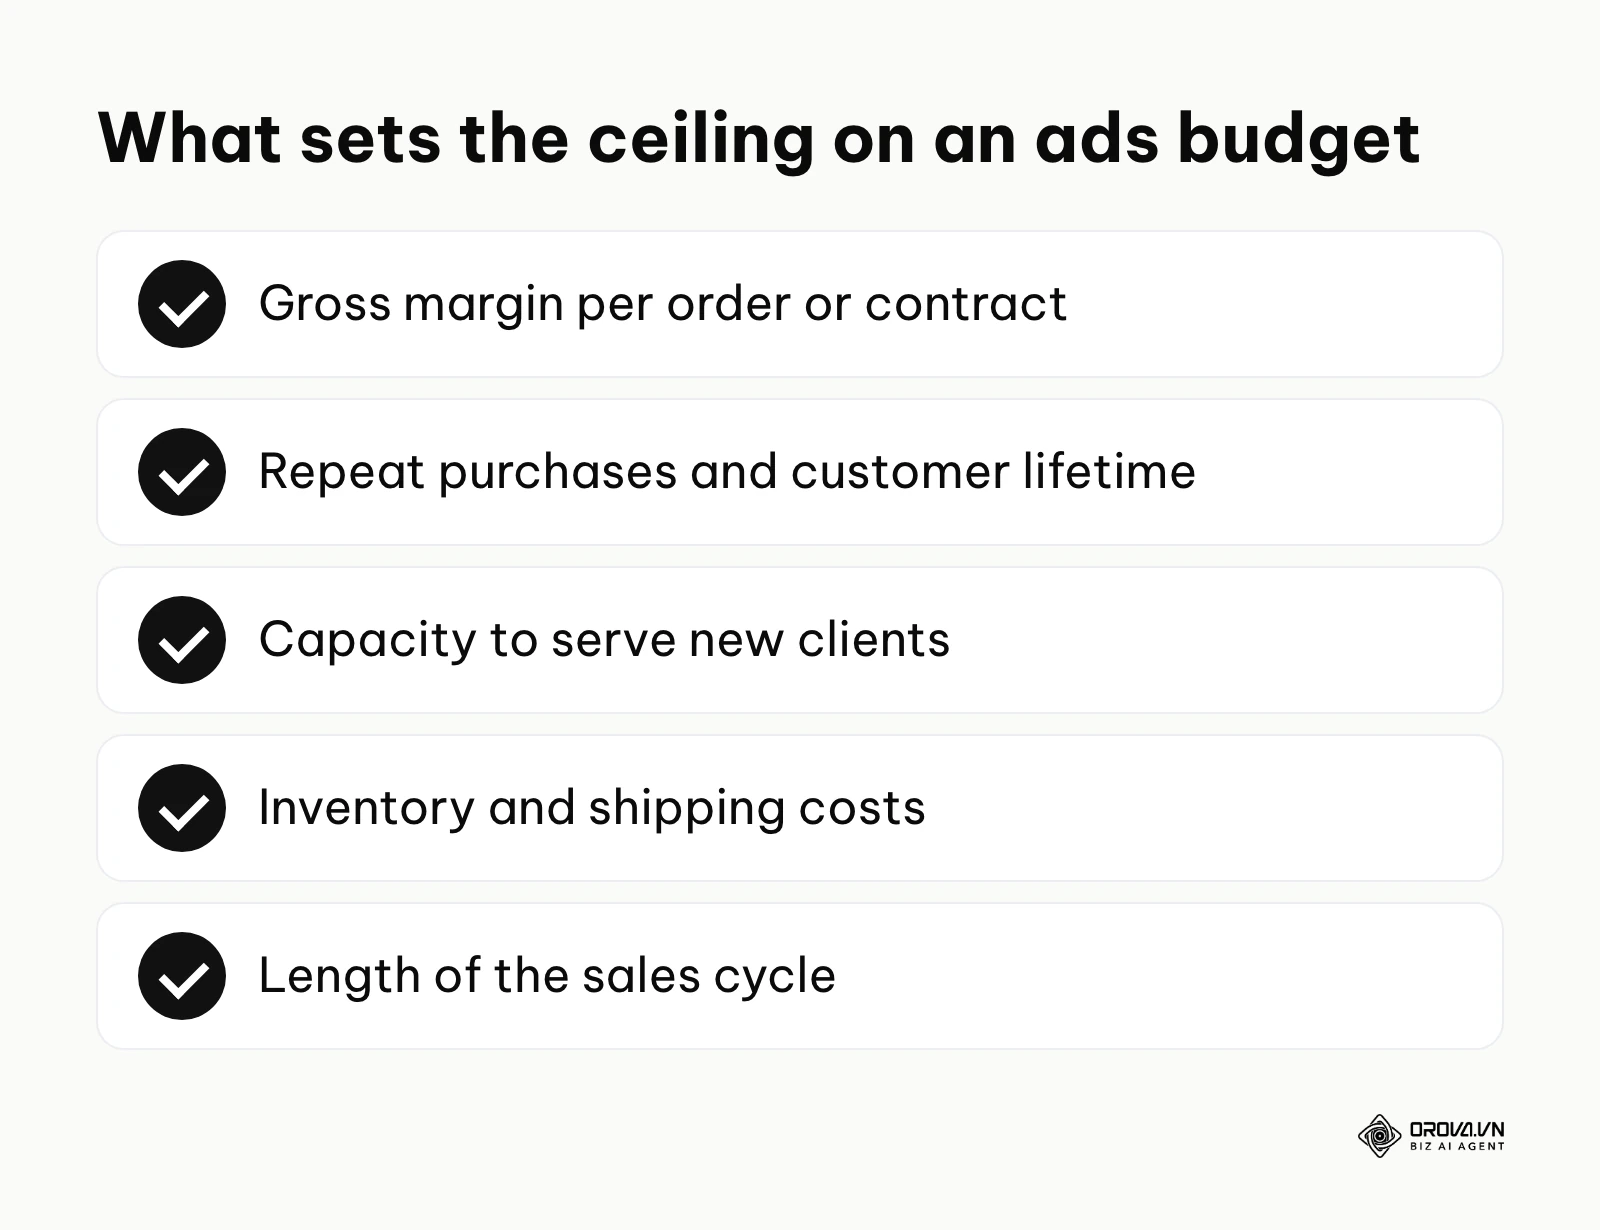
The table below compares common business models by the factors that actually set the ceiling on an ads budget:
| Business model | Margin profile | Customer value pattern | What it means for your ads budget |
|---|---|---|---|
| B2B SaaS (software) | Very high gross margin | Recurring revenue over many months | Can justify a high acquisition cost if retention is strong |
| B2C e-commerce | Medium margin after shipping and returns | Mix of one-off and repeat purchases | Budget must be tied tightly to contribution margin per order |
| Professional services | High margin, limited capacity | Long relationships, referrals | Budget is capped by how many clients the team can serve |
| Healthcare and clinics | Medium to high margin | Repeat visits, local demand | Budget follows local search demand and booking capacity |
| Real estate | Large commission, long cycle | Infrequent, high-value deals | Budget must survive long gaps between lead and closed deal |
| Manufacturing | Thin margin, physical inventory | Few large accounts | Paid media is usually a small slice next to trade sales |
Why do these models diverge so much? A SaaS company operates with very high gross margins. Because the cost to produce one additional software license is practically zero, it can afford to spend heavily acquiring a customer, as long as that customer stays and keeps paying for years.
Conversely, a manufacturing company operates on thin margins and deals with physical inventory, warehousing, and shipping. It cannot copy the spending pattern of a software company without quickly becoming unprofitable. Treat any industry average you find as a rough sanity check, never as a target, and always adjust based on your own unit economics: margin per order, repeat purchase rate, and how long it takes for a customer to pay back the cost of acquiring them. If you want to go deeper on that last point, see this guide to the CAC payback period.
Preparation: What to gather before calculating your ads budget
Calculating a highly accurate budget requires raw financial data. You cannot build a strategy on estimates. Before you open a spreadsheet to apply formulas, you must gather specific metrics from your sales, marketing, and finance departments. If you attempt to skip this preparation phase, your budget will fall apart the moment you encounter real-world market volatility.
| Required Item | Where to find it | How long it takes to gather |
|---|---|---|
| Average Order Value (AOV) | E-commerce platform (Shopify) or CRM | 10 minutes |
| Gross Profit Margin | Accounting software or finance team | 30 minutes |
| Historical Conversion Rate | Google Analytics or Ads Manager | 15 minutes |
| Customer Lifetime Value (LTV) | CRM data over a 12-month period | 1 - 2 hours |
| Total Cash Reserve | Bank statements or CFO approval | 10 minutes |
Let us break down why you need these specific items. Your Average Order Value (AOV) tells you how much revenue a single transaction generates. Your Gross Profit Margin tells you how much money is left from that transaction after paying for the cost of goods sold (COGS). If you do not know your gross margin, you cannot possibly know if your advertising is profitable.
Your historical conversion rate helps you estimate how much traffic you need to buy to generate one sale. If your website converts at 2 percent, you know you need to buy 100 clicks to get two customers. Finally, your cash reserve dictates your absolute ceiling. No matter what the math says, you cannot set a budget higher than the cash you actually have in the bank. If you want to dive deeper into structuring these initial numbers for a broader strategy, consider reviewing a complete marketing campaign budget setup.
6 steps to calculate and allocate your ads budget
This is the most critical phase of the process. We will move from theoretical benchmarks to hard calculations, ensuring every dollar is assigned a specific job.
Step 1: Define your primary business objective and timeline
Before talking about money, you must define exactly what you want the money to achieve. A budget designed to generate immediate sales looks entirely different from a budget designed to build brand awareness.
First, determine if your goal is Top of Funnel (TOF) or Bottom of Funnel (BOF). A TOF goal might be generating 100,000 video views to build brand recall. A BOF goal would be generating 500 product sales at a specific profit margin. Write down your exact goal and the timeline to achieve it. For example, "Generate 200 qualified leads in the next 30 days."
If your goal is vague, like "get more traffic," you will waste money. The platform algorithms will gladly spend your budget acquiring cheap, low-quality traffic that never converts. The sign you have done this right is that your goal is tied directly to a revenue metric. The most common mistake at this stage is setting conflicting objectives, such as demanding both the cheapest possible traffic and the highest possible conversion rate simultaneously.
Step 2: Choose your core budgeting method
There are four classic methods to determine your total budget pool. You must pick the one that aligns with your company's growth stage.
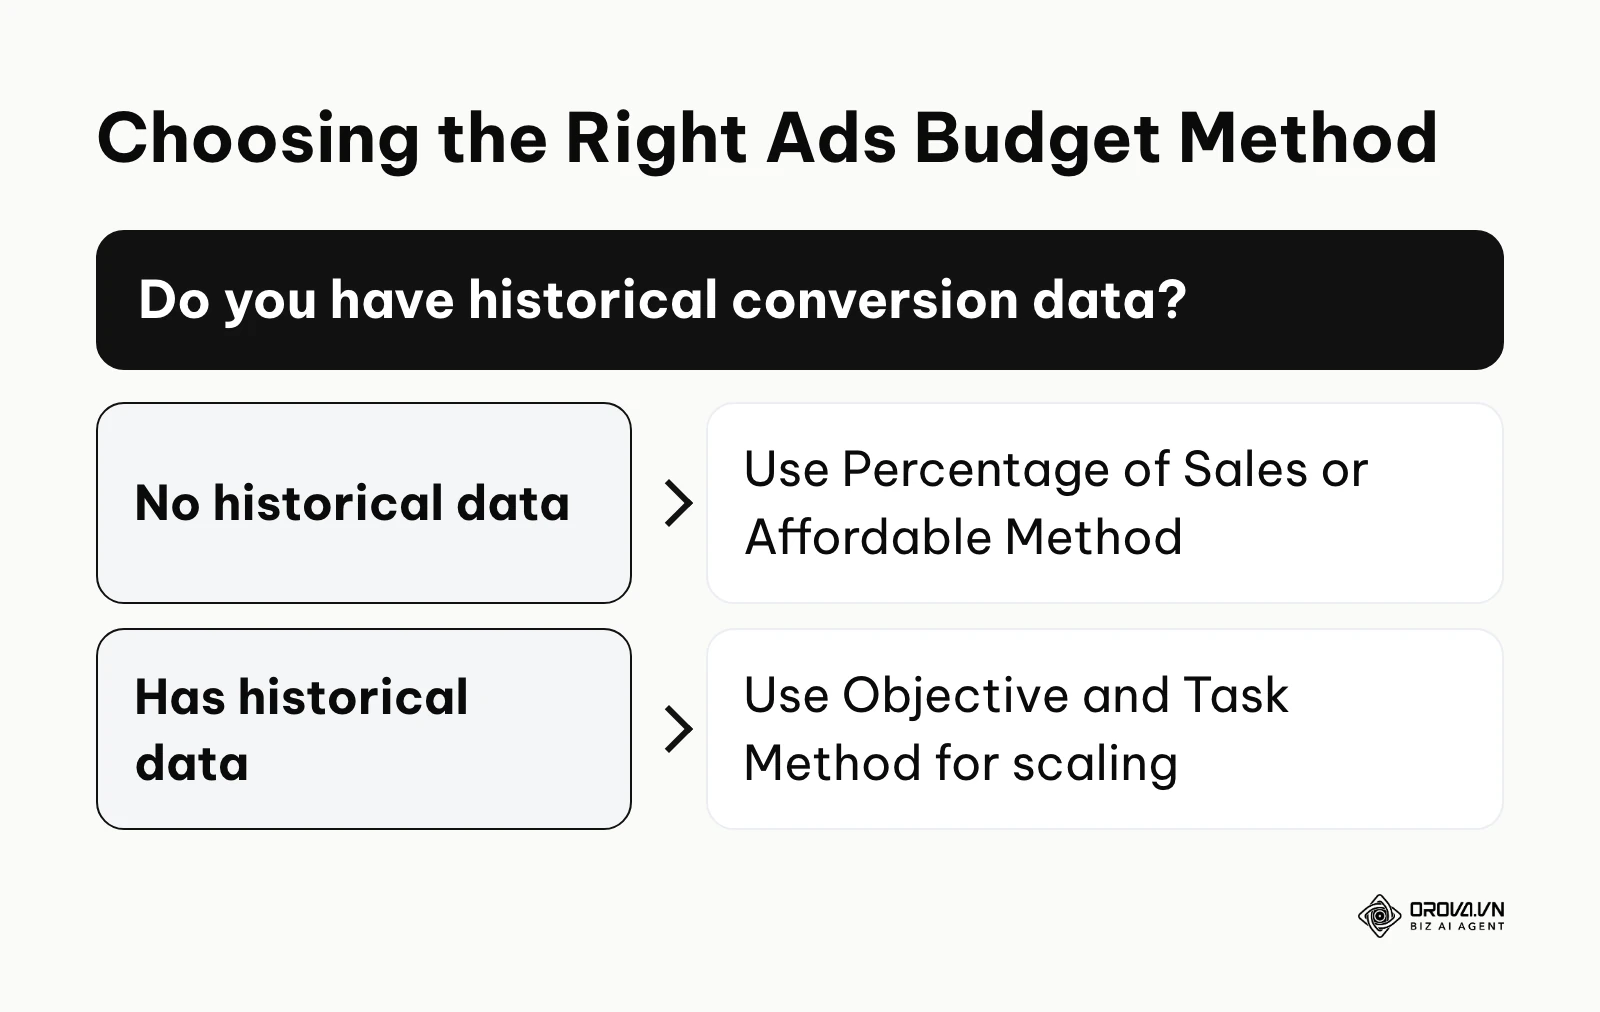
The Percentage of Sales method involves taking a fixed percentage of past revenue and allocating it to future ads. It is safe but backwards-looking. If sales drop, your budget drops, which can trigger a death spiral.
The Competitive Parity method involves matching what you believe your rivals are spending. This is highly dangerous because you do not know their profit margins or conversion rates; copying them might bankrupt you.
The Affordable Method simply takes whatever cash is left over after operating expenses and uses it for ads. This is common for bootstrapped startups but prevents aggressive scaling.
The Objective and Task method is the gold standard. You define the objective (for example, acquire 1,000 customers), determine what you can pay to acquire one customer (say 50), and set the budget based on that math (1,000 × 50 = 50,000).
To apply the Objective and Task method, copy the following template structure into your own spreadsheet. Column B shows an illustrative example with round numbers:
| Column A (Inputs) | Column B (Formula and illustrative example) |
|---|---|
| Revenue target | 100,000 |
| Average order value (AOV) | 200 |
| Target number of sales | = Revenue target ÷ AOV → 500 sales |
| Historical conversion rate | 2% |
| Required traffic (clicks) | = Sales ÷ Conversion rate → 25,000 clicks |
| Your own average cost per click (from past campaigns) | 2 |
| Total required ads budget | = Required traffic × Cost per click → 50,000 |
| Implied cost per sale | = Budget ÷ Sales → 100 (compare with your target CAC in Step 3) |
Use your own historical cost per click rather than a generic industry figure; click costs vary so much by market, keyword, and season that a borrowed number can make the whole sheet meaningless.
By plugging your historical data into this blueprint, you immediately know if your revenue goals are mathematically possible given your current website performance and click costs. In the example, each sale costs 100 in media against an order value of 200, so the plan only works if gross profit per order comfortably exceeds 100.
Step 3: Calculate your breakeven and target CAC
You cannot launch a campaign without knowing your absolute breakeven point. This requires calculating your target Customer Acquisition Cost (CAC).
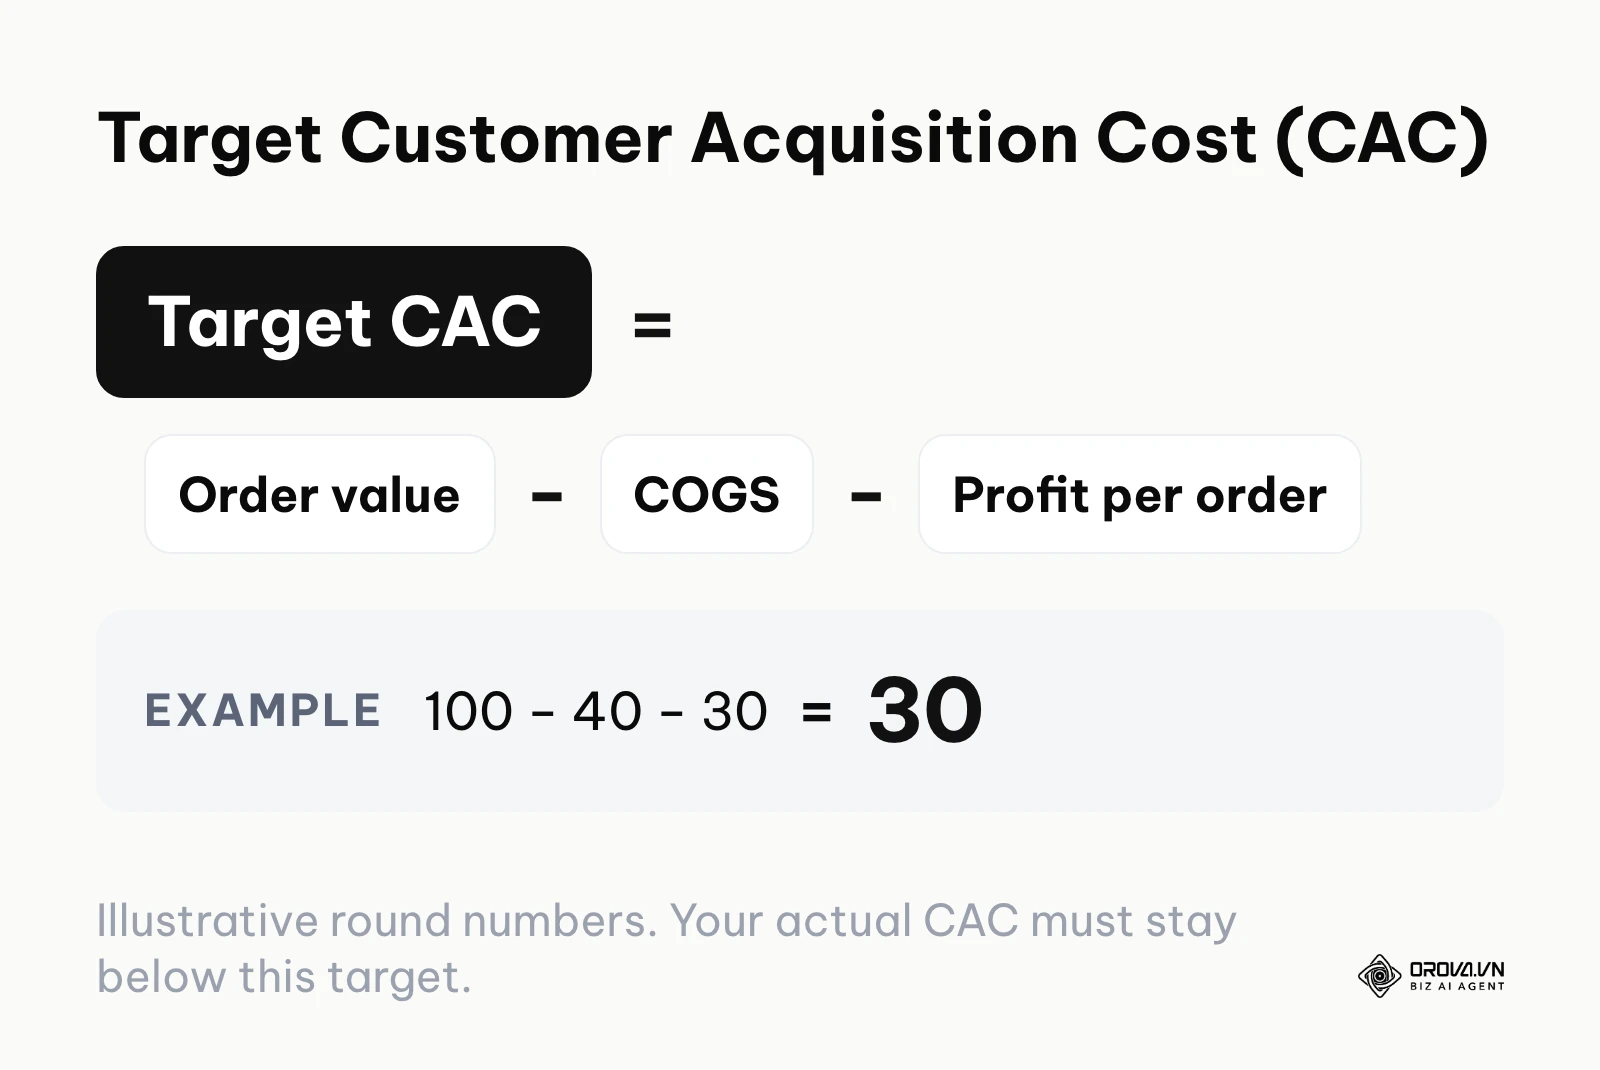
To calculate your breakeven CAC, subtract your Cost of Goods Sold (COGS) from your Average Order Value (AOV). Illustrative example: if you sell a product for 100, and it costs 40 to manufacture and ship, your gross profit is 60. Therefore, your absolute maximum CAC is 60. If you spend 61 to acquire a customer, you are losing money on the first purchase. However, you want to make a profit. If you want to keep half of that 60 as profit (30 per order), your target CAC becomes 100 − 40 − 30 = 30.
The same logic as a formula: Target CAC = AOV − COGS − desired profit per order. If customers reliably buy again, you can raise the target using lifetime value instead of a single order, but only when you have real repeat purchase data to back it up.
You must also understand Google Ads pricing structure and how different network costs will impact your ability to hit this CAC target. Once campaigns are live, the same numbers translate into a minimum return you need from each platform; this walkthrough of the ROAS formula shows how to turn your margin into a breakeven ROAS.
Illustrative example: An online store selling office chairs has an average order value of 150 and a product cost of 75. Ignoring everything else, it sets a target CAC of 40, allocates 10,000 to Meta ads for the month, expects 250 sales (10,000 ÷ 40), and sets a daily budget of about 330. The plan leaves out shipping of 15 per order and the cost of returns. Once those are included, gross profit per order falls to roughly 50, and keeping half of it as profit means the target CAC should be closer to 25. Acquiring customers at 35 looks profitable on the ad dashboard while cash is actually leaving the business. The fix is to pause, recalculate margins with shipping and returns included, lower the target CAC, and shift budget toward higher-intent search campaigns (or raise the price) before scaling again.
Step 4: Implement cross-channel allocation strategies
Once you have your total budget number, you must decide where to spend it. Putting 100 percent of your budget into a single platform is a massive risk. If that platform changes its algorithm or suspends your account, your revenue drops to zero instantly.
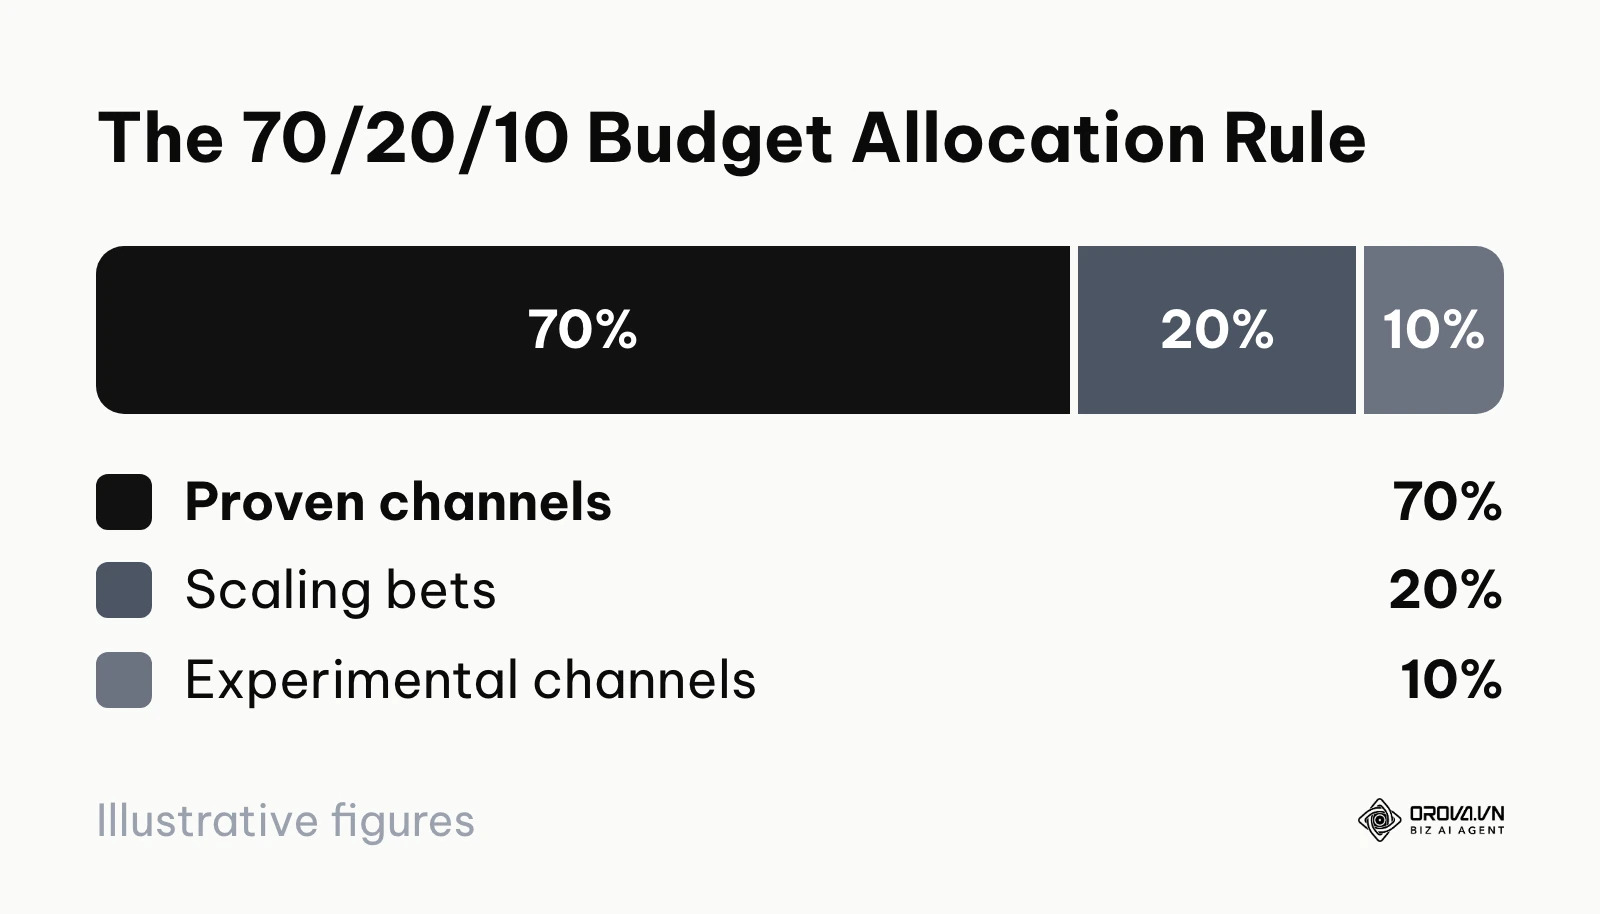
The most reliable framework is the 70/20/10 rule for cross-channel budget allocation.
Allocate 70 percent of your budget to proven channels that generate consistent, high-intent conversions. For most businesses, this means Google Search (capturing people actively looking for your product) and Meta retargeting campaigns (converting people who already visited your site). This bucket ensures your core business remains profitable.
Allocate 20 percent to safe bets meant for scaling. These are channels that show promise but require broader audiences. This might include Meta broad targeting, TikTok audiences similar to your buyers, or YouTube video ads. The goal here is volume, generating new intent rather than just capturing existing intent. If you are still deciding which networks belong in which bucket, this comparison of paid ad platforms helps match each channel to the job you need it to do.

Allocate the final 10 percent to purely experimental channels. This could be Pinterest, Reddit ads, or testing entirely bizarre creative concepts on your main platforms. You expect to lose money on this 10 percent. Its purpose is to discover the next big scaling opportunity before your competitors do.
Step 5: Factor in seasonal fluctuations and campaign testing
Your ads budget should never be a flat line across twelve months. Consumer behavior is highly seasonal.
An e-commerce brand might spend 40 percent of its entire annual budget in November and December to capitalize on Black Friday and holiday shopping. Conversely, a B2B software company might reduce its budget heavily in late December because corporate decision-makers are on vacation, reallocating those funds to a massive push in January when new corporate budgets unlock.
Furthermore, you must ring-fence a portion of your budget specifically for creative testing. Ad creatives fatigue over time. If a video ad runs for three months, the audience gets tired of seeing it, and your cost per acquisition will spike. You must constantly spend money testing new hooks, headlines, and visuals so that when your main ad dies, you have a replacement ready to take its place.
Step 6: Set up pacing and governance
The final step is establishing rules for how the money is actually deployed day by day. This is called pacing. Illustrative example: with a monthly budget of 30,000, you roughly need to spend 1,000 per day.
However, weekends might perform worse than weekdays. You must monitor pacing closely to ensure you do not spend 25,000 in the first 15 days of the month, leaving you with no presence for the final two weeks.
Set up automated rules inside the ad platforms to alert you if daily spend exceeds a certain threshold. Create a simple pacing sheet where you input your spend every Monday morning. If you are under-spending, you can increase bids. If you are over-spending, you can lower daily caps. Governance ensures that emotional, panicked decisions are replaced by calculated adjustments based on the pacing schedule.
OROVA ADS applies AI Agent to automate and optimize ad performance on Google, Meta and TikTok. Scale your budget safely, monitor 24/7 and expand your business quickly.
Experience the solution at orova.vn/ads
Budget strategy analysis: Startup vs. Enterprise
How you manage an ads budget changes fundamentally based on the maturity and scale of your business. A strategy that works brilliantly for a fast-moving startup will cause a massive enterprise to lose market share. Conversely, an enterprise strategy will bankrupt a startup within a week.
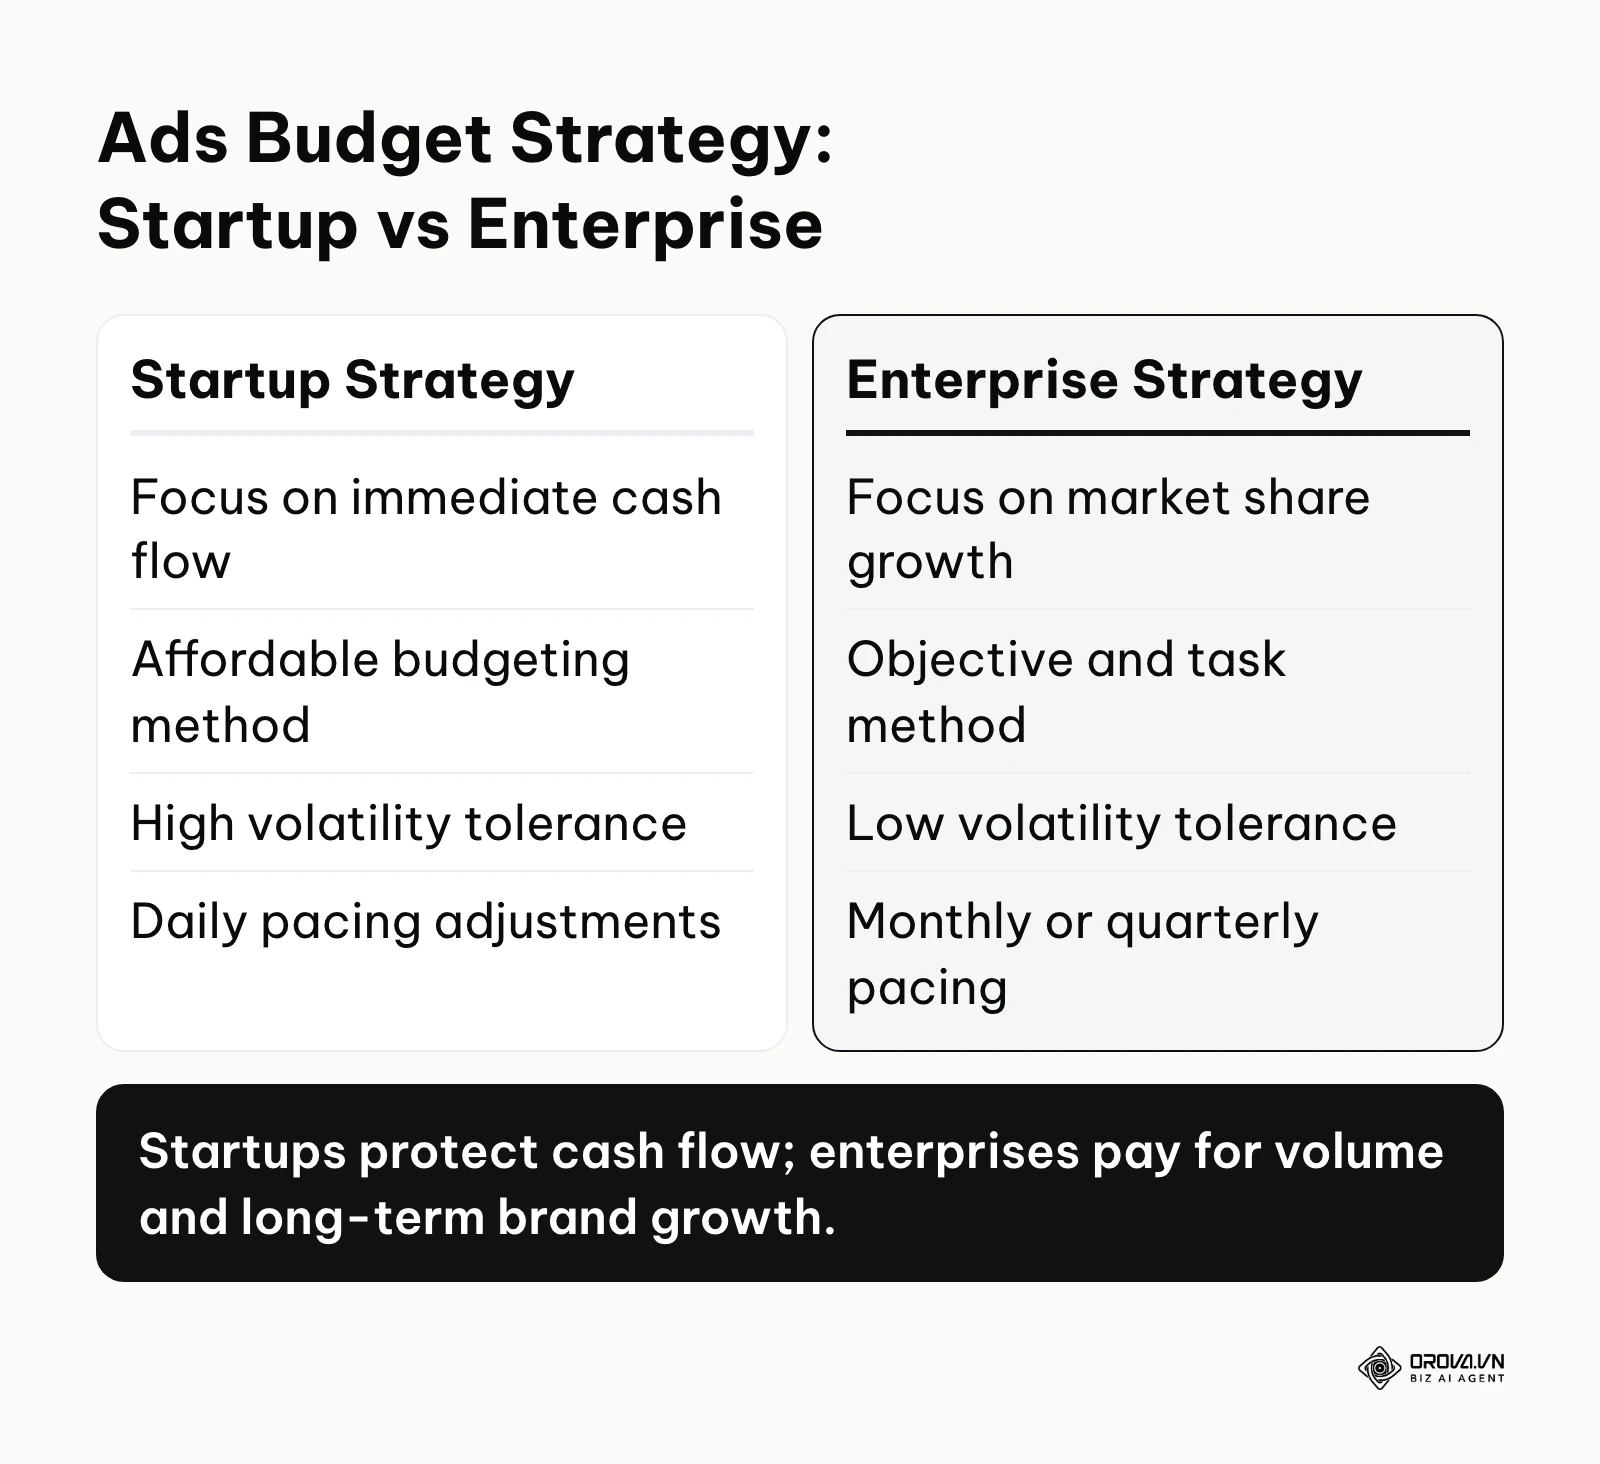
| Budget Strategy | Best Suited For | Key Weakness |
|---|---|---|
| Lean and Agile (Startup) | Bootstrapped companies, tight cash flow | Struggles to build long-term brand awareness |
| Objective-Driven (Enterprise) | Mature brands, heavily funded companies | Slow to react to sudden daily market shifts |
| Performance-Only (Agency) | Direct-to-consumer product launches | Ignores the value of unmeasurable organic lift |
The startup approach: Lean, agile, and survival-focused
For a startup, cash flow is the only thing that matters. Startups generally utilize a hybrid of the Affordable method and extreme performance marketing. Every dollar spent on ads must return more than a dollar to the bank account within a 30-day window, or the company risks missing payroll.
Because of this, startup budgets are highly volatile. A founder might check ad accounts three times a day. If a campaign looks unprofitable by Tuesday afternoon, they will ruthlessly cut the budget. They prioritize Bottom of Funnel channels almost exclusively. They cannot afford to spend 5,000 on a brand awareness video that might pay off six months from now. The focus is entirely on direct response: click the ad, buy the product, generate cash.
Illustrative example: A B2B SaaS company offering project management software moves from a fixed percentage of revenue to an objective-and-task ads budget. It sets a quarterly budget of 50,000 and splits it evenly between LinkedIn and Google Ads. After a month, LinkedIn leads cost 125 each and Google Ads leads cost 50 each, so Google looks far cheaper. However, the sales team reports that LinkedIn leads close at 20 percent while Google leads close at 2 percent. Over the full quarter, the even split of 25,000 per channel buys 200 LinkedIn leads (40 customers) and 500 Google leads (10 customers): 50 customers in total. The team switches its core measurement from cost per lead to cost per paying customer and moves 80 percent of the budget to LinkedIn. The same 50,000 now buys 320 LinkedIn leads (64 customers) and 200 Google leads (4 customers): 68 customers, roughly a third more, without spending a single extra unit of budget.
The enterprise approach: Objective-driven and holistic
Large enterprises view advertising budgets through the lens of market share and brand dominance. If you want to understand how this is executed at scale, review the principles of advanced PPC ad management. Enterprises utilize the Objective and Task method almost exclusively. Budgets are set annually or quarterly and are incredibly difficult to change once approved by the CFO.
An enterprise can afford to run campaigns that lose money on the first purchase because it has historical data showing that customers keep buying over the following years. They have a high tolerance for daily volatility. A bad week of ad performance will not cause an enterprise marketing team to panic and shut off campaigns; they understand that algorithmic learning phases take time. They heavily fund Top of Funnel brand awareness campaigns, knowing that making their logo recognizable will eventually drive down the cost of their direct response campaigns over the long term.
Measuring ads budget efficiency
Setting the budget is only half the battle. You must relentlessly measure whether that budget is being deployed efficiently. Do not rely solely on the metrics provided by the ad platforms, as they have an inherent bias to take credit for as many sales as possible.
| Efficiency Metric | Meaning and Importance | Worrying Threshold |
|---|---|---|
| Return on Ad Spend (ROAS) | Revenue generated for each unit of currency spent on a specific ad platform. | Falling below your breakeven ROAS calculation. |
| Cost Per Acquisition (CPA) | The total cost to acquire one paying customer. | Exceeding your gross profit margin limit. |
| Marketing Efficiency Ratio (MER) | Total business revenue divided by total marketing spend across all channels. | Dropping below the MER your own margins require to stay profitable. |
| Search Impression Share | The percentage of times your ad was shown out of the total eligible searches. | A sudden drop on your own brand name terms. |
The most common trap is hyper-focusing on platform ROAS. If a user clicks a Facebook ad, does not buy, then searches your brand on Google the next day and buys, both Facebook and Google might claim 100 percent credit for that sale in their respective dashboards. If you add up the revenue reported by both platforms, it will look like you made twice as much money as you actually did.
This is why advanced marketers rely on the Marketing Efficiency Ratio (MER). MER looks at the global picture. Illustrative example: "I spent 10,000 on all ads this month, and my total store revenue was 40,000. My MER is 40,000 ÷ 10,000 = 4.0." It ignores platform attribution fights and tells you if your overall budget allocation is actually driving top-line business growth. To connect that ratio to profit rather than revenue, pair it with a proper marketing ROI calculation.
When measuring efficiency, patience is required. Modern ad algorithms rely heavily on machine learning. When you launch a new campaign, it enters a learning phase where performance will be highly unstable. Give a new ads budget allocation enough time and conversions to leave that phase, often one to two weeks, before judging its efficiency.
Want to scale your budget but afraid of breaking performance? 📉
Integrate OROVA ADS now - an AI Agent that automatically monitors and optimizes Google, Meta, TikTok ads 24/7. Now, expanding and replicating your Performance Ads team is just one click away.
🚀 Try it now at: orova.vn/ads
Common ads budget allocation mistakes and how to fix them
Even with a perfect spreadsheet, human error often ruins budget execution. The psychology of spending money can cause marketers to make irrational decisions that sabotage their own campaigns. Here are the most frequent mistakes and how to rectify them.
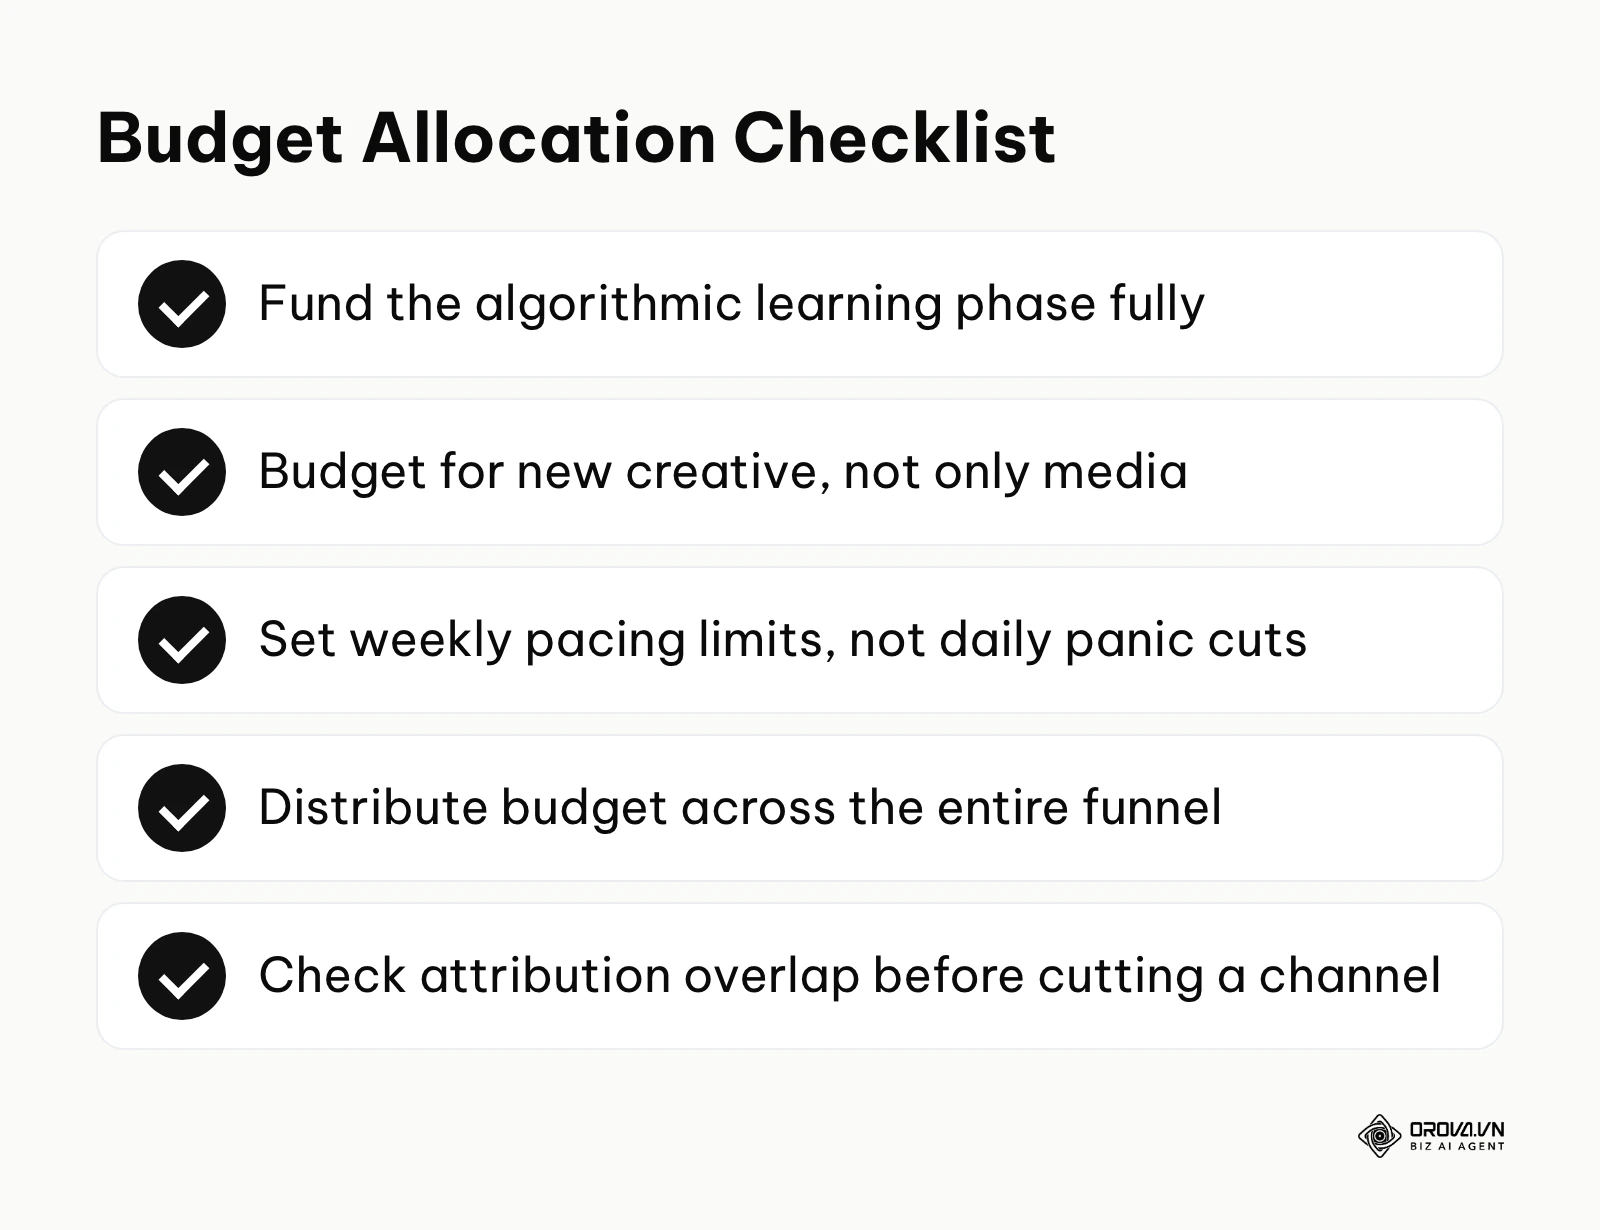
First, marketers frequently starve the algorithmic learning phase. Meta's own guidance describes the learning phase as needing around 50 optimization events within a week to stabilize delivery. If your budget only buys a handful of conversions a week, that threshold is never reached. The algorithm never learns who your ideal customer is, and your cost per acquisition remains permanently inflated. If you have a small budget, you must consolidate it into fewer campaigns rather than spreading it thin across dozens of ad sets.
Second, many businesses ignore ad fatigue and the associated creative production costs. Video formats are taking a growing share of paid media, and video is the most expensive kind of creative to refresh. If you allocate 100 percent of your funds to media distribution and zero to creating new video assets, your campaigns will wear out quickly. People stop clicking on ads they have seen a dozen times.
Third, advertisers tend to overreact to daily performance fluctuations. A campaign might generate an amazing return on Monday and a terrible return on Tuesday. Panicked marketers will cut the daily budget on Wednesday. This constant micro-management resets the algorithm's learning phase every single time, ensuring the campaign never stabilizes.
Illustrative example: A local HVAC service business decides to manage its own digital ads budget to save on external agency fees. It sets a monthly ads budget of 2,000 on Google Local Services Ads. Worried about overspending, the owner checks the account every few hours from his phone. If a day starts slow with no calls by noon, he lowers the budget, only to raise it again the next morning when he feels optimistic. These constant changes keep disrupting the platform's learning, so lead costs swing wildly and weekend volume disappears. The turnaround comes when he stops making daily changes, sets a firm weekly pacing limit, and leaves the campaigns untouched for two weeks. Lead costs settle into a predictable range, showing that algorithms need budget stability to perform properly.
Fourth, there is a dangerous tendency to place the entire budget into bottom-of-funnel retargeting. Retargeting yields the highest ROAS because you are selling to people who already know you. However, the audience pool is small. If you do not spend money on top-of-funnel campaigns to drive new traffic, your retargeting pool will dry up, and your overall revenue will plateau.
Finally, failing to account for attribution overlap leads to disastrous budget shifts. If you blindly trust the dashboard, you might cut a top-of-funnel video campaign because it shows zero direct sales, not realizing that it was generating the initial interest that made your search ads so profitable.
Ads budget trends in the next few years: My perspective
The death of manual daily budget pacing
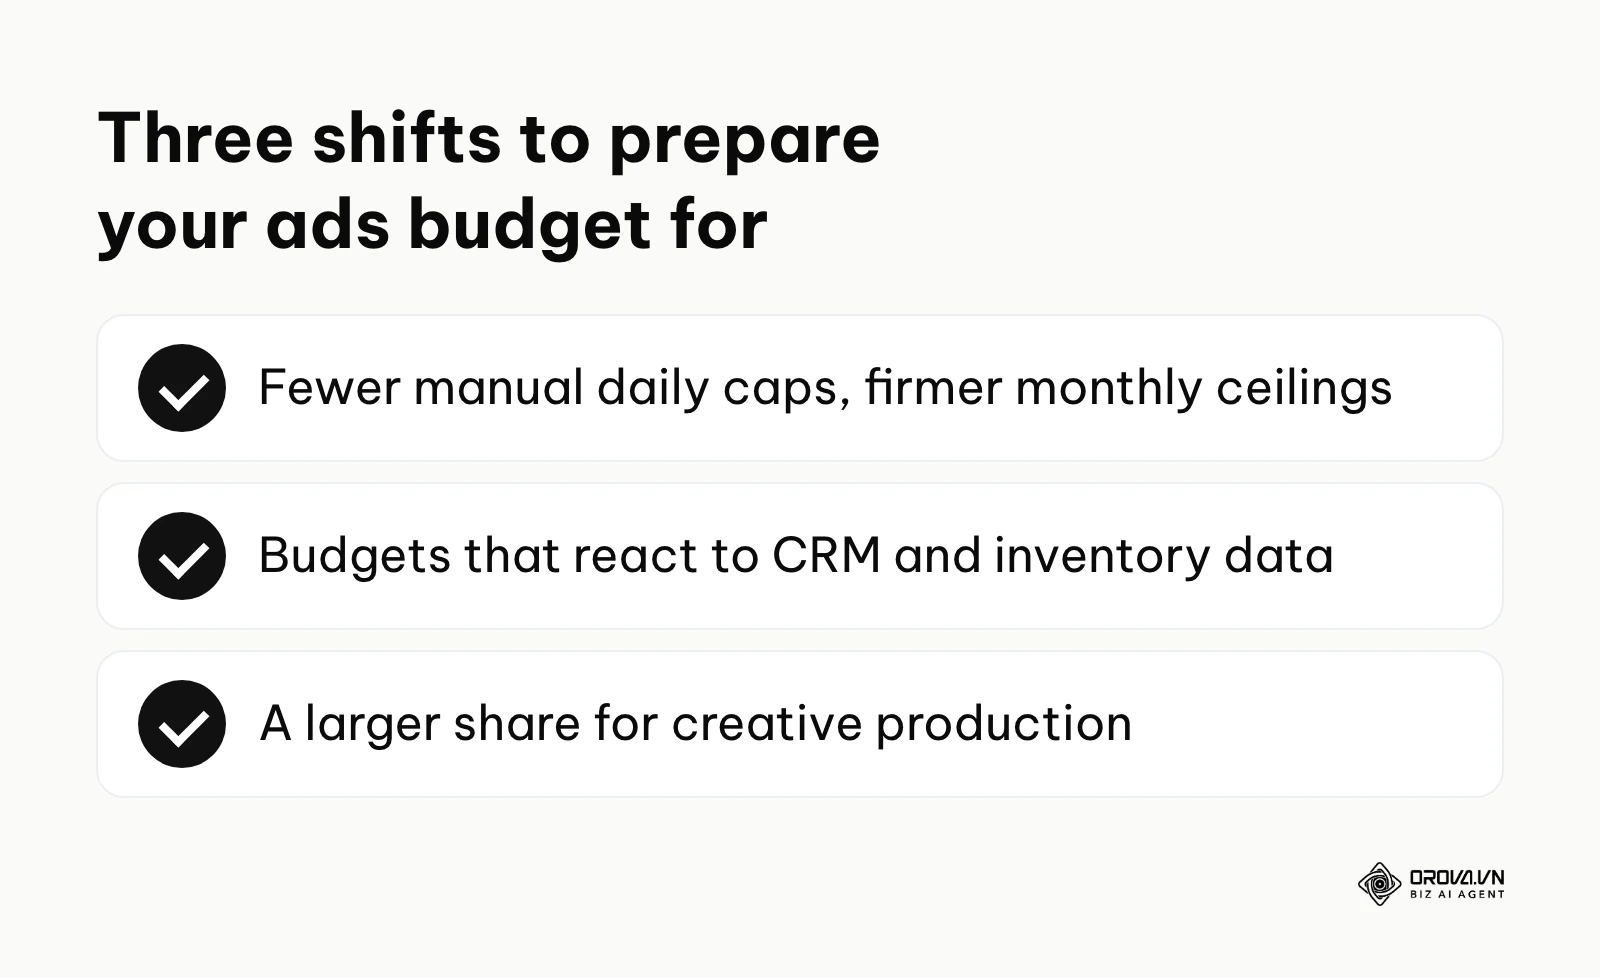
Advertising platforms are steadily pushing automated, campaign-level budgeting through products like Google's Performance Max and Meta's Advantage+ campaigns. These systems work best when they are not boxed in by tight manual daily constraints. I expect that manually setting a daily spend cap for each individual ad set will matter less and less. Instead, I think marketers will increasingly set target margins and firm monthly ceilings, and let the platforms route spend across hours, days, and placements within those limits. You must prepare for this by shifting your operational focus away from daily budget pacing spreadsheets and toward feeding the platforms higher-quality conversion data via APIs.
AI predictive budgeting replacing static templates
Currently, most companies still rely on static Excel sheets based on last month's performance to dictate next month's spend. I expect AI agents connected to CRM and inventory data to take over more and more of this calculation. If you are interested in this technical shift, you can explore the underlying AI ad optimization strategies. In my view, a natural next step is budgets that react to stock levels: when a best-selling product is running low, spend on it is reduced and moved toward items with plenty of inventory, with a human approving the rules. To prepare, you must ensure your business data infrastructure is pristine; AI cannot optimize budgets if your sales data is disconnected from your marketing platforms.
The rise of the creative budget overtaking media spend
For the past decade, media buying was a highly technical skill that required significant budget oversight. Today, algorithms have largely commoditized media buying. Because of this, I believe brands will gradually shift a larger share of their total ads budget toward creative production rather than just media distribution. When the auction itself is largely automated, better and more varied creative is one of the few levers left that competitors cannot simply copy. Businesses should prepare now by building in-house content engines or partnering with scalable creator networks, ensuring that budget constraints never slow down the rate of creative testing.
Frequently asked questions about ads budget
How much should a small business spend on ads?
There is no universal percentage that fits every small business. Start from your margins: calculate the most you can pay to acquire a customer, multiply it by the number of customers you need, and check that the total fits your cash reserve. If you are a brand-new startup with zero revenue, you should rely on the Affordable method, setting aside a strict cash amount you are willing to lose in order to acquire your first batch of customer data.
Can AI completely manage my ads budget?
AI can automate the daily pacing, bid adjustments, and cross-campaign routing of your ads budget with high efficiency. However, AI cannot define your business strategy, profit margin requirements, or overall cash flow limits; human oversight is still required to set the initial financial guardrails and business objectives before handing execution over to the AI.
When should I increase my ads budget?
You should scale your budget only when your current campaigns are consistently generating a Cost Per Acquisition (CPA) that sits comfortably below your breakeven point for at least two weeks. Increase the budget incrementally—usually by 15 to 20 percent every few days—to avoid resetting the platform's algorithmic learning phase.
What is the difference between a marketing budget and an ads budget?
A marketing budget is the overarching financial plan that covers everything from SEO, public relations, event sponsorships, to marketing software subscriptions. An ads budget is a specific sub-category within the marketing budget dedicated solely to paying for digital or traditional media placement, such as Google search clicks or billboard space.
How do I handle budgeting when a channel suddenly underperforms?
If a proven channel drops in performance, do not immediately slash its budget to zero, as this may just be a temporary auction fluctuation. Instead, reduce its daily spend by 20 percent to limit losses while investigating issues like creative fatigue or tracking errors, and temporarily shift those funds into your "Safe Bets" allocation to maintain overall lead volume.
Where should you start?
If you are just starting out and have absolutely no historical data, your first step is to calculate your absolute breakeven Customer Acquisition Cost (CAC) using your product pricing and cost of goods sold. Do not launch a single campaign or set a daily budget until you know exactly how much you can afford to pay for a customer before you start losing money.
If you are already running ads but your return on investment is highly inconsistent, your first step is to audit your current spend against the 70/20/10 allocation rule. Open your ad dashboards today and calculate what percentage of your budget is tied up in highly experimental audiences versus proven retargeting and high-intent search. Rebalance your daily caps to ensure 70 percent is defending your core revenue stream.
If you are spending heavily across multiple platforms and feel like you are losing track of actual profitability, your first step is to pause looking at platform-specific ROAS. Spend your next working session pulling your total ad spend from all channels and dividing it by your total gross store revenue to calculate your global Marketing Efficiency Ratio (MER). This single number will tell you instantly if your overall budget strategy is actually working for the business.
About the author

Builder of Orova
Nguyễn Đỗ Trọng Ân has 8 years of experience in marketing, including 6 years managing market development across Asia. He builds Orova, a Biz AI Agent that never sleeps: it plans, runs and optimizes work for businesses.
Run your business with AI Agents
Orova is the always-on Biz AI Agent — it plans, runs, and optimizes the work for you.
Save time, unlock productivity.