
Social analytics tools in 2026: a buyer's framework by team size

Managing digital presence without measuring impact is like driving with your eyes closed, which is why choosing the right social analytics tools is critical for survival in 2026. The sheer volume of data generated across networks daily can easily overwhelm even seasoned marketing teams. Relying solely on fragmented, native dashboards often leads to critical blind spots and misaligned budgets. The short answer: solo marketers can start with the free native dashboards (Meta Business Suite, YouTube Analytics, TikTok Analytics); growing teams usually shortlist all-in-one platforms such as Buffer, Hootsuite, Sprout Social, Metricool or Agorapulse; and large brands that need listening across the public web look at Brandwatch, Meltwater or Sprinklr. This guide gives you a buyer's framework to choose between them: how to group platforms by business scale, which cost questions to ask before signing a contract, and how to judge the AI features each one offers.
What are social analytics tools and how to evaluate them
Social analytics tools are specialized software applications designed to aggregate, measure, and interpret data from various social media networks into actionable business intelligence. These platforms solve the fundamental problem of data fragmentation. Instead of logging into five different networks to manually record engagement rates in a spreadsheet, these tools automatically pull performance metrics via Application Programming Interfaces (APIs). Organizations of all sizes need these systems to justify marketing spend, understand audience sentiment, and optimize content strategies. The criteria for evaluating these tools include data accuracy, integration depth, artificial intelligence features, ease of use, and transparent pricing structures.
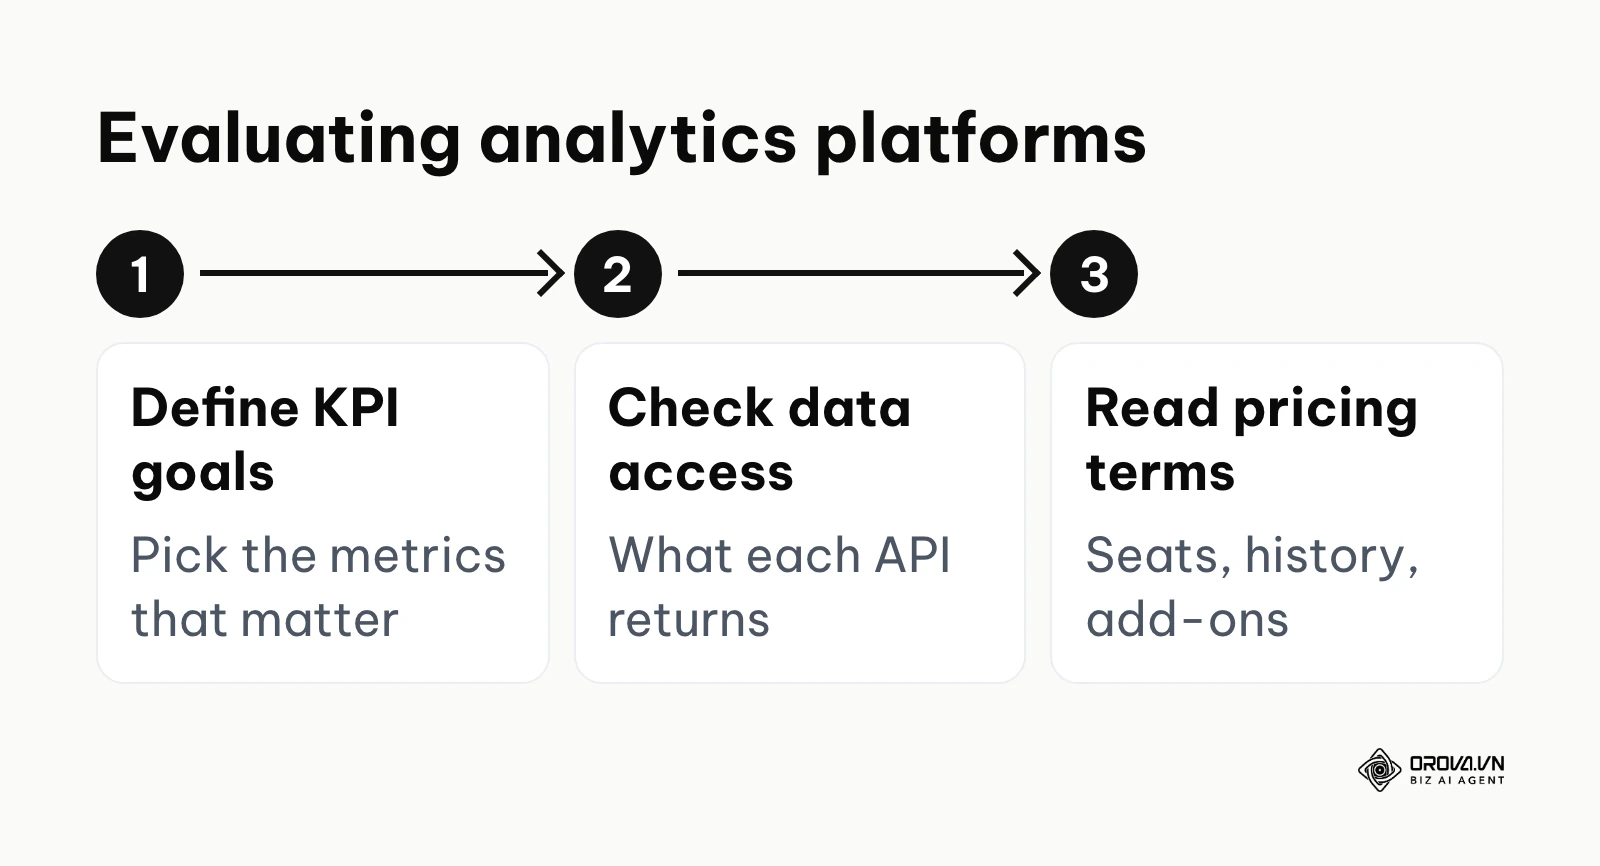
Evaluating the correct tool requires understanding the exact limitations of the software. Not all platforms are granted equal API access by the native networks. For instance, some tools can pull granular demographic data, while others are restricted to top-level engagement metrics. Furthermore, as of 2026, artificial intelligence is no longer an optional add-on; it is a foundational requirement for processing unstructured data like video comments and brand imagery. A thorough evaluation must look beyond the glossy dashboard interface and question the underlying data architecture. You should not adopt an enterprise-grade system if your primary goal is simply scheduling weekly posts, just as you should avoid basic schedulers if you require deep sentiment analysis across global markets. Finally, read the pricing terms closely: how user seats, historical data and add-ons are billed often matters more than the headline plan.
The 2026 social analytics tools comparison matrix
Choosing a platform starts with understanding the landscape. This matrix groups well-known tools available as of 2026 based on their core functionality, the specific value they deliver, and the business scale they best serve. The tools are grouped by the fundamental jobs they perform rather than alphabetical order, helping you immediately identify the category that aligns with your operational maturity.
| Name | Category | Core Use Case | Value Proposition | Best For |
|---|---|---|---|---|
| Meta Business Suite | Native & Free | Basic page insights | Zero cost, highly accurate native data | Solopreneurs |
| YouTube Analytics | Native & Free | Video retention tracking | Deep audience behavior insights | Video creators |
| TikTok Analytics | Native & Free | Short-form video tracking | Views, profile visits and audience activity hours | Viral marketers |
| Hootsuite | All-in-One | Multi-network management | Unified inbox and standard reporting | Growing agencies |
| Sprout Social | All-in-One | Advanced team collaboration | Deep analytics and approval workflows | Mid-market teams |
| Buffer | All-in-One | Streamlined scheduling | Cost-effective, simple reporting interface | Small businesses |
| Orova Social | Publishing & AI content | Multi-channel publishing (pair with native analytics) | Write once, publish to 8 channels, AI captions and images | Content-heavy teams |
| Metricool | All-in-One | Brand portfolio tracking | Plans organized around the brands you manage | Freelancers |
| Agorapulse | All-in-One | ROI tracking | Social ROI reporting with UTM tracking | B2B agencies |
| Brandwatch | Enterprise | Global sentiment analysis | Unstructured data processing via Boolean logic | Global enterprises |
| Meltwater | Enterprise | PR and social monitoring | Unified view of news media and social chatter | Corporate comms |
| Sprinklr | Enterprise | Omnichannel routing | Unified customer experience suite | Large enterprises |
| Dash Social (formerly Dash Hudson) | Specialized | Visual intelligence | Predicting image success before publishing | E-commerce brands |
| Later | Specialized | Link-in-bio optimization | Visual grid planning and conversion tracking | Instagram focused |
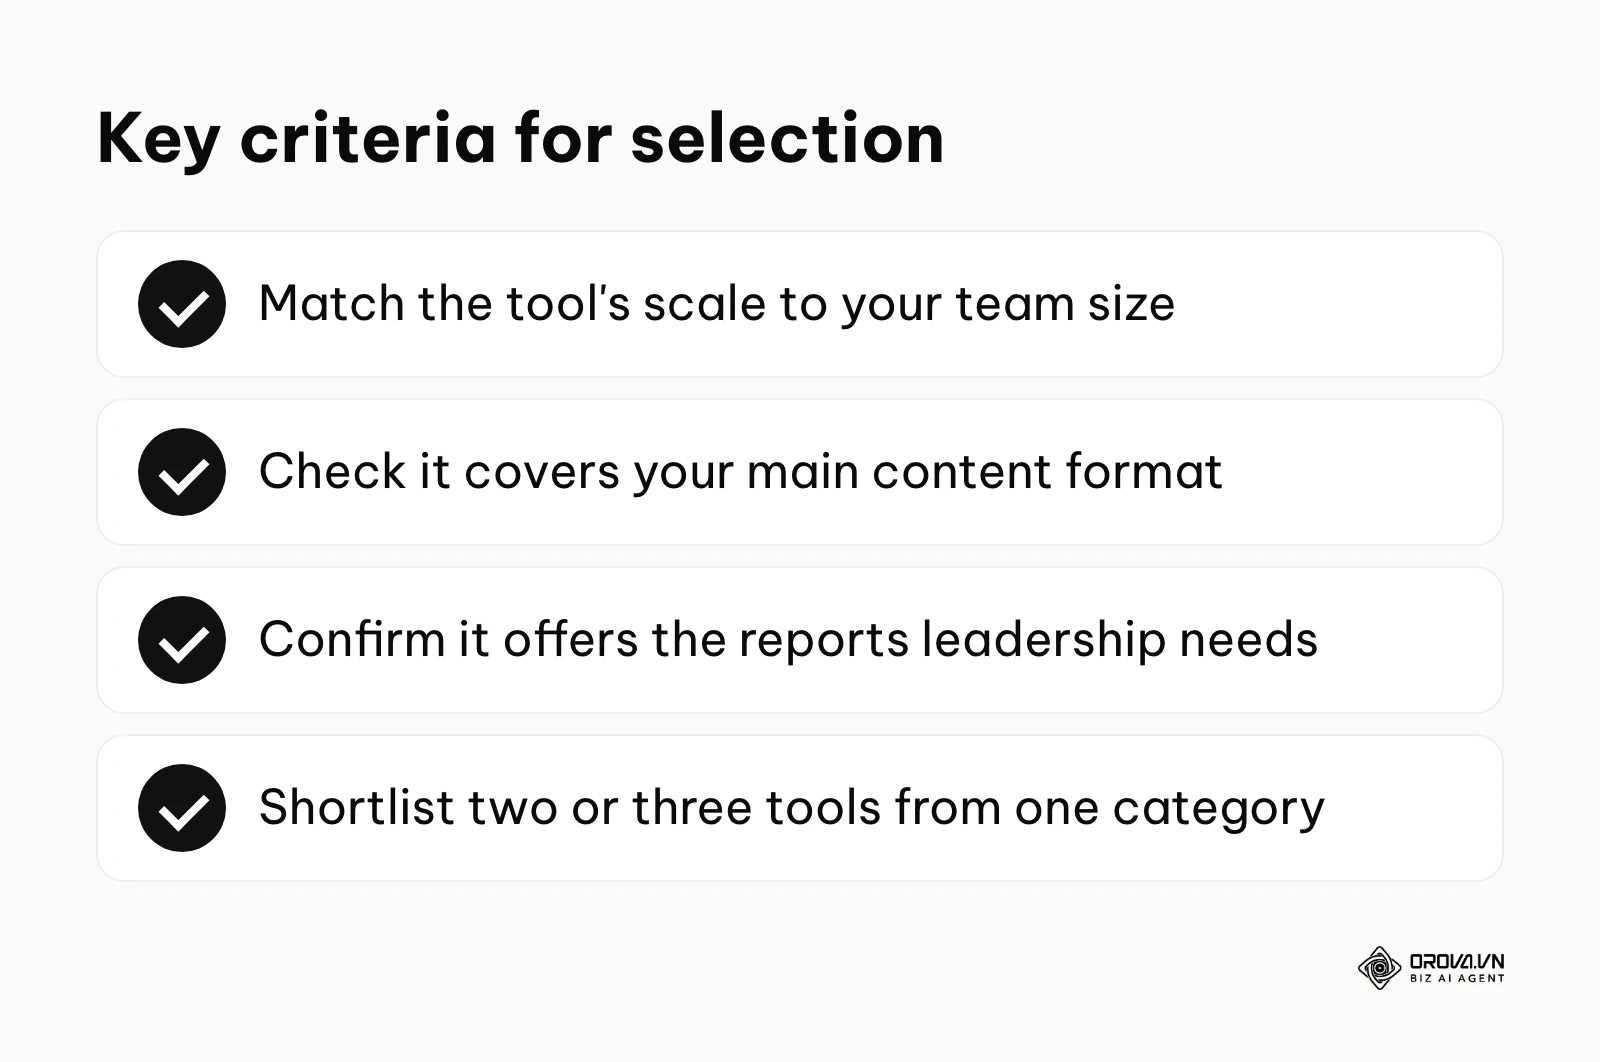
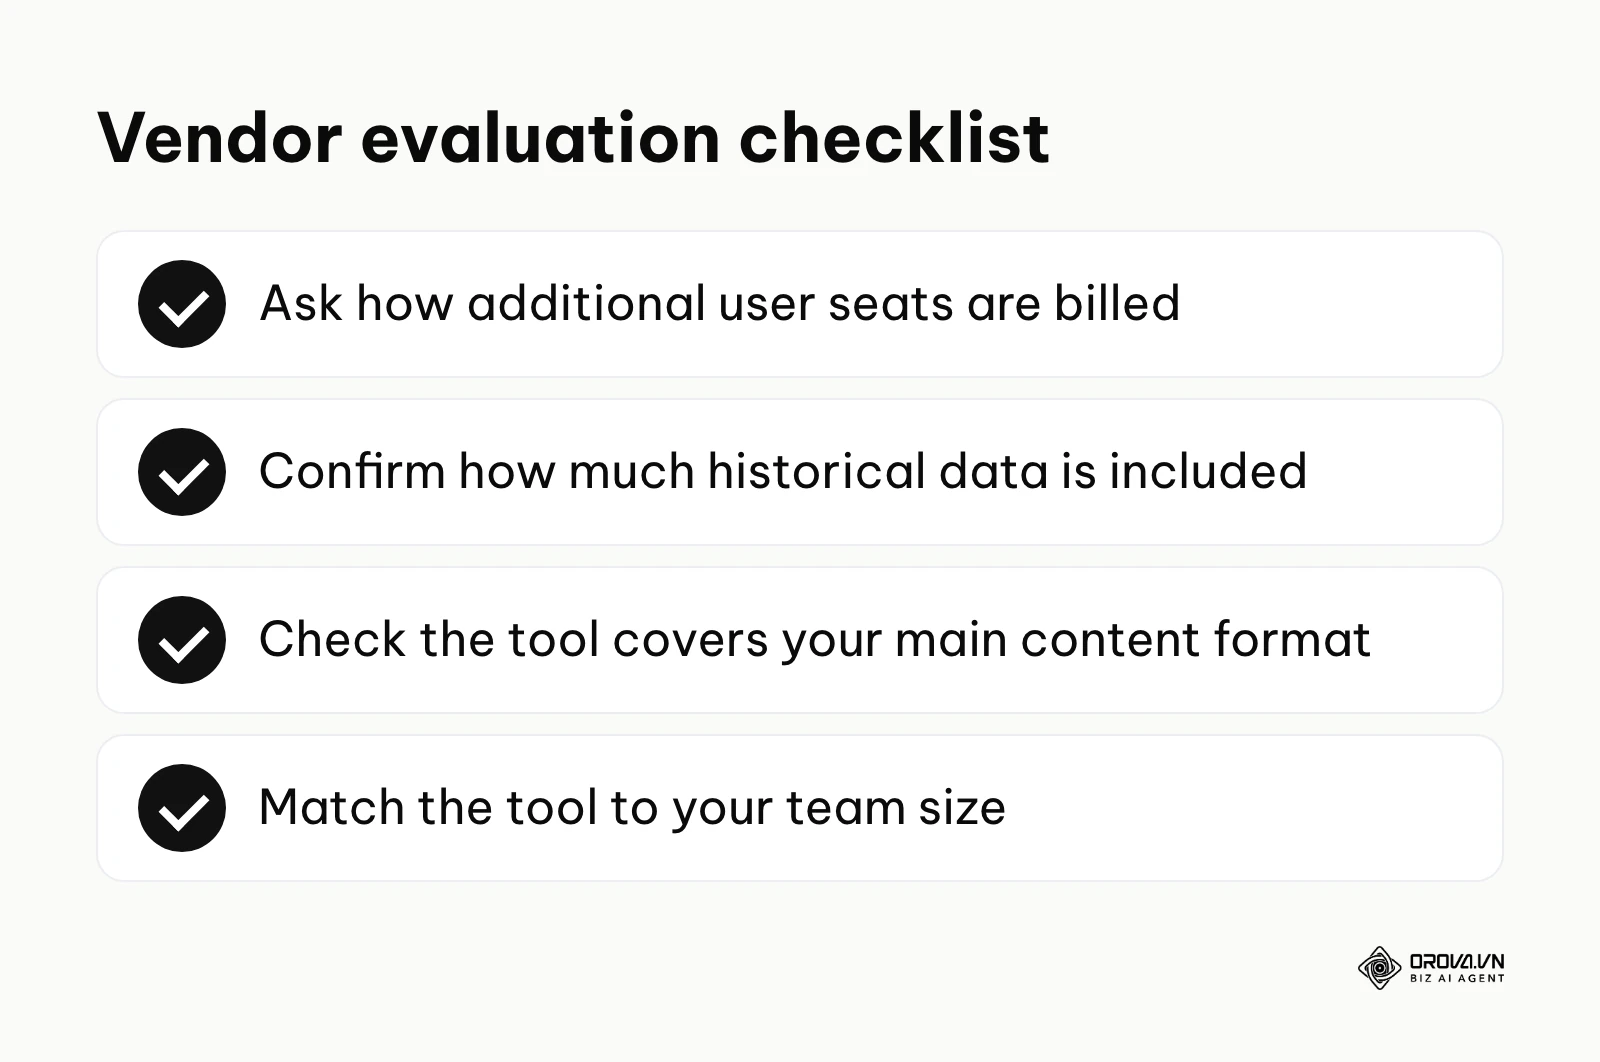
When you read the matrix, match the tool's scale to your team size, check that each shortlisted tool covers your main content format and offers the reports your leadership needs, then shortlist two or three tools from one category before booking demos. This table provides a high-level overview. The true differentiation between these platforms lies in their specific feature sets, plan limits, and daily operational workflows.
Analytics shows what worked; the next step is publishing more of it. With Orova Social you write a post once, publish it to 8 channels, let AI write captions in your brand voice and cut long videos into vertical clips with subtitles.
Detailed breakdown by core use case
To make an informed decision, you must examine the specific mechanics of each platform within its category. The needs of a solo consultant differ entirely from those of a multinational corporation. The following sections break down the market leaders, covering what they do, the AI features they offer, the cost questions worth asking, learning curves, and first steps.
Free & Native Platforms for Immediate Insights
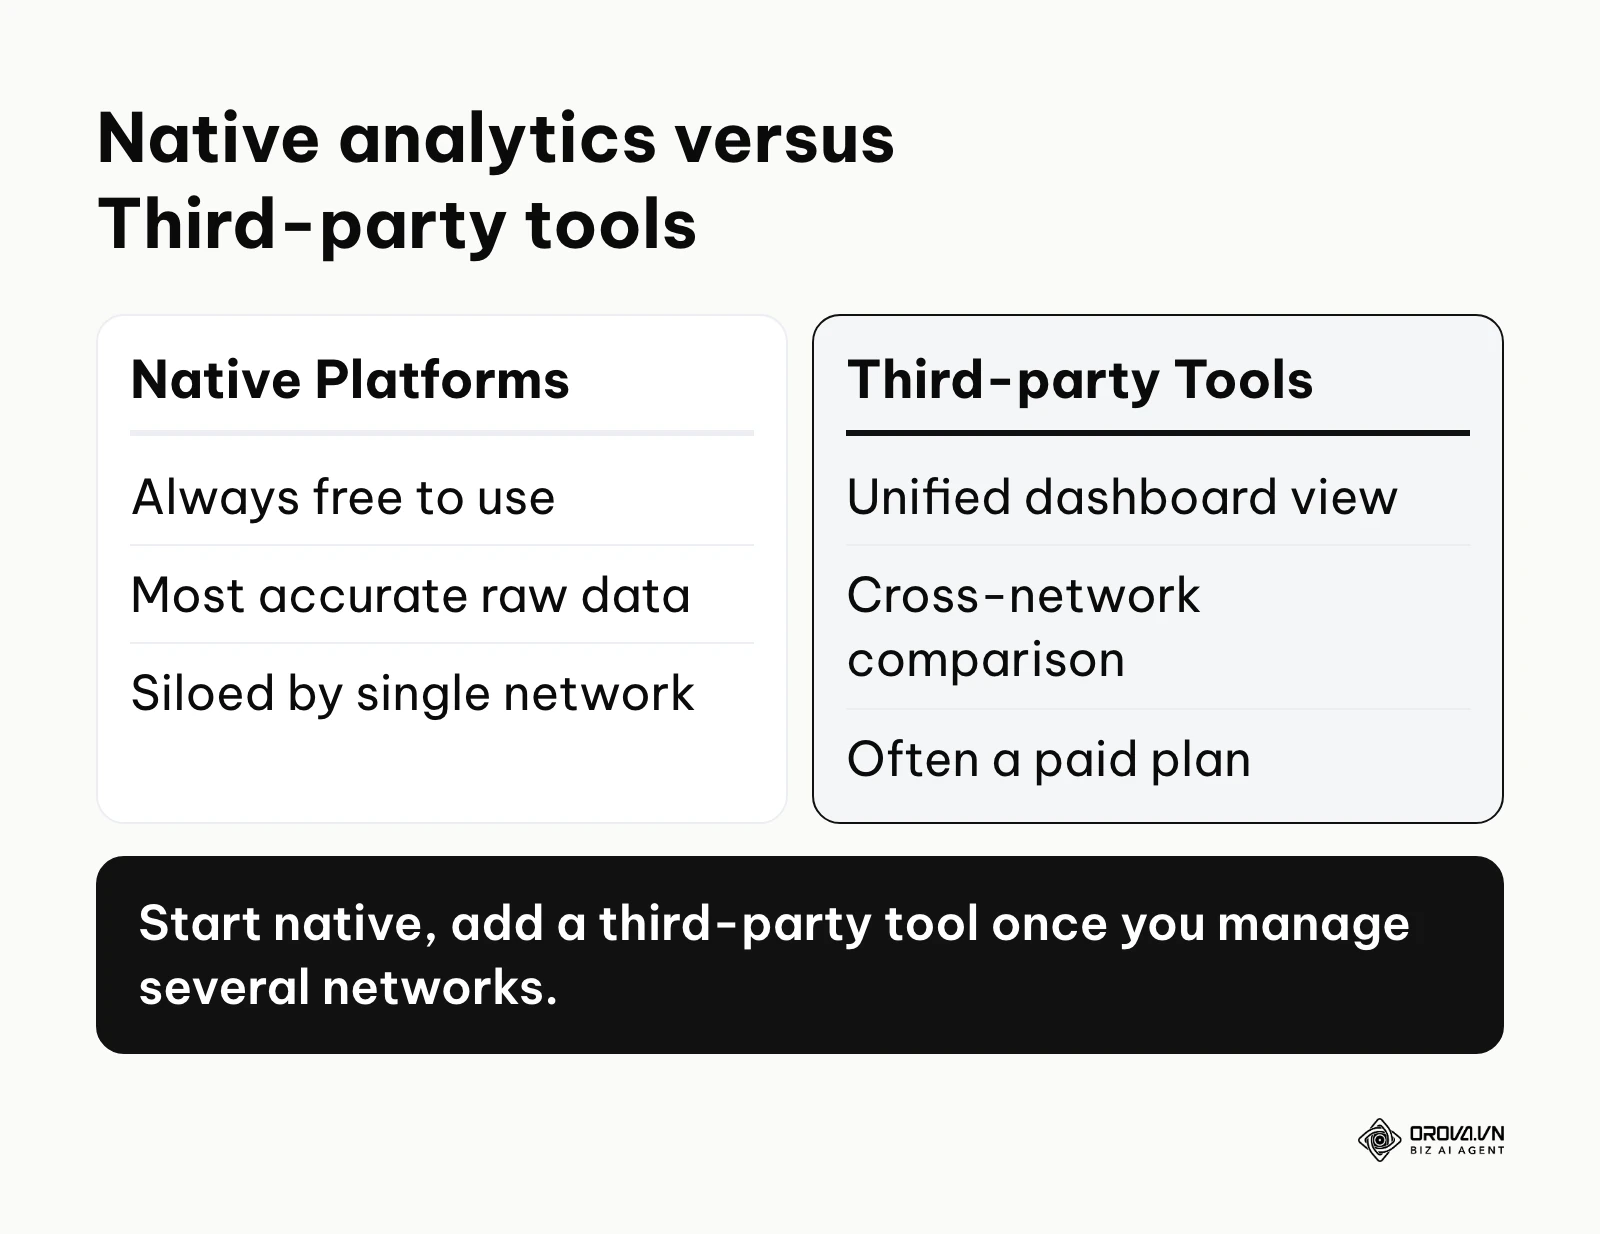
Native platforms are the built-in analytics dashboards provided directly by the social networks themselves. They are the most accurate source of truth because they own the data, but they severely lack cross-channel visibility.
Meta Business Suite Meta Business Suite operates as the central hub for managing presence across Facebook and Instagram. It aggregates basic performance metrics such as page reach, audience demographics, and ad spend return. Its built-in suggestions include recommended times to publish based on when your followers are online. The cost here is time rather than money: it only covers Meta's own apps, so comparing results with other networks means exporting data and combining it yourself. Expect some learning curve around business settings and page permissions. This tool is best for solopreneurs who rely heavily on the Meta ecosystem. To get started, you must first convert your Instagram account to a professional profile. Second, link that profile directly to your Facebook Business Page. Third, navigate to the Insights tab to generate your first 30-day performance summary.
YouTube Analytics YouTube Analytics remains the gold standard for long-form video measurement. It provides an incredibly deep dive into audience retention curves, traffic sources, and click-through rates (CTR) on video thumbnails. It also shows what your audience searches for and watches, which helps plan future content. While completely free, the real cost is the depth of the data; inexperienced users can easily misinterpret the relationship between CTR and average view duration. The learning curve is moderate. It is best for dedicated video creators and brand channels. To begin, upload your first video and give the data a day or two to populate. Next, click into the 'Advanced Mode' in the analytics dashboard to view the exact traffic sources. Finally, analyze the retention graph to identify which specific scene caused a drop in viewership.
TikTok Analytics TikTok Analytics focuses entirely on the velocity of short-form video consumption. It provides metrics on video views, profile visits, and precise audience activity hours. A unique strength is its ability to track the source of views, differentiating between the 'For You' page, personal profiles, and specific sound searches. The main limitation is the date range: the native dashboard focuses on recent activity, so many teams save their reports regularly to keep a longer record. The learning curve is relatively flat, designed for quick mobile consumption. It is best for consumer brands and agile marketing teams chasing viral trends. To start, switch your standard account to a Business Account via the mobile app settings. Then, access the analytics suite on a desktop browser for a wider view. Lastly, review your top-performing videos side by side to spot the common visual hooks.
Example illustration: Consider a small e-commerce business owner managing daily content across Meta Business Suite and TikTok Analytics. First, they linked their Instagram professional account to their Facebook page. Second, they navigated to the native insights tab to export the weekly post performance. Third, they attempted to align the engagement metrics across both platforms in a spreadsheet. The stumble happened when they realized each platform defined and counted video views differently, making a direct comparison misleading. To fix this, they standardized their internal reporting to focus strictly on link clicks and profile visits rather than arbitrary video views. The result was a simple, consistent weekly report that clearly displayed which platform drove actual store traffic, allowing them to allocate ad spend accurately.
All-in-One Management Platforms for Growing Teams
When an organization scales beyond a single person managing two networks, native platforms become a bottleneck. All-in-one platforms solve this by offering a unified dashboard for scheduling, community management, and cross-channel reporting.
Sprout Social Sprout Social is heavily favored for its polished interface and deep reporting capabilities. It aggregates messages from all networks into a single Smart Inbox, allowing teams to collaborate on customer service efficiently. Its analytics suite offers presentation-ready reports that require zero formatting. It also offers AI-assisted features such as sentiment analysis and reply suggestions; check which ones are included in the plan you are considering. Its plans are priced per user seat, so model the cost for your full team size before committing. The learning curve is gentle, thanks to intuitive navigation. It is best for mid-market teams and specialized social media agencies. To get started, connect your primary brand accounts during the initial setup wizard. Next, configure the Smart Inbox rules to automatically tag messages containing specific keywords. Finally, generate a cross-network competitor report to benchmark your current standing.
Hootsuite Hootsuite is one of the oldest players in the market, built around a stream-based dashboard that allows users to monitor multiple feeds simultaneously. It provides robust scheduling tools and a highly customizable analytics dashboard where users can drag and drop specific metric widgets. Its AI writing assistant drafts captions, and it recommends times to publish based on past engagement. Before buying, confirm how much historical data and which integrations are included in your plan. New users may need some time to get comfortable with the multi-stream layout. It is best for growing agencies that need to manage dozens of client accounts efficiently. To start, create a workspace and add your social profiles. Then, set up customized streams to monitor brand mentions and industry keywords side-by-side. Lastly, build a custom analytics report that highlights the specific KPIs your clients value most.
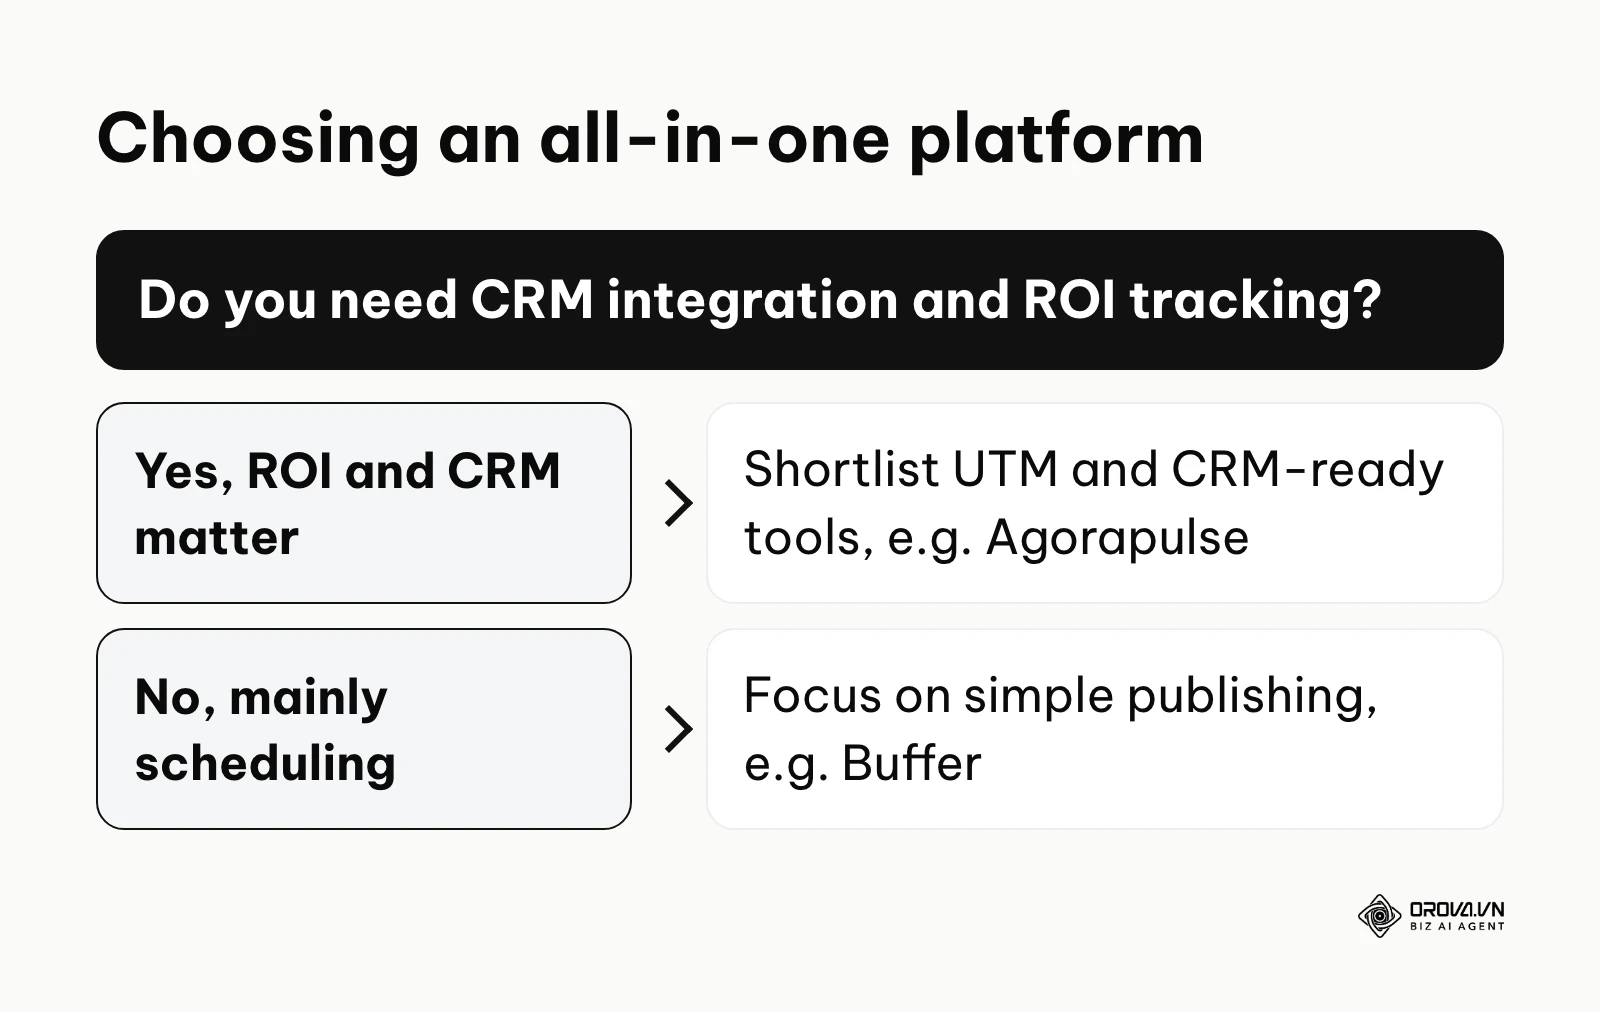
Buffer Buffer champions simplicity and affordability. It focuses intensely on a clean scheduling queue and a straightforward analytics tab that strips away overwhelming data points in favor of clear, actionable insights. The platform evaluates post performance versus overall account performance effortlessly. Its AI assistant helps brainstorm content ideas and repurpose top-performing posts for different networks. If you plan year-over-year analysis, check how much historical data your plan includes. The learning curve is minimal, making it one of the easiest tools for beginners to adopt. It is best for small businesses and lean teams who need essential functionality without enterprise bloat. To begin, connect your core profiles and set up a weekly posting schedule. Second, use the analytics tab to identify the top three posts of the month. Third, repurpose those posts and schedule them for a future date.
Orova Social Orova Social is a publishing tool rather than an analytics suite, so it belongs in your stack next to the native dashboards above. It lets you write a post once and publish it to 8 channels: Facebook, Instagram, TikTok, YouTube, Threads, LinkedIn, Zalo OA and Telegram. AI writes captions in your brand voice and in multiple languages, and draws images with your brand frame and identity already applied. It can also cut long videos into vertical 9:16 clips with subtitles and voiceover; note that Zalo and LinkedIn do not accept video. Scheduled posts that miss their slot are published as a catch-up, and you can view the content calendar by day, week or month. For reporting, you can export the posting calendar to Excel and add the results from each network's native analytics. It is best for teams whose bottleneck is producing and distributing content rather than measuring it. To get started, set up your brand profile. Next, upload a long video and let the AI cut vertical clips. Finally, schedule the posts across your channels and export the calendar to Excel for your weekly review.
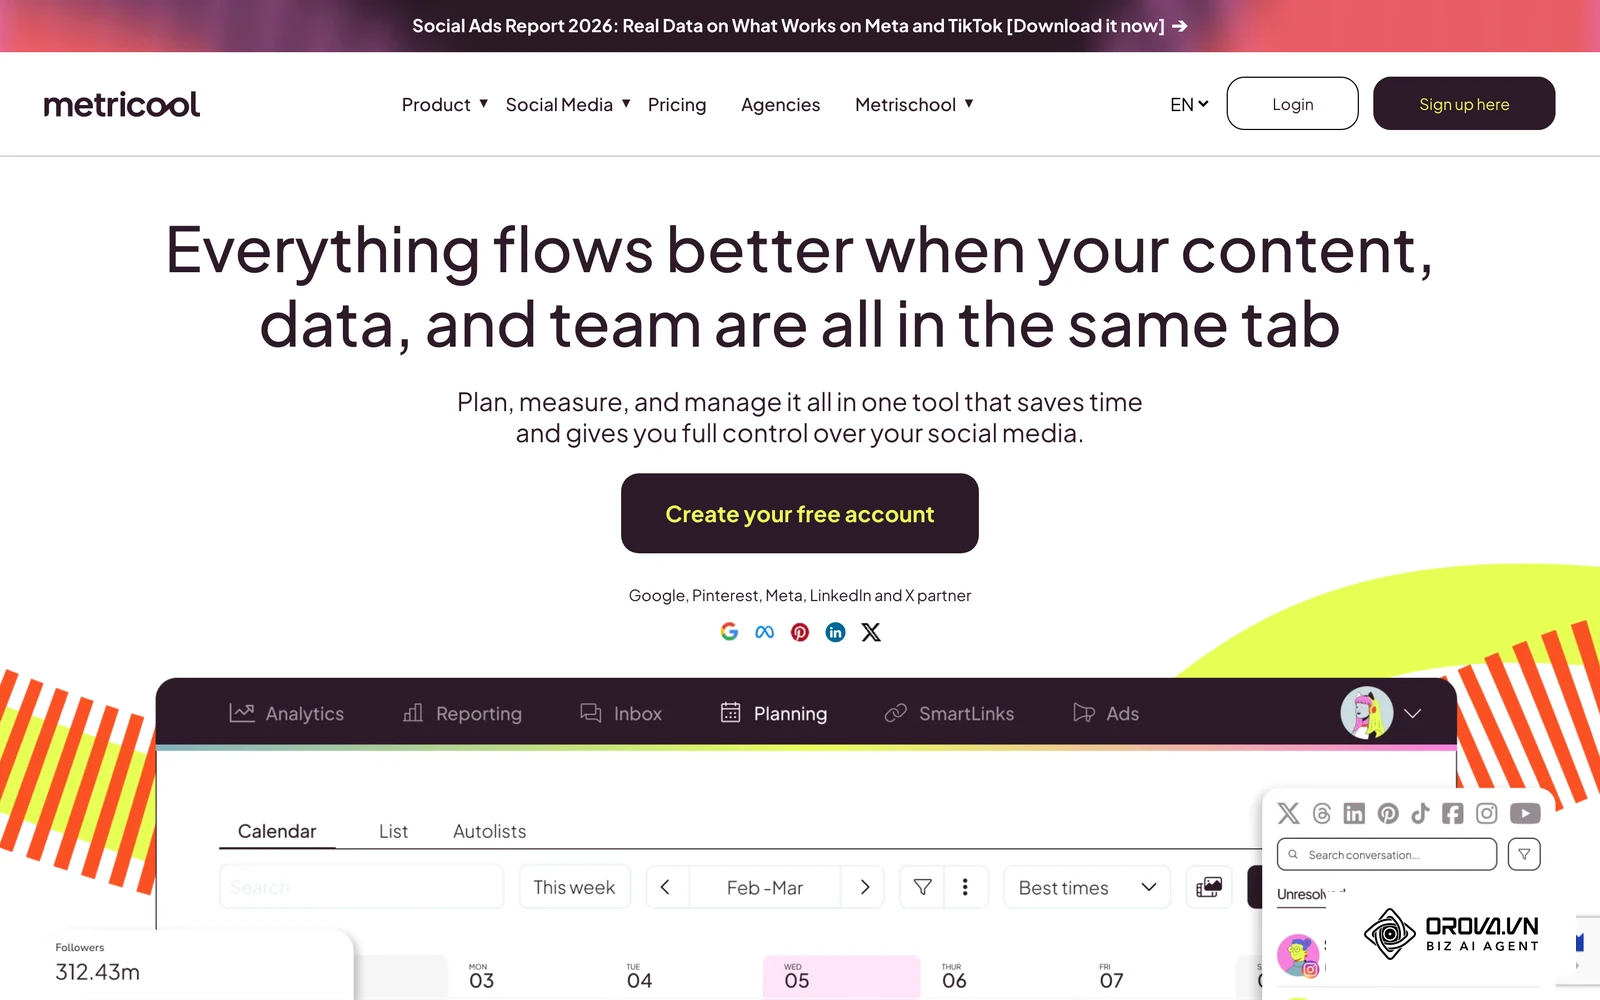
Metricool Metricool organizes its plans around the number of brands you manage, which suits independent contractors handling several clients. It offers comprehensive analytics, a unified inbox, and robust competitor tracking. A standout feature is its direct integration with Looker Studio, allowing advanced users to build highly customized data visualizations outside the platform. It also includes an AI assistant for drafting posts. Check which plan includes the Looker Studio connector and the amount of history you need. The learning curve is moderate, with a very data-heavy interface that appeals to analytical minds. It is best for freelancers and small agencies managing multiple distinct brands. To start, register a brand profile and connect all associated networks. Then, navigate to the competitor tab to input five rival accounts for benchmarking. Lastly, connect the platform to Looker Studio to create a dynamic dashboard for your clients.
Agorapulse Agorapulse is built to explicitly prove the financial return on investment of social media efforts. Its Social ROI reporting adds UTM parameters to links and connects with Google Analytics to trace conversions back to specific posts. The platform includes a unified inbox, intuitive scheduling, and a robust reporting application. Its inbox assistant rules can tag or assign incoming messages automatically. Check which plan includes the integrations you need, such as a connection to your CRM. The learning curve is manageable, supported by help resources and training materials. It is best for B2B agencies and teams focused strictly on lead generation and revenue tracking. To begin, connect your profiles and activate the UTM tracking feature. Second, link your Google Analytics account to the dashboard. Third, generate an ROI report at the end of the month to see exactly which social post drove the most website conversions.
Example illustration: Imagine a mid-sized digital agency where a social media manager handles multiple client accounts using an all-in-one platform. First, they connected ten distinct client profiles to a single workspace. Second, they set up automated weekly report generation for each client focusing on audience growth and engagement rates. Third, they applied a unified tagging system to categorize promotional versus educational posts. The stumble occurred when a client requested historical data from two years prior, which the platform's standard tier did not support, resulting in empty charts. To fix this, the manager manually exported the older data directly from the native platforms and merged it into a separate presentation slide. The result was a complete historical overview that maintained the client's trust and provided the necessary context for the upcoming campaign strategy.
Enterprise-Grade Listening & Predictive AI
When dealing with millions of brand mentions across global markets, standard counting metrics fail. Enterprise platforms utilize sophisticated social listening tool architecture to process massive volumes of unstructured conversational data, turning internet chatter into structured market research.
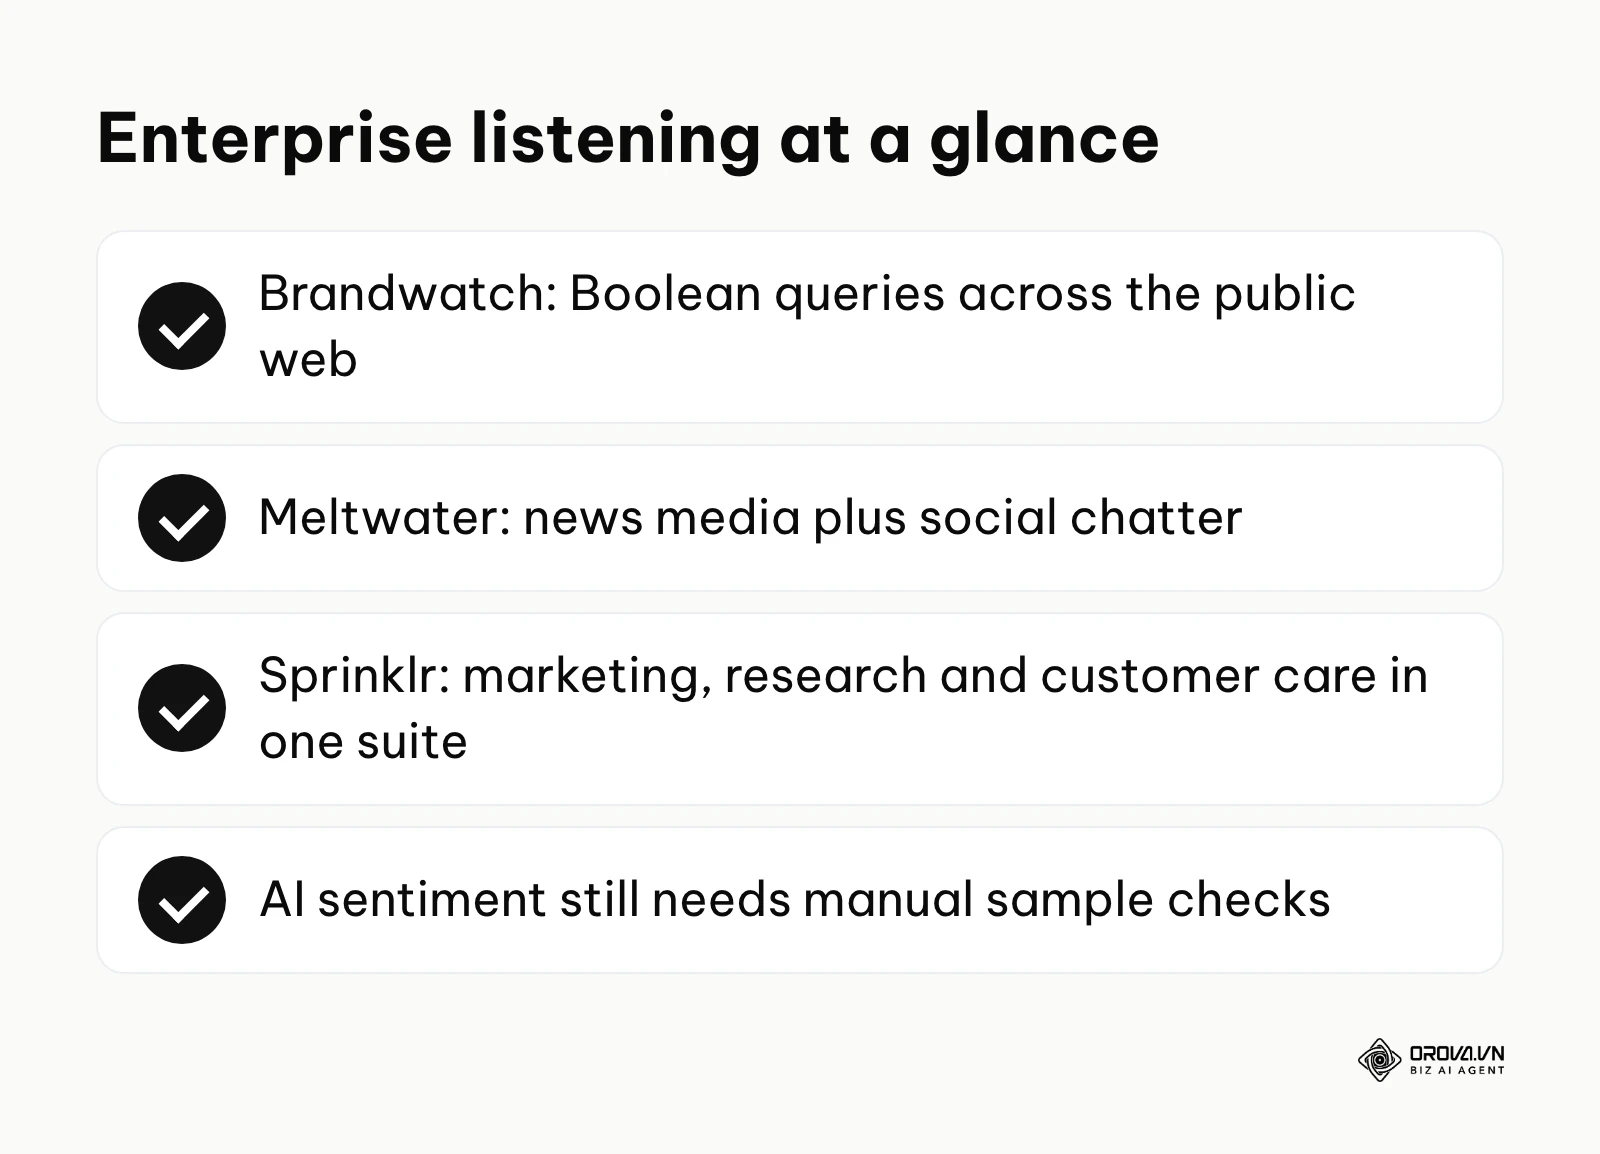
Brandwatch Brandwatch is a powerhouse for consumer intelligence. It does not merely track your owned profiles; it monitors the entire public internet. Users build complex Boolean search queries to track incredibly specific topics, competitor movements, and industry trends. Its AI features include image analysis that can spot a brand's logo in photos even when the brand is not named in the text, plus sentiment analysis across languages. Pricing is quoted on request, so ask what onboarding, data volume and training are included. The learning curve is steep, and teams usually assign dedicated analysts to it. It is best for global enterprises and large research firms. To start, work with an implementation specialist to define your core Boolean search strings. Next, configure Vizia, its display product, to show key dashboards on screens in your office. Finally, utilize the image recognition feature to discover uncredited user-generated content featuring your products.
Meltwater Meltwater bridges the gap between traditional public relations and modern social media monitoring. It provides a unified view of how a brand is perceived in mainstream news media alongside social chatter. The platform is excellent for discovering niche influencers and tracking the spread of PR campaigns. It can send alerts when conversation volume suddenly rises, which helps teams spot a potential issue early. Ask which sources, regions and how many saved searches are included in your package. The learning curve is moderate for PR professionals but can be complex for standard marketers. It is best for corporate communications teams and large PR agencies. To begin, set up a combined search tracking your brand name across both news sites and social platforms. Second, configure automated email alerts for any sudden negative sentiment spikes. Third, use the influencer discovery tool to find key voices driving the conversation in your specific industry.
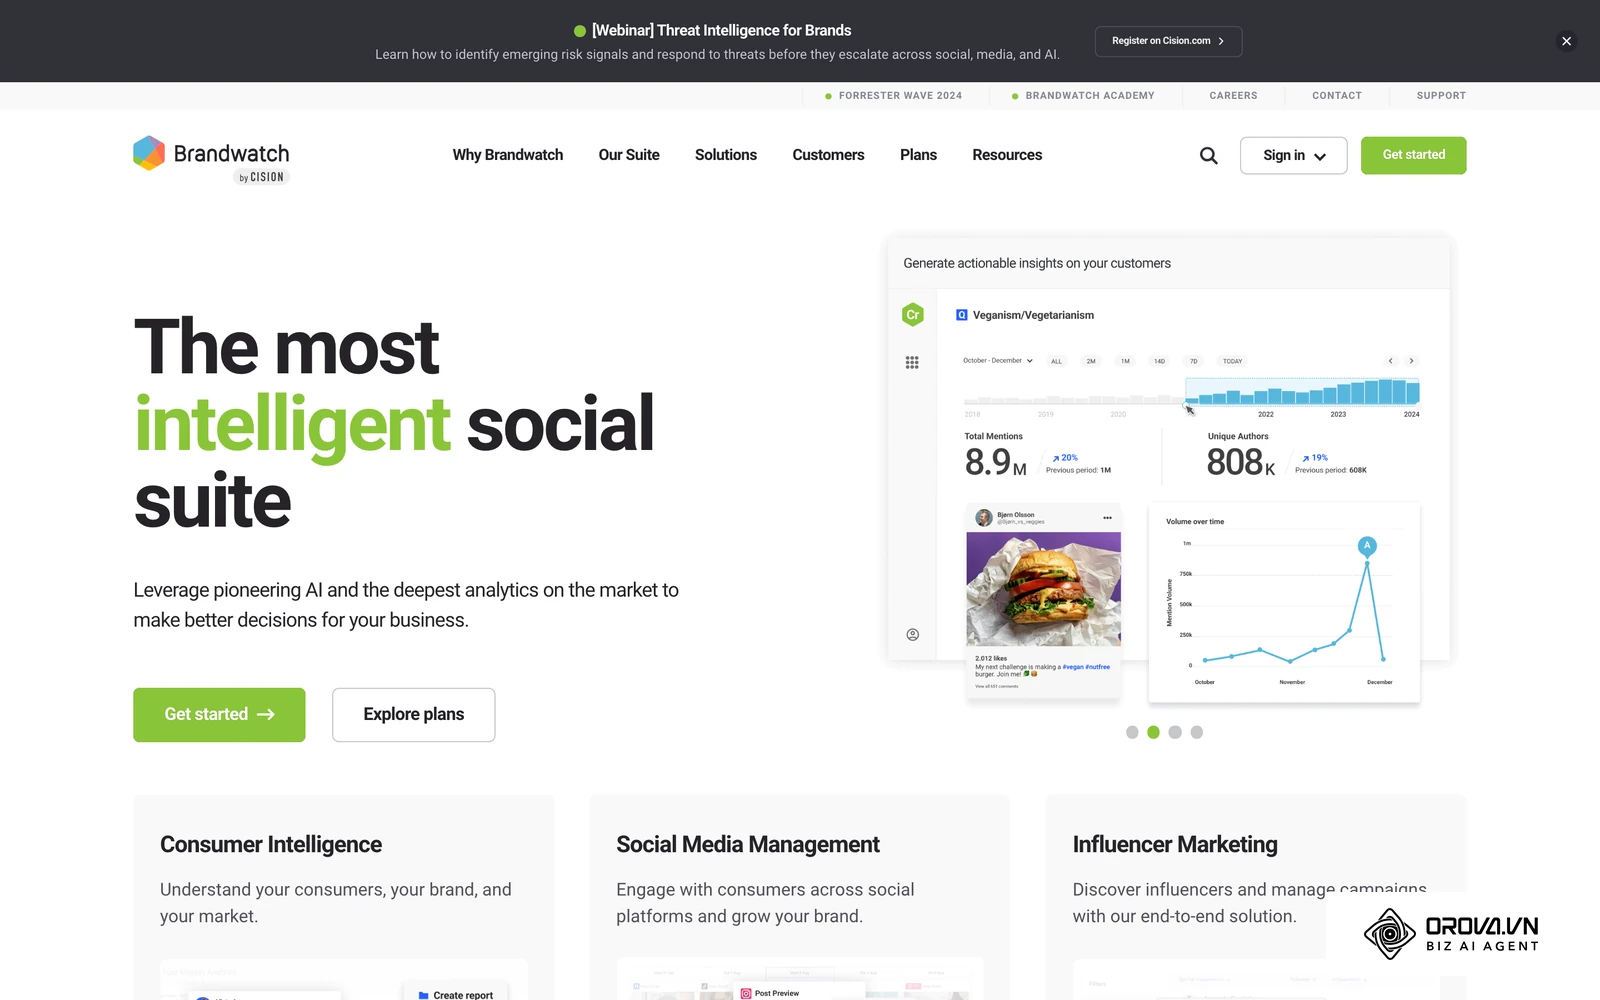
Sprinklr Sprinklr is less of a tool and more of an expansive operating system for enterprise customer experience. It features an incredibly complex module system covering marketing, advertising, research, and customer care. Its omnichannel routing ensures that a customer complaint on X is handled by the same support protocol as an email. It also offers AI features across these modules for large customer experience teams. Pricing is customized for each organization, so plan for a formal procurement process. The learning curve is significant, and large deployments usually have dedicated administrators. It is best for large enterprises that need extensive customization and security compliance. To start, an organization goes through a structured deployment phase mapping internal workflows to the software. Next, the teams must configure the AI routing rules for the global customer care team. Finally, leadership uses the executive dashboard to view global brand health metrics.
Example illustration: Think of a large corporate communications team using an enterprise-grade listening platform to monitor brand health. First, the data analyst configured complex Boolean search queries to track brand mentions across global news and social channels. Second, they activated the AI sentiment analysis feature to automatically flag negative discussions. Third, they built custom dashboards for the executive team to view daily health scores. The stumble happened when the AI began misclassifying sarcastic comments as positive sentiment, skewing the overall report. To fix this, the analyst manually reviewed a sample of the misclassified data and adjusted the machine learning model's exclusion keywords. The result was a highly accurate sentiment tracker that correctly identified emerging PR crises before they reached mainstream media outlets.
Specialized Visual & Short-Form Video Analytics
Certain platforms focus entirely on specific formats, recognizing that the metrics required to analyze a static image differ fundamentally from those needed for an engaging short video.
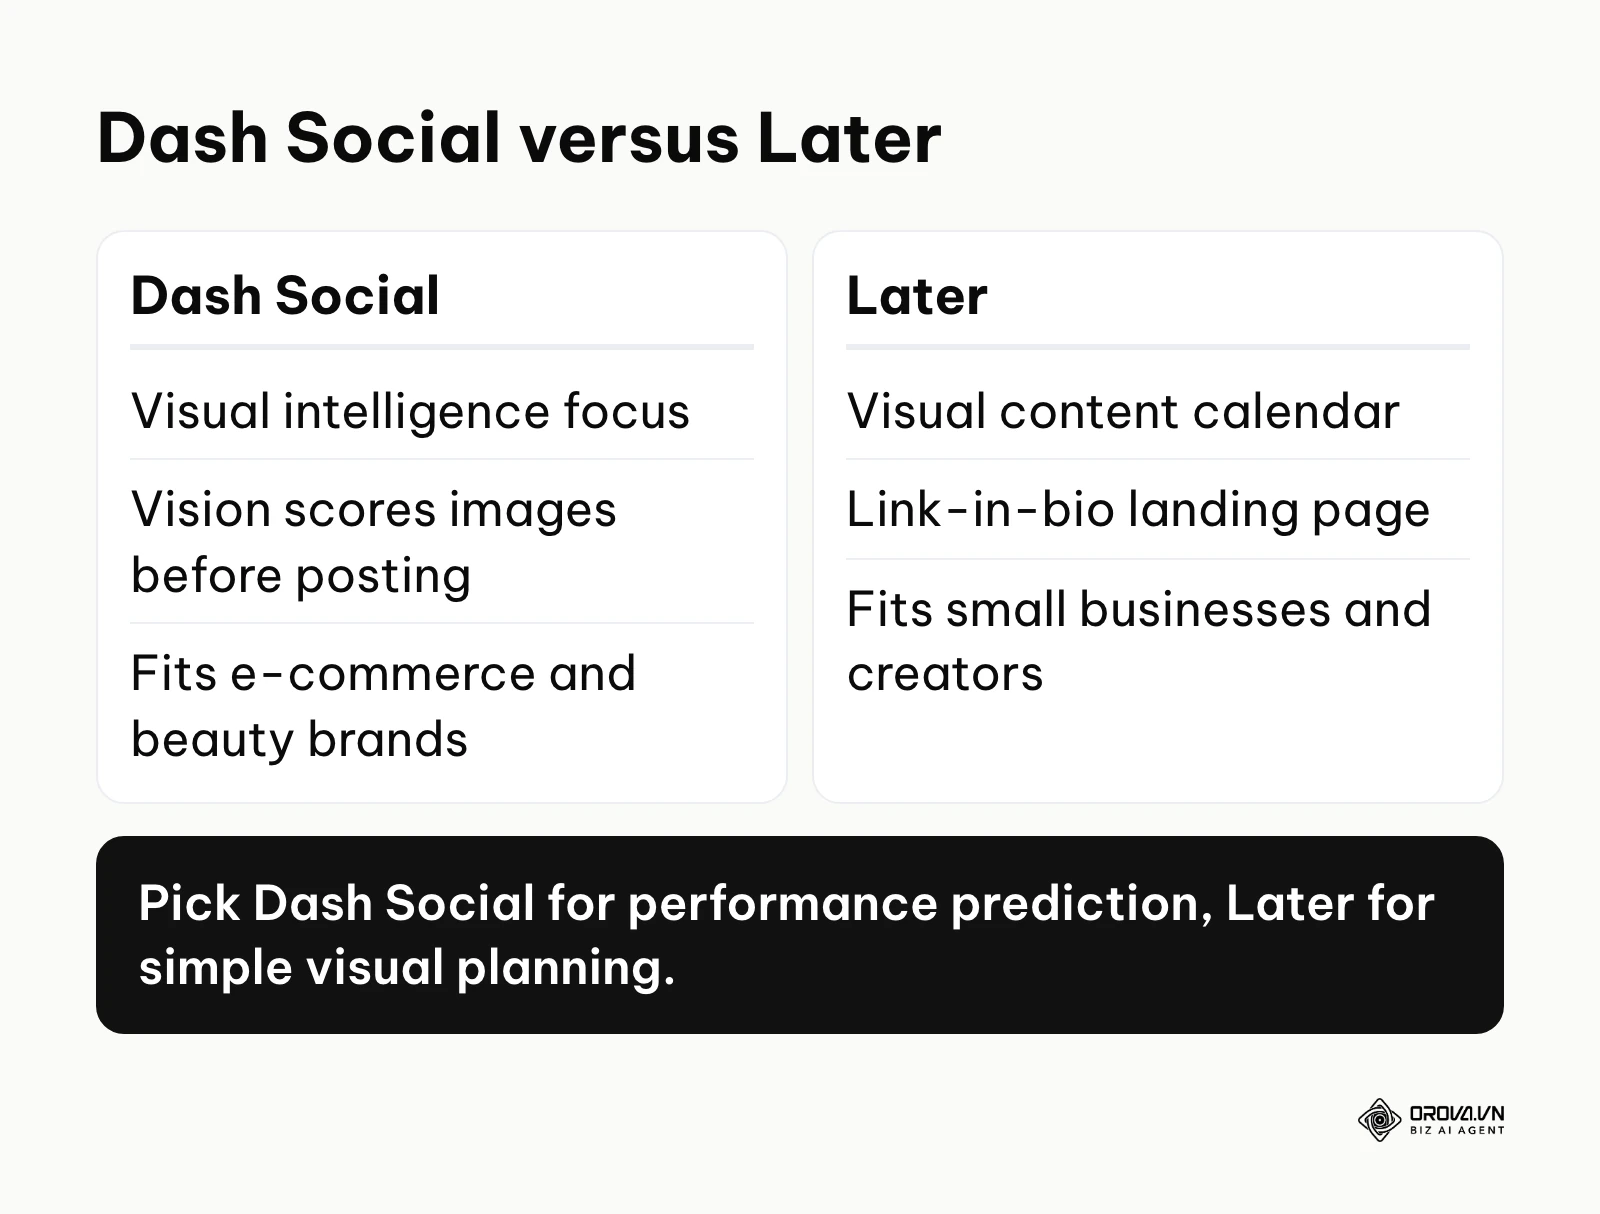
Dash Social (formerly Dash Hudson) Dash Social is engineered for visual intelligence. It is popular with brands that rely heavily on aesthetics, such as fashion and beauty companies. Its core strength lies in its AI feature, Vision, which predicts how well an image will perform on Instagram before it is even published. The platform also offers deep insights into e-commerce galleries and influencer return on investment. Its focus is visual content, so teams that rely heavily on text-first networks should check coverage for those channels. The learning curve is focused on understanding visual metrics and grid planning. It is best for e-commerce brands and visually driven organizations. To get started, connect your Instagram and TikTok accounts. Second, upload a batch of potential campaign images into the Vision AI tool to receive performance scores. Third, schedule the highest-scoring images into your visual grid planner to optimize your profile's aesthetic.
Later Later began as a dedicated instagram post scheduler and has evolved into a robust visual analytics platform deeply integrated with TikTok and Pinterest. It is known for its visual content calendar and link-in-bio feature, which turns an Instagram feed into a clickable, shoppable landing page. It suggests best times to post based on your audience's activity. As your team grows, check how additional users and analytics for other networks are handled in each plan. The learning curve is very gentle, relying heavily on drag-and-drop functionality. It is best for visually focused small businesses and independent creators. To begin, authenticate your visual profiles and set up your link-in-bio page. Next, drag your media assets into the visual planner to see how they look together. Finally, review the weekly analytics report to see exactly which post drove the most clicks to your website.
Want a lighter publishing workflow next to your native analytics? Orova Social lets you schedule posts, create on-brand images with AI and export your posting calendar to Excel for reports. It is free until July 7, 2027.
How to choose the right tech stack for your scale
Selecting a platform is an exercise in resource allocation. Purchasing an enterprise tool for a two-person team is a massive waste of capital, while relying on native platforms for a 50-person agency makes consistent reporting very hard. The tech stack you choose must align with your operational scale and primary content strategy.
| Scale | Recommended Stack | Reasoning |
|---|---|---|
| Solo / Freelancer | Native Analytics + Metricool | Maximizes budget, focuses on direct brand management without user seat fees. |
| Small Business | Buffer or Later | Low learning curve, highly visual, easy to read basic results without data overwhelm. |
| Team 3-5 / Growing | Sprout Social, or Orova Social for publishing plus native analytics | Needs shared reporting and steady content output across several channels. |
| Agency / B2B | Agorapulse | Needs ROI tracking, integrations, and client-ready reporting to justify retainers. |
| Enterprise | Brandwatch or Sprinklr | Needs deep listening, crisis management, unstructured data processing, and custom API setups. |
A common trap when building a tech stack is ignoring the implications of user seat pricing. Some platforms price per user seat, so the total can rise quickly as more teammates need access. Model the cost for your full team, not just one login. Another significant trap is data retention policies. If you are auditing a new marketing campaign, you often need to compare current performance against data from the previous year. Plans differ in how much historical data they keep, so a cheaper tier may not let you look back a full year. Always clarify the historical data access terms before committing. Finally, beware of feature bloat. Paying for a platform that includes advanced X (Twitter) listening capabilities is entirely useless if your audience exclusively consumes short-form video on TikTok and YouTube.
Social analytics tools trends in the next few years: author's perspective
Predictive AI will replace historical reporting
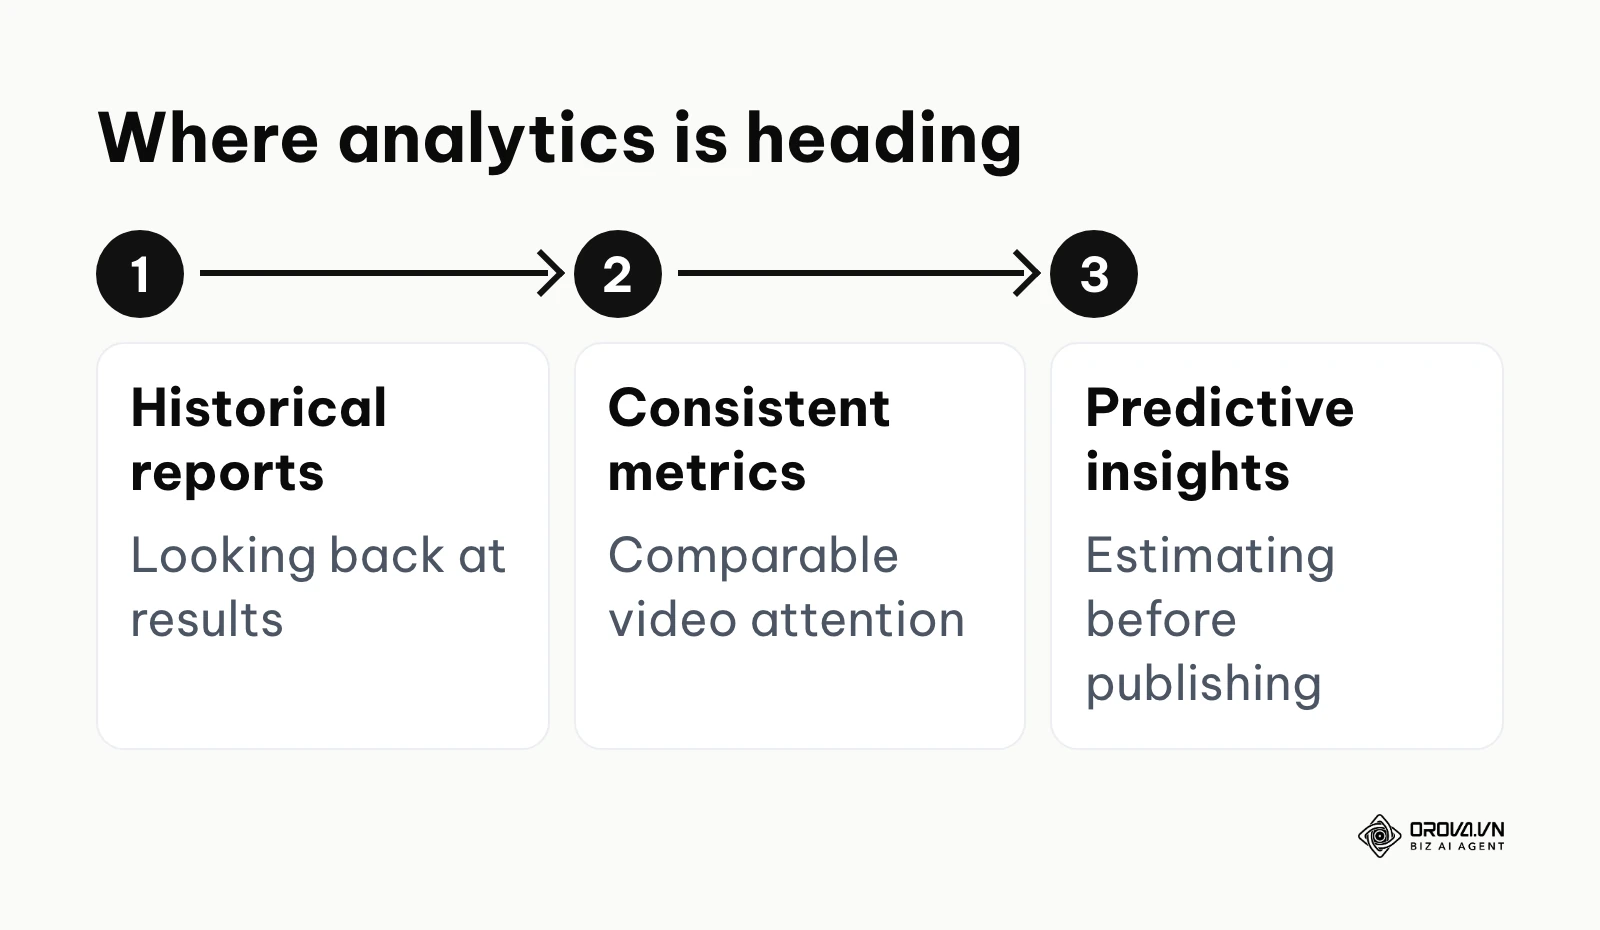
In my view, the future of social analytics tools lies in predictive intelligence rather than looking backward at what already happened. Some platforms already offer features that estimate how well a post will perform before you hit publish. I believe that over the next few years, historical dashboards will play a smaller role, and marketers may lean more on AI models that suggest a content mix for a given goal. You should start preparing for this by cleaning your current data architectures, as predictive models are only as good as the historical data they are trained on. However, this prediction could be wrong if data privacy regulations tighten further globally, cutting off the vast data streams these AI models need to function accurately.
Short-form video metrics will finally standardize
I expect pressure to grow for more consistent short-form video metrics. Currently, analyzing performance across YouTube Shorts, Instagram Reels, and TikTok requires a complex spreadsheet because each platform measures a "view" differently. I think third-party analytics tools may push toward a common measure of real attention rather than fleeting impressions. You should prepare by focusing your current reporting strictly on deep engagement metrics like completion rate rather than raw view counts. This trajectory might fail if native platforms actively block third-party API access to maintain their walled gardens and force marketers to use their native dashboards exclusively.
Complete consolidation of publishing and listening
I think standalone listening tools and publishing platforms will keep moving closer together. Several suites already bundle listening with a social media scheduler to offer a complete package. Over the next few years, I believe more entry-level tools will add basic sentiment analysis and listening as standard features, blurring the lines between categories. You should audit your current tech stack and look for places where tools overlap. This outlook could be incorrect if the computing costs associated with AI listening become too expensive, forcing vendors to keep these features separated in premium add-on modules.
Frequently asked questions about social analytics tools
What is the difference between account-level and post-level metrics?
Account-level metrics track the overall health of your profile over time, such as total follower growth, total profile visits, and aggregate reach across all content within a month. Post-level metrics evaluate the performance of a single piece of content, looking strictly at the likes, shares, comments, and specific click-through rates generated by that exact post. Both are necessary; account metrics show long-term brand health, while post metrics dictate immediate tactical adjustments.
How does AI actually improve social analytics tools?
As of 2026, AI improves tools primarily by processing unstructured data that humans cannot scale. Instead of just counting likes, AI reads thousands of comments to determine positive or negative sentiment. It also powers predictive analytics, analyzing your past visual assets to score how likely a new image is to generate engagement before you publish it. Furthermore, AI automates the generation of insights, writing a plain-text summary of your monthly performance rather than just handing you a raw chart.
Why do third-party tools sometimes show different numbers than native platforms?
This discrepancy comes from sync timing and metric definitions. Native platforms show their own data directly, while third-party tools pull it through an API on a schedule, so there can be a delay. Metric definitions can also differ, for example how a video view or reach is counted, which leads to conflicting reports. Always defer to the native platform for the most accurate raw count.
Are free social analytics tools safe for business use?
Free tools provided directly by the networks (like YouTube Analytics) are completely safe and essential. For any third-party tool, free or paid, read the privacy policy and check which account permissions it requests. Prefer platforms that clearly document their data privacy compliance (such as GDPR or CCPA) to protect your proprietary business intelligence.
Where to start?
If you are currently relying entirely on native apps and feeling overwhelmed by the manual data entry, your first step should be to audit your actual needs. Spend one afternoon documenting exactly which three metrics your leadership team actually cares about (e.g., website clicks, lead form fills, video completion rate) and ignore the rest.
If you are already using a basic scheduler but your team has grown, your first step is to initiate a trial with a mid-market all-in-one platform. Spend a few hours connecting your profiles and generating a single cross-channel report to present at your next team meeting, demonstrating the immediate time savings of a unified dashboard.
If you are an enterprise team struggling with data silos and delayed reporting, your first step is to mandate an internal data governance review. Before purchasing any complex software, you must ensure that all global teams are using the same naming conventions, UTM tracking parameters, and campaign tags. Without this structural foundation, even the most expensive AI listening tool will only generate expensive noise.
About the author

Builder of Orova
Nguyễn Đỗ Trọng Ân has 8 years of experience in marketing, including 6 years managing market development across Asia. He builds Orova, a Biz AI Agent that never sleeps: it plans, runs and optimizes work for businesses.
Run your business with AI Agents
Orova is the always-on Biz AI Agent — it plans, runs, and optimizes the work for you.
Save time, unlock productivity.