
Marketing analytics tools: A complete 2026 framework for data stacks

Many digital professionals feel overwhelmed by the sheer volume of data available today. You might have ten different browser tabs open trying to figure out which specific campaign actually drove the most valuable leads for your business. Relying on isolated, fragmented metrics often leads to misinterpretation and wasted advertising budget. To solve this problem, implementing the right marketing analytics tools is essential. In practice, the toolkit has four groups: web and product analytics, SEO analytics, social and paid ads analytics, and a business intelligence layer that pulls them into one report. A proper tracking setup across these groups helps you see the entire customer journey clearly, allowing you to transition from reactive guessing to proactive, revenue-driven optimization.
What are marketing analytics tools?
Marketing analytics tools are specialized software applications designed to collect, process, and interpret performance data across multiple advertising and communication channels. They help teams measure user behavior, attribute revenue to specific campaigns, and uncover actionable insights. You should implement these platforms when you need to justify your marketing spend, but avoid over-complicating your setup if you only run basic, single-channel promotions.
This guide covers the multi-channel toolkit: how web, search, social, ads and CRM data fit together into one stack. If you only need to measure social media channels, our guide to social analytics tools covers that narrower set. If you need to turn the numbers into a monthly write-up for stakeholders, see our marketing report guide.
The marketing data stack: beyond single marketing analytics tools
A common misconception among beginners is that a single software application can magically solve every data problem. In reality, modern organizations build a marketing data stack. This stack is a structured ecosystem of different specialized technologies working together to handle information efficiently. By treating your setup as an architecture rather than a simple software purchase, you avoid data silos and ensure accuracy.
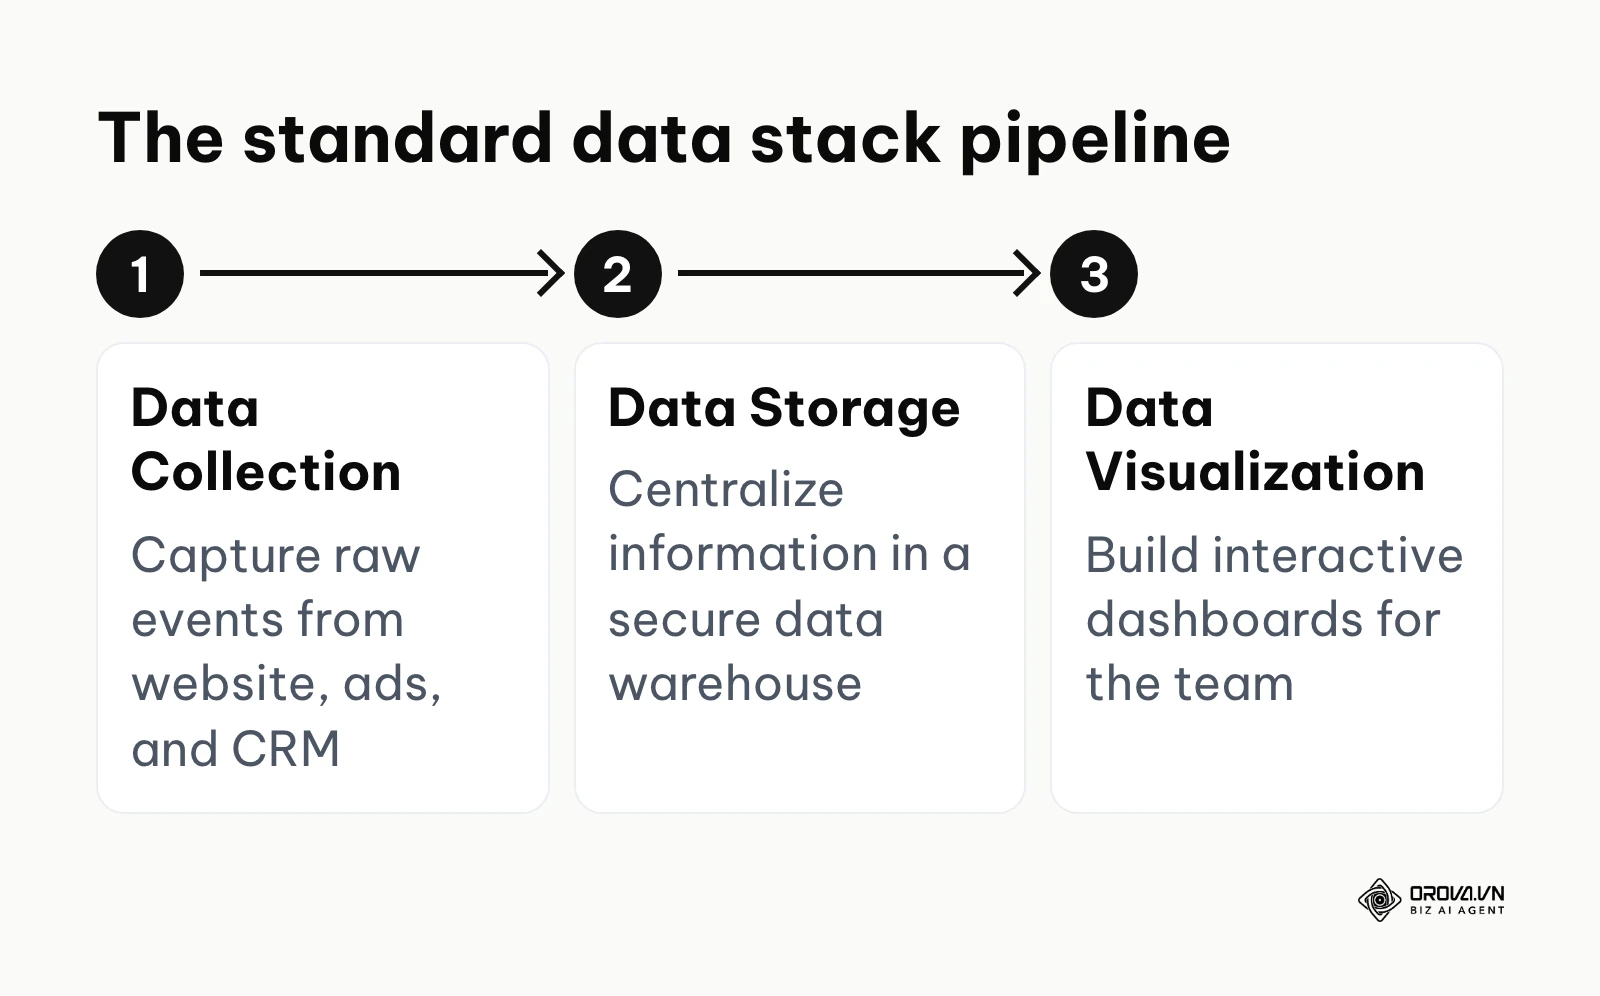
The architecture typically consists of three distinct layers. First, you have the data sources. These are the origin points where user interactions occur, such as your website tracker, your social media platforms, or your email marketing software. Second, you have the storage layer. Instead of keeping data isolated inside each source platform, advanced teams extract this information and load it into a central data warehouse. Finally, you have the visualization layer. This is where business intelligence tools query the warehouse to build accessible dashboards for stakeholders.
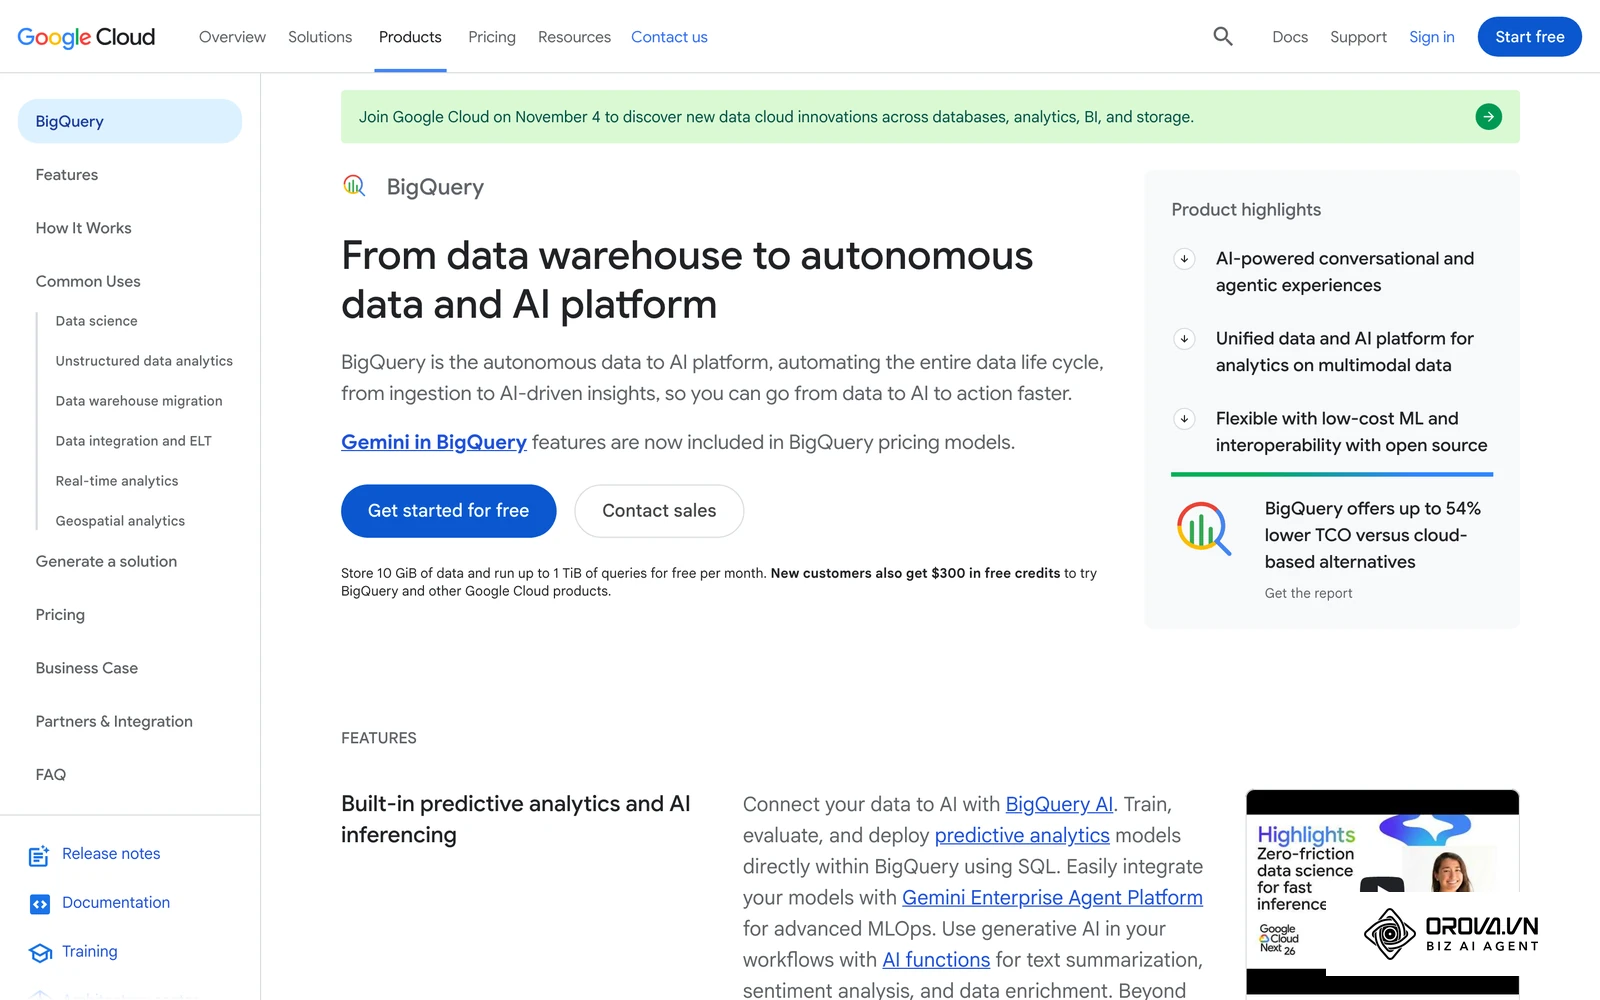
Separating these functions provides massive flexibility. If you decide to change your email provider, you only swap out one source connection without destroying your entire historical reporting dashboard. Privacy rules and platform retention settings also limit how long user-level data stays available inside each source tool, which makes a centralized, self-owned copy of your data valuable for long-term planning. Integrating your stack with a solid data driven marketing strategy ensures that every piece of software contributes directly to your overarching business goals.
Data preparation checklist: fixing the garbage-in problem
Purchasing expensive software will not fix broken internal processes. If you feed messy, inconsistent inputs into the best platforms in the world, you will generate inaccurate reports. Before you connect any new tracking software, you must clean your foundation.
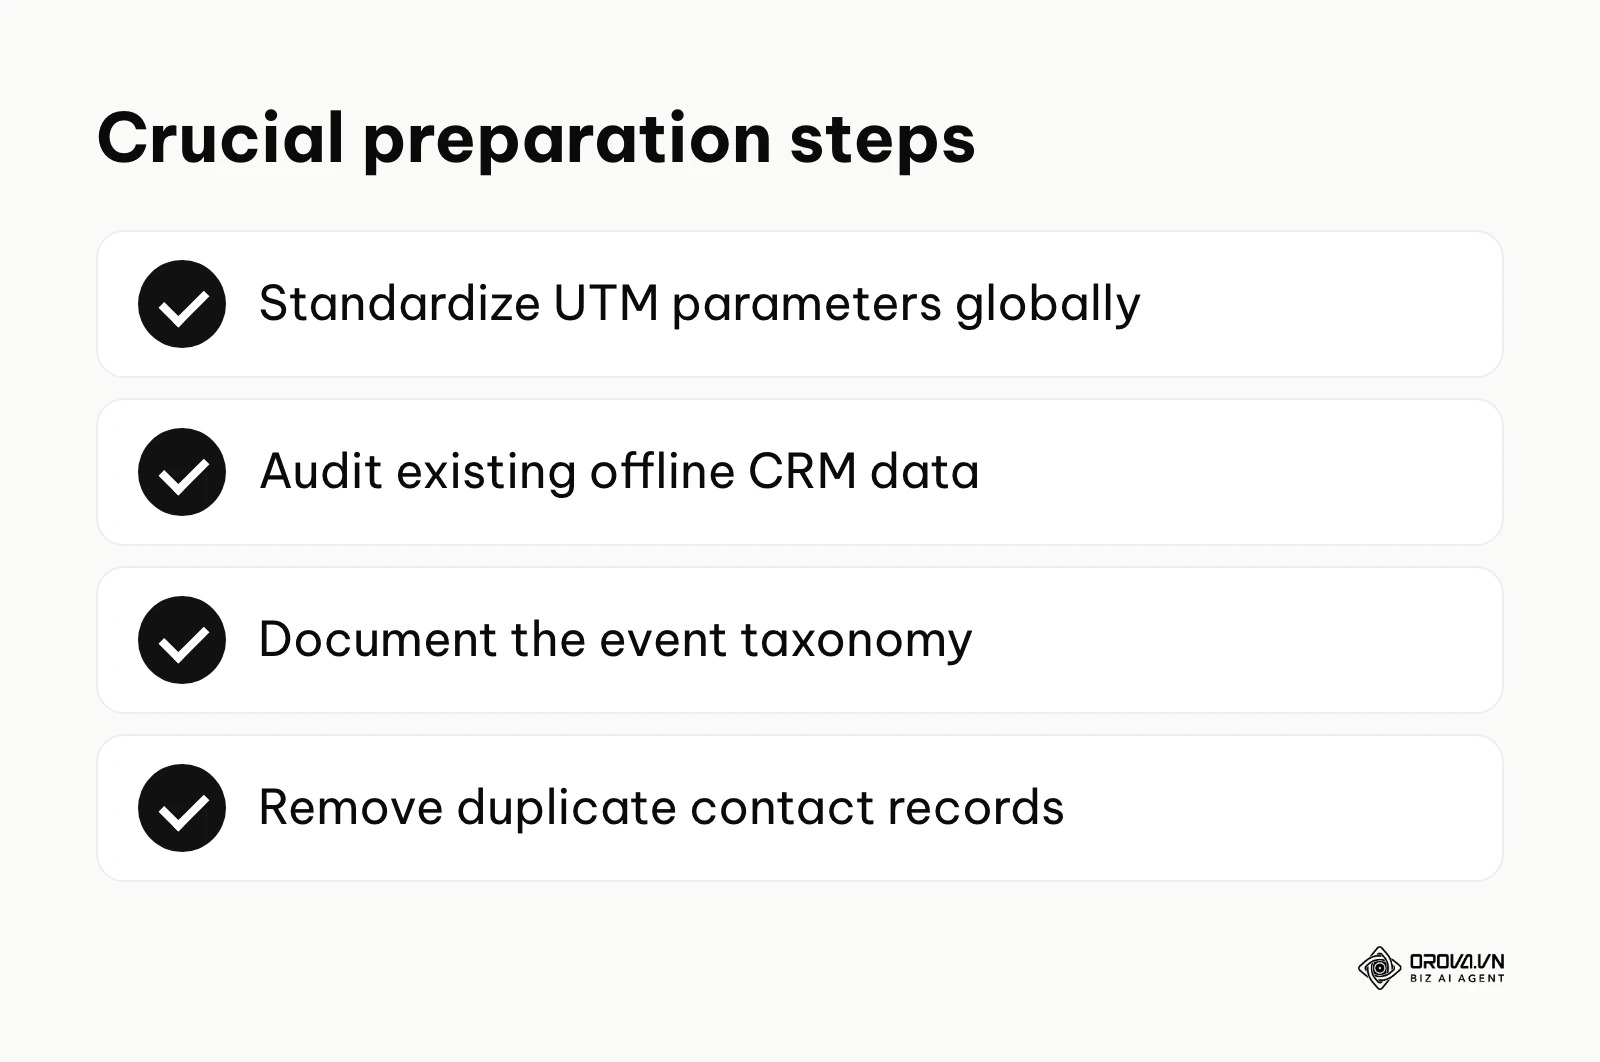
Teams that enforce strict naming rules spend far less time reconciling mismatched reports. To achieve this, you need a rigorous preparation phase. The following checklist outlines the essential steps required to prepare your organization for advanced tracking.
- Standardize UTM source parameters globally. Decide exactly how to write your traffic sources. For example, choose whether you will use "facebook", "Facebook", or "fb". If different team members use different variations, your traffic will split into multiple fragmented rows, ruining your analysis.
- Standardize UTM medium parameters. Establish strict definitions for the medium parameter. Use "cpc" strictly for paid search, and "paid_social" for sponsored social posts. Consistency here is non-negotiable.
- Establish a case-sensitivity rule. Analytics platforms treat capital and lowercase letters as entirely different entities. Enforce a strict lowercase-only policy for all tracking links to prevent accidental duplication.
- Create a central URL builder tool. Do not allow team members to type tracking parameters manually from memory. Build a shared spreadsheet with dropdown menus that automatically generates the final tracking URLs.
- Define a global naming convention for campaigns. Your campaign names should contain the date, the region, and the objective. A name like "2026_US_Retargeting" provides instant context, whereas "Campaign_Final_2" is useless in a dashboard.
- Audit existing offline CRM data fields. Review your customer relationship management software. Ensure that fields like phone numbers and email addresses are formatted uniformly, as this consistency is required for accurate audience matching.
- Remove duplicate contact records. Merge duplicate profiles in your CRM. If a single user exists three times in your database, your conversion rates and customer acquisition costs will be heavily skewed.
- Document the event taxonomy. Create a master document listing every button click, form submission, and page view you intend to track. Define exactly what triggers each event so developers understand the requirements.
- Validate tracking pixel firing. Use browser extensions to simulate user journeys on your website. Confirm that tags fire only once per action, preventing double-counting of conversions.
- Train the team on data entry hygiene. Hold a mandatory workshop. Explain that failing to log a lead source correctly breaks the entire reporting chain downstream, affecting budget allocation and team bonuses.
Offline to online data matching
One of the most complex challenges in reporting is connecting physical, real-world events to digital touchpoints. When a user clicks an advertisement, calls your sales team, and signs a contract offline two weeks later, standard web trackers lose visibility. Bridging this gap requires specific architectural decisions.
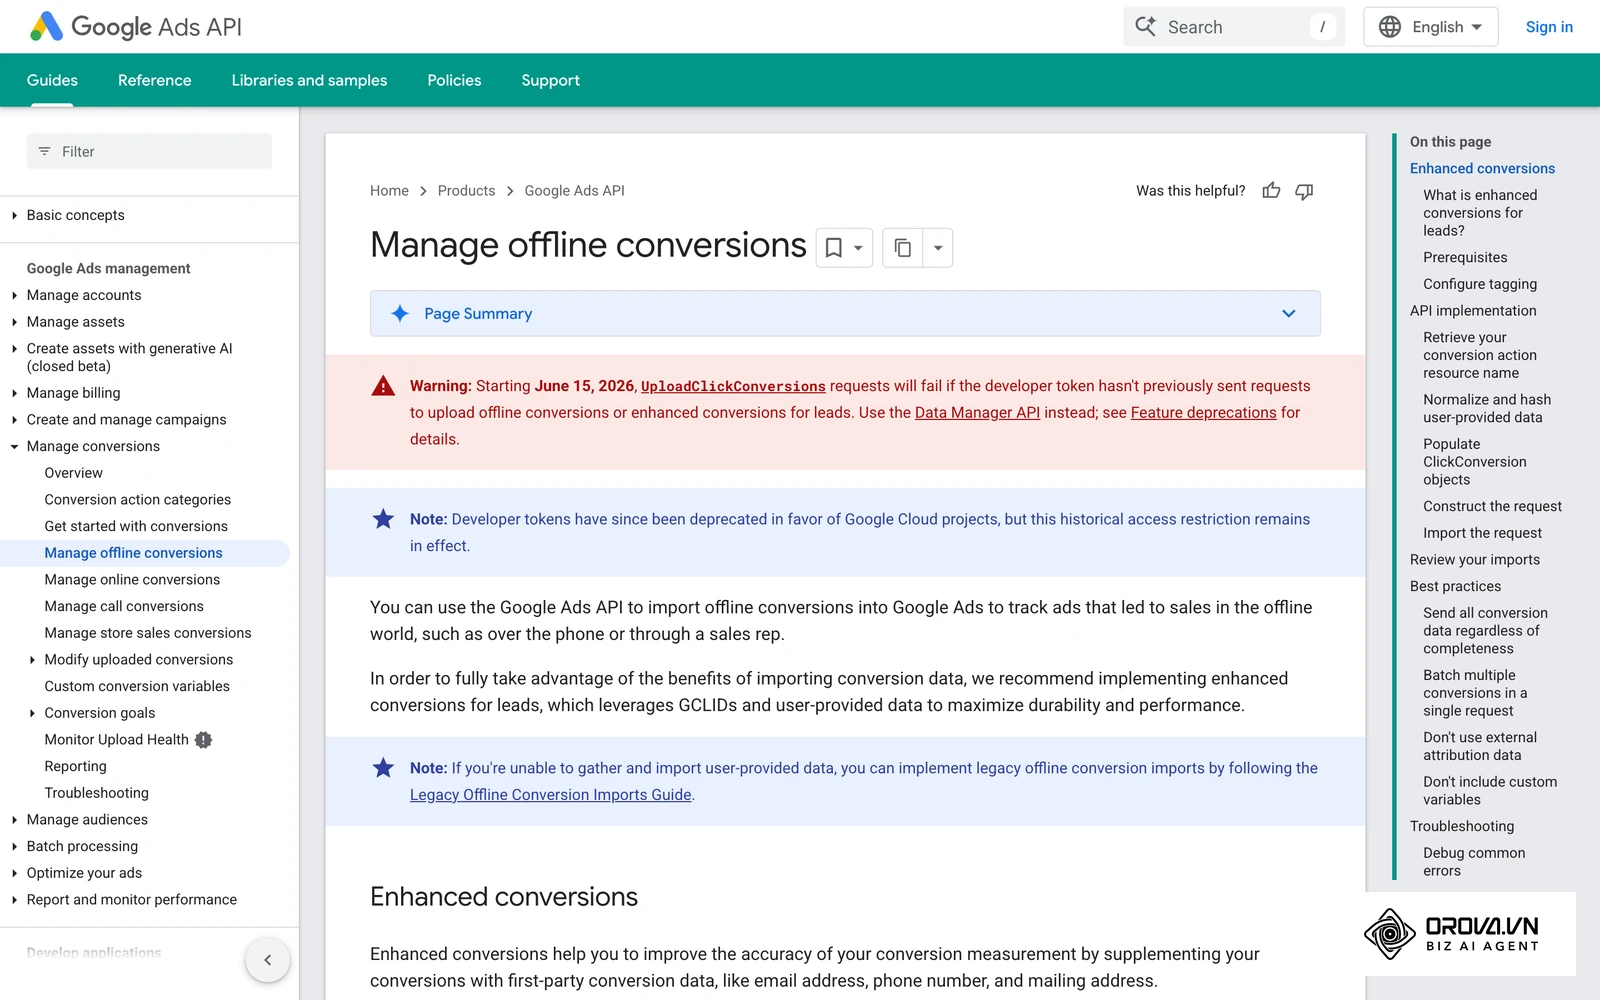
Integrating offline CRM records with advertising platforms is a common sticking point for marketing teams. To solve this, businesses must implement systems that pass unique identifiers back and forth between the digital space and the physical sales floor. This usually involves capturing click IDs during the initial interaction and storing them securely until the final transaction occurs. Once offline deals flow back into your reports, you can also decide how to share credit across touchpoints, which our guide to multi-touch attribution explains.
Illustrative example: Context: A mid-sized B2B manufacturing company with a 10-person sales team struggled to attribute offline closed deals to initial digital ad clicks. Steps taken: First, they configured their lead forms to capture the unique click identifier in a hidden field. Next, they passed this tracking ID into their CRM alongside the customer contact record. Finally, they scheduled an automated weekly file upload back into the advertising platform whenever a deal was marked as won. Stumbling block and fix: Initially, the upload process failed repeatedly because the CRM formatted date timestamps differently than the ad platform required; they resolved this by standardizing the date structure using a spreadsheet formula before exporting. Result: The marketing team could directly view which specific search terms generated physical contracts on their dashboard, rather than just optimizing for cheap form submission volumes.
All-in-one vs best-of-breed marketing analytics software
When structuring your technology, you face a fundamental choice between purchasing a unified all-in-one suite or assembling a customized best-of-breed stack. Each approach carries distinct operational trade-offs that affect your team's agility and your financial overhead.
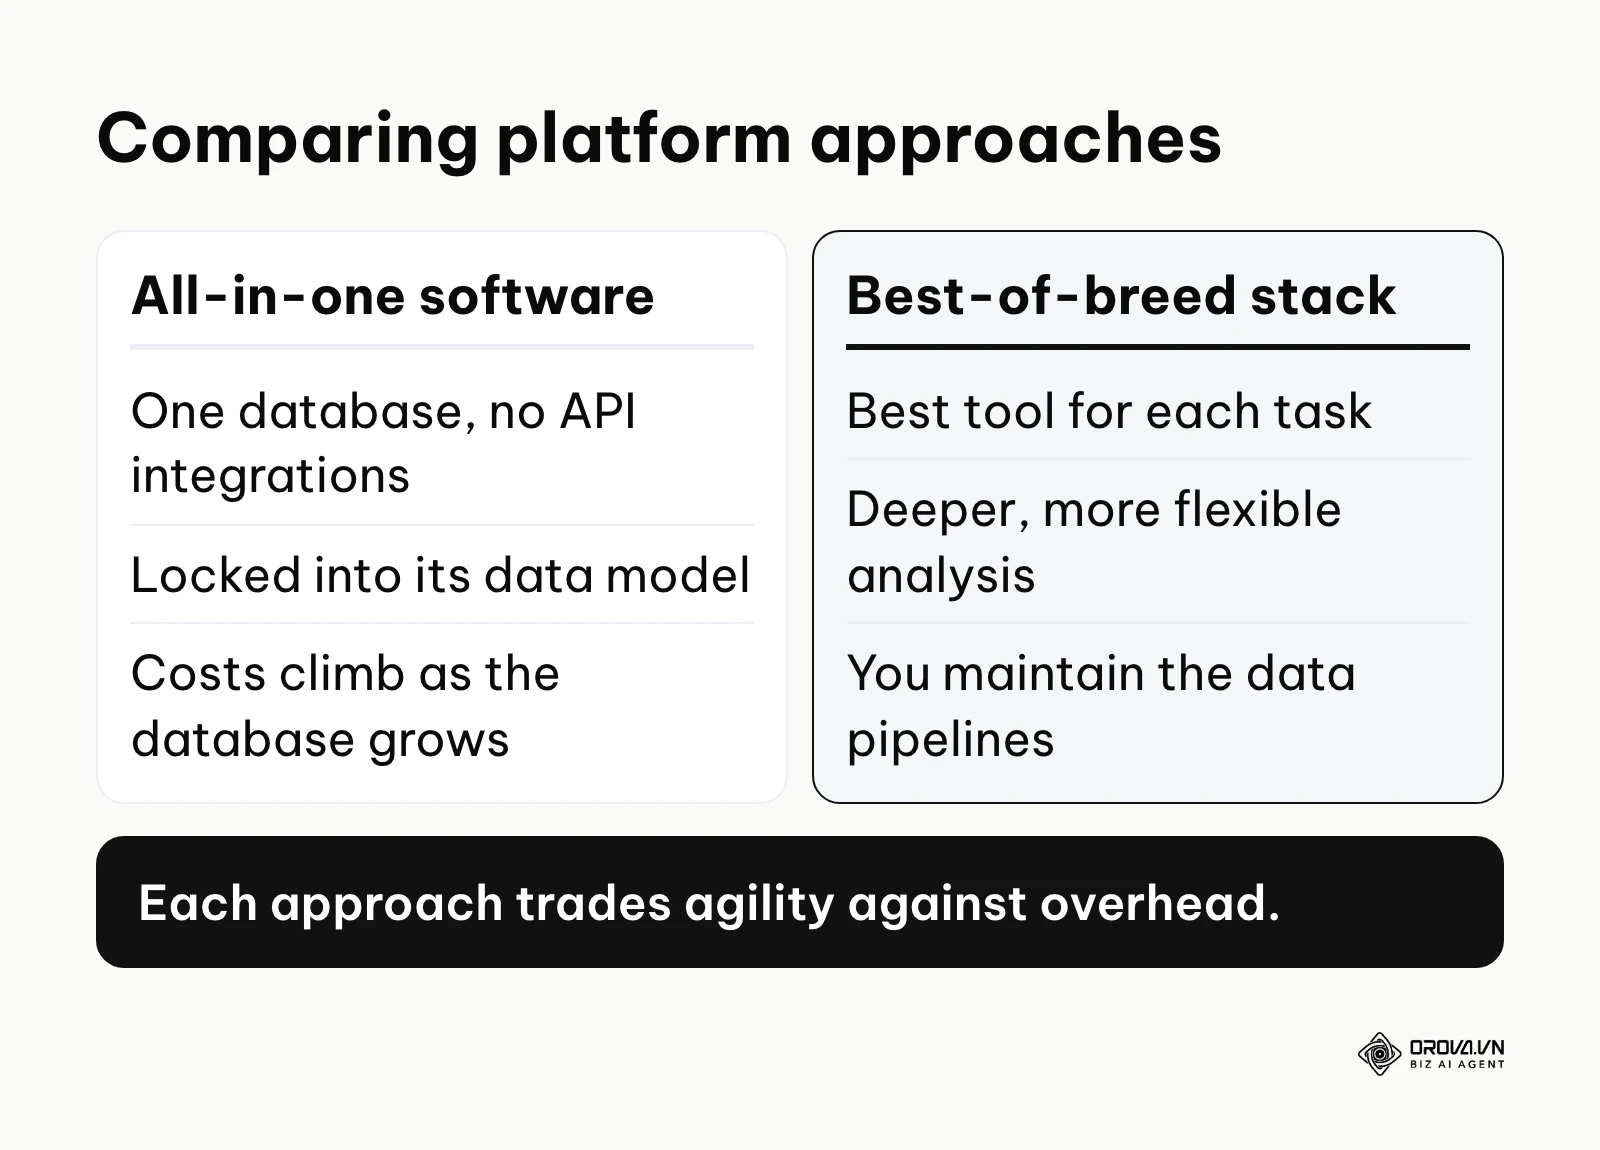
All-in-one platforms promise a seamless experience where email, website tracking, and customer records exist in a single database. This eliminates the need for complex API integrations. However, they often lock you into their specific way of modeling data. If their built-in reporting lacks a specific chart type you need, you are largely out of luck. Furthermore, as your database grows, the monthly subscription costs for enterprise all-in-one suites can become prohibitively expensive.
Conversely, a best-of-breed approach involves selecting the absolute best software for each specific task. You might use one dedicated tool for product analytics, another for search optimization, and a third for email. This grants unparalleled depth and flexibility, but it places the burden of integration squarely on your shoulders. You must maintain the data pipelines connecting these systems to ensure they share user identifiers correctly.
Illustrative example: Context: A small SaaS startup with a two-person marketing department needed to track website visitors and in-app user behavior simultaneously. Steps taken: Initially, they purchased a massive enterprise all-in-one platform hoping it would automatically cover every metric. Second, they spent three weeks trying to force the system to track custom button clicks inside their software application, a task it was not designed for. Finally, they cancelled the contract and implemented a specialized web tracker alongside a dedicated product analytics tool. Stumbling block and fix: They experienced isolated data silos because the two new systems did not communicate; they fixed this by passing a persistent user ID string between the public website and the logged-in application environment. Result: They successfully visualized the complete user journey from reading a blog article to actively using the software interface without paying for unnecessary enterprise features.
Summary of the top marketing analytics tools
Before diving into the detailed technical specifications of each platform, it is helpful to view the landscape broadly. The table below categorizes the most prominent tools available today, outlining their primary functions and the types of organizations they serve best. This serves as a quick reference for any marketing analytics tools comparison.
| Tool Name | Category | Main Job | Core Value for User | Suitable Size |
|---|---|---|---|---|
| Google Analytics 4 | Web Analytics | Website traffic tracking | Robust baseline metric collection | All sizes |
| Mixpanel | Product Analytics | User behavior tracking | Deep cohort and retention analysis | Startups, SMEs |
| Amplitude | Product Analytics | Event-based tracking | Complex user journey mapping | SMEs, Enterprise |
| Matomo | Web Analytics | Privacy-focused tracking | Full data ownership and compliance | SMEs, Enterprise |
| Semrush | SEO Analytics | Keyword and competitor research | Uncovering organic growth opportunities | All sizes |
| Ahrefs | SEO Analytics | Backlink and site auditing | Deep technical search optimization | All sizes |
| Google Search Console | SEO Analytics | Organic search monitoring | Direct insights from the search engine | All sizes |
| Sprout Social | Social Analytics | Social media management | Centralized engagement tracking | SMEs, Agencies |
| Meta Business Suite | Social Analytics | Facebook and Instagram insights | Native ad and page performance data | All sizes |
| HubSpot | CRM & Analytics | Full funnel attribution | Tying marketing efforts to CRM deals | SMEs, Enterprise |
| Looker Studio | BI & Reporting | Dashboard creation | Flexible data visualization | All sizes |
| Power BI | BI & Reporting | Advanced data modeling | Handling massive enterprise datasets | Enterprise |
| Orova Insight | BI & Reporting | Multi-channel reporting dashboards | AI builds charts from plain-language questions | SMEs, Agencies |
Turn multi-channel data into instant decisions. OROVA Insight seamlessly connects APIs from Online to Offline, helping you see the full picture of your business through a Real-time chart reporting system.
OROVA Insight: Integrate Online - Offline data, visualize reports in Real-time.
Detailed categories of marketing analytics tools
To make informed decisions, you must understand the technical nuances, the setup processes, and the practical limitations of each platform. We have divided the ecosystem into four major categories based on their functional role within your data stack.
Web and product analytics
This category focuses on understanding what happens on your owned digital properties. These platforms track user interactions, page views, and specific events to help you optimize the user experience and conversion rates.
Google Analytics 4 (GA4) Google Analytics 4 is the industry standard for measuring website traffic. It uses an event-based data model, meaning every interaction, from a page load to a video play, is recorded as an event. The core value lies in its seamless integration with the Google advertising ecosystem, allowing you to build audiences and measure ad performance natively. It fits businesses of all sizes. To start using GA4, you must first create a property in the admin panel and generate a web data stream. Second, install the provided tracking tag directly into your website's code or via a tag manager. Third, use the built-in debug view to verify that events are firing correctly when you click buttons on your site. What to plan for: GA4 can apply data thresholds to protect user privacy, so some rows may be withheld in reports with small user counts. Check the thresholding indicator before drawing conclusions from granular segments.
Mixpanel Mixpanel specializes in product analytics, focusing deeply on how logged-in users interact with software applications. Its core value is the ability to build complex funnels and cohort retention charts in seconds without writing database queries. It is ideal for SaaS startups and mobile app developers who need to understand feature adoption. To implement Mixpanel, first define your core tracking plan, identifying the three most important actions a user can take. Second, integrate their software development kit (SDK) into your application code, ensuring you pass a unique user ID with every event. Third, build your first retention report to track how many users return after completing the core action. What to plan for: Mixpanel depends on a well-defined event taxonomy. If tracking is implemented inconsistently, cleaning the data afterwards takes technical effort, so agree on event names before development starts.
Amplitude Amplitude is a powerhouse for behavioral analytics, similar to Mixpanel but often favored by larger enterprises. Its primary value is behavioral analysis that helps identify the user actions most associated with long-term retention. It fits mid-market and enterprise companies with dedicated product management teams. To get started, you must map out your critical user paths in a spreadsheet. Next, initialize the Amplitude SDK and set up user properties to track demographic or account-level details. Finally, create a behavioral cohort to isolate users who perform high-value actions frequently. What to plan for: behavioral cohorts are only as reliable as your event plan and the amount of history you have collected, so expect a ramp-up period before the analysis becomes meaningful.
Matomo Matomo positions itself as the privacy-focused alternative to Google Analytics. Its core value is data ownership; you can host Matomo on your own servers, ensuring that no third party ever accesses your user data. This makes it a strong fit for government agencies, healthcare providers, and businesses operating under strict European privacy laws. To start, choose whether you will use their cloud-hosted version or install it on your own server. Second, replace your existing analytics scripts with the Matomo tracking code. Third, configure your privacy settings to anonymize IP addresses according to local regulations. What to plan for: the self-hosted route requires infrastructure maintenance. You must manage server updates, security patches, and database scaling entirely on your own.
SEO and organic search analytics
Understanding how users find you through search engines requires specialized software that crawls the web, analyzes keyword volumes, and monitors technical website health. If you are preparing a comprehensive seo checklist, these platforms are indispensable.
Semrush Semrush is a comprehensive digital marketing suite heavily focused on search engine optimization. Its core value is competitive intelligence; it allows you to see exactly which keywords your competitors rank for and estimate their organic traffic. It fits agencies and in-house marketing teams focused on content strategy. To begin, enter your domain into the site audit tool to generate a baseline health score. Next, set up a position tracking campaign by inputting your 50 most important target keywords. Third, use the keyword magic tool to discover long-tail variations with low ranking difficulty. What to plan for: competitor traffic and keyword figures are estimates built from its own databases, so treat them as directional and confirm your own site's numbers in Google Search Console.
Ahrefs Ahrefs is known for its large backlink index built by its own web crawler. Its primary value is this backlink data, which allows SEO professionals to reverse-engineer competitor link-building strategies. It is favored by technical SEO specialists and niche site builders. To start, verify ownership of your domain so the tool can analyze your own site. Second, run the site explorer to analyze your current backlink profile and identify lost links. Third, use the content gap tool to find valuable keywords your competitors rank for, but you do not. What to plan for: like any third-party SEO tool, its traffic numbers are modeled estimates, so use it for direction and competitive context rather than as your source of truth for clicks.
Google Search Console Google Search Console is a utility provided by Google that shows exactly how your site performs in organic search results. Its core value is absolute data accuracy regarding impressions and clicks from Google, as the data comes directly from the source. Every website owner, regardless of size, must use this tool. To begin, verify your domain ownership by adding a specific text record to your DNS settings. Next, submit your XML sitemap so Google can efficiently crawl your pages. Finally, monitor the coverage report weekly to identify any pages that Google refuses to index. What to plan for: the performance report covers 16 months of data, meaning you must export the data externally if you want to perform long-term, multi-year trend analysis.
Social media and paid ads analytics
Tracking engagement across fragmented social networks requires tools that aggregate performance metrics into unified views. A proper social analytics setup prevents you from logging into five different platforms every morning, but in a multi-channel stack these numbers still need to sit next to web and CRM data.
Sprout Social Sprout Social is a social media management and analytics platform. Its core value is its unified inbox and robust presentation-ready reporting, which saves agencies countless hours when reporting to clients. It fits mid-sized businesses and marketing agencies that prioritize brand reputation management. To start, authenticate and connect all your brand's social media profiles in the dashboard. Next, configure your brand keywords in the listening module to track brand mentions across the web. Third, set up an automated monthly report template to send directly to your stakeholders. What to plan for: it focuses on social channels, so you still need web analytics and CRM data to connect social activity to revenue.
Meta Business Suite Meta Business Suite is the native management and insights environment for Facebook and Instagram. Its value lies in showing reach, content performance and audience data directly from the platform itself, alongside the ad results you manage in Meta's ad tools. It is a natural starting point for anyone running campaigns on Meta properties. To begin, link your Facebook page and Instagram account within the suite settings. Next, navigate to the insights tab to review audience growth and content performance. Third, ensure your Meta Pixel is correctly connected to your ad account to track website conversions accurately. What to plan for: it reports on Meta's own properties using Meta's attribution settings, so its conversion numbers will not match GA4 one-to-one. Decide in advance which source you treat as the reference for each metric.
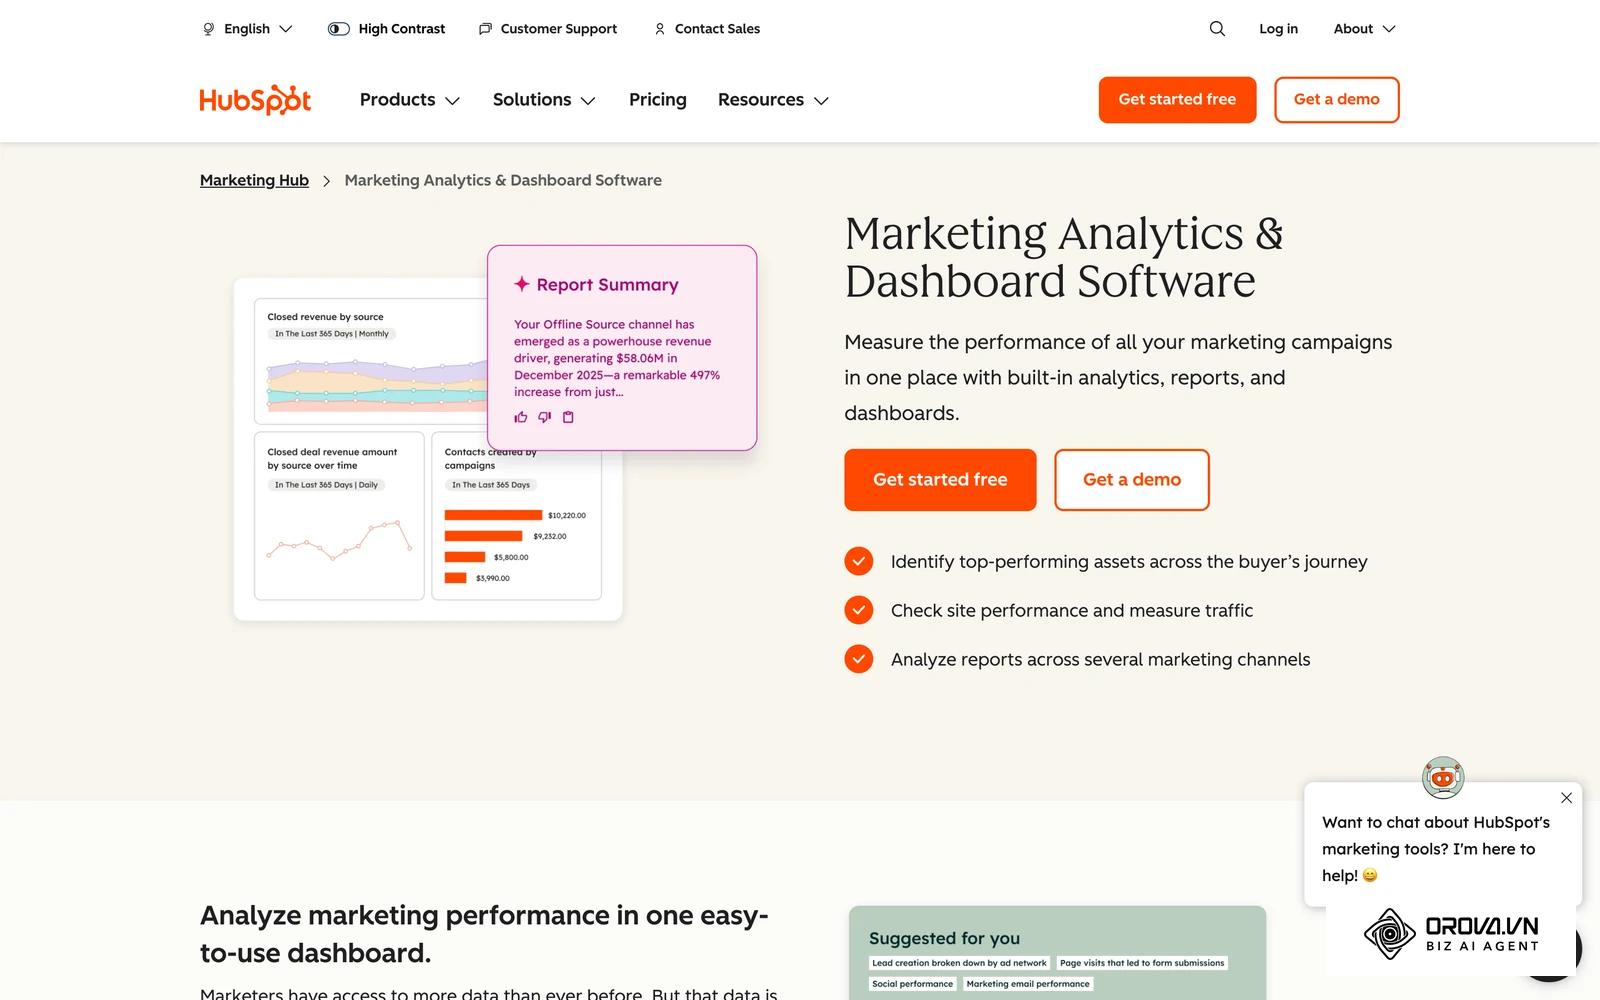
HubSpot HubSpot is primarily a CRM, but its marketing hub includes analytics capabilities. Its core value is closed-loop attribution; it allows you to trace a specific closed revenue deal back to the exact social media post or ad campaign that generated the initial lead. It fits B2B companies with long sales cycles. To start, install the HubSpot tracking code on your website to monitor visitor activity. Next, connect your ad accounts to enable auto-tracking of campaign spending. Third, build custom reports mapping contact lifecycle stages to specific marketing channels. What to plan for: attribution reports are only as accurate as the lifecycle stages and lead source fields your team maintains in the CRM.
Business intelligence and automated reporting
When you have multiple data sources, you need a visualization layer to bring everything together. Setting up proper marketing dashboard KPIs helps executives understand performance without digging through raw spreadsheets.
Looker Studio Looker Studio (formerly Google Data Studio) is a visualization tool from Google. Its core value is its deep, native integration with other Google products, allowing you to build highly customizable, interactive dashboards. It fits organizations that rely heavily on the Google ecosystem and have team members comfortable with basic data manipulation. To get started, create a new blank report and add GA4 as your primary data source. Second, drag and drop charts onto the canvas, adjusting the metrics and dimensions in the properties panel. Third, share the dashboard link with your team, setting permissions to view-only. What to plan for: dashboards that blend many third-party connectors take longer to load, so summarize heavy data sources before they reach the report.
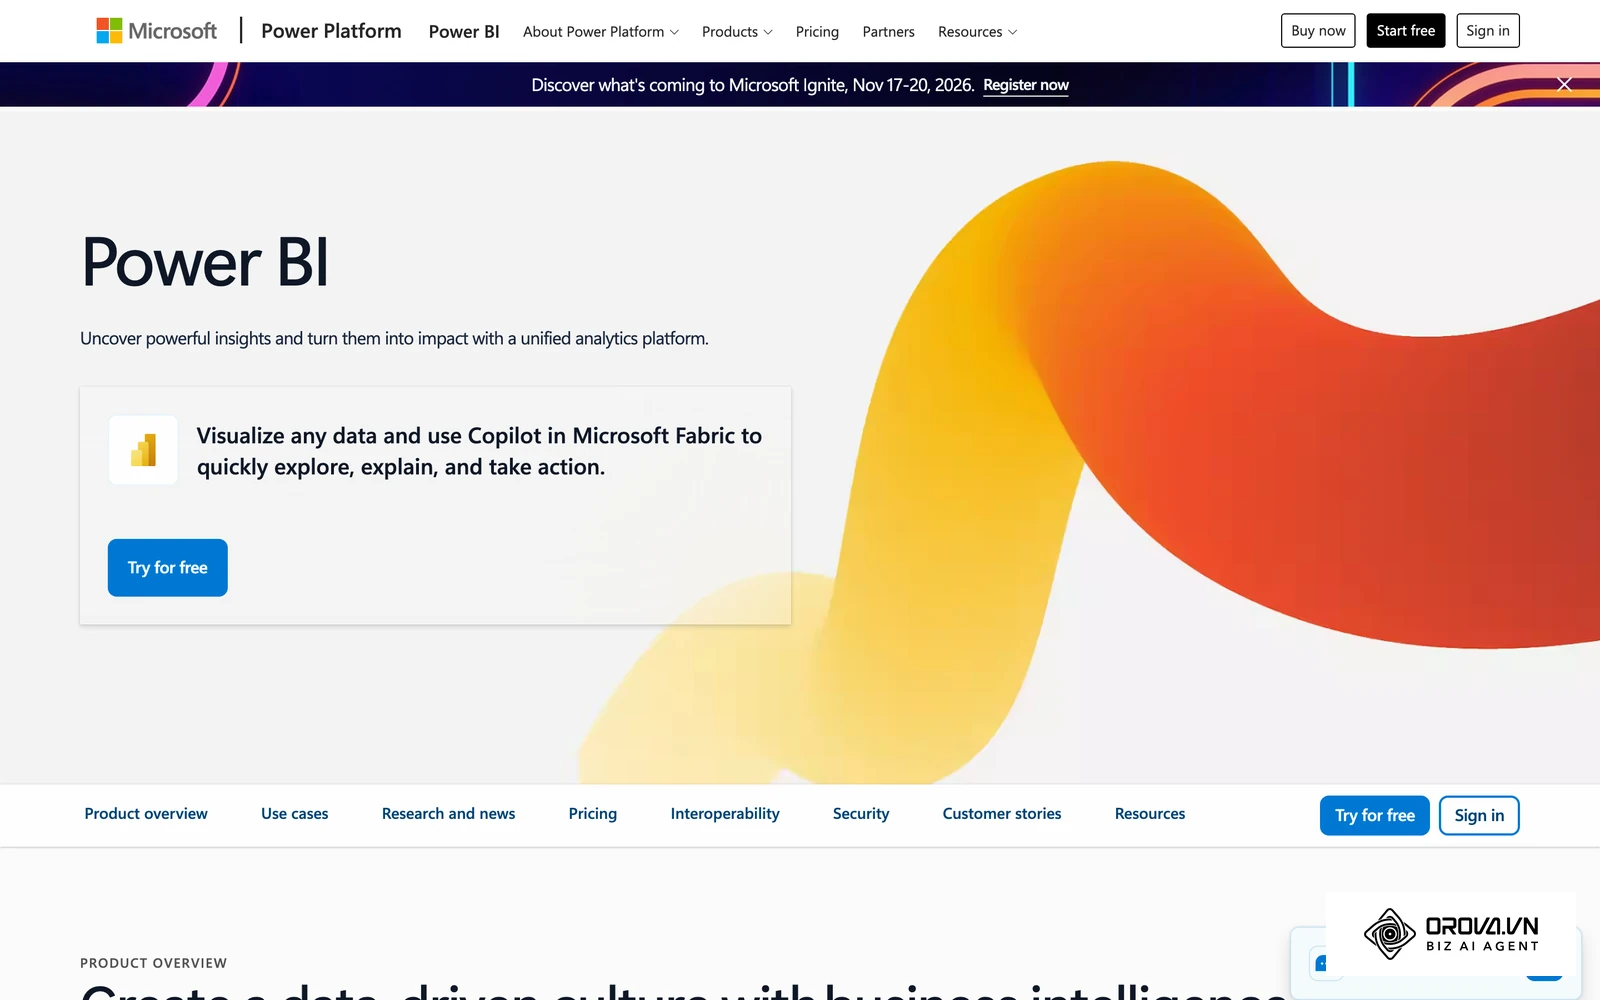
Power BI Power BI by Microsoft is a business intelligence platform. Its value lies in its data modeling capabilities, capable of processing massive datasets and performing complex transformations using the DAX formula language. It fits large enterprises heavily invested in the Microsoft Azure ecosystem. To start, download the desktop application and connect it to your central database. Next, use the Power Query editor to clean and merge your tables. Finally, publish your completed reports to the cloud service for organizational distribution. What to plan for: advanced modeling with DAX and Power Query benefits from specialized training and a working understanding of relational data, so budget time for skills, not just setup.
Orova Insight Orova Insight is designed to automate marketing reporting without coding. It connects GA4, Search Console, Google Ads, Meta Ads, Instagram, Threads, TikTok, YouTube, LinkedIn, and Zalo OA. It also connects CRM software or your own sources via API or Webhook, and synchronizes with Google Sheets. You build views on a drag-and-drop dashboard similar to Looker Studio, with versions, restore, sharing, and live viewing. You can ask questions in plain language and the AI builds the chart. You can present data in a slideshow mode with permissions, and send scheduled reports with custom metrics. To start, authorize the connections to your ad platforms in the integration settings. Second, use the natural language prompt to ask for a specific chart, such as "show me last month's ad spend by channel". Third, arrange the generated charts onto your dashboard and schedule a weekly report for your team. What to plan for: Orova Insight is not a data warehouse and does not offer SQL modeling. It is designed for fast, automated visualization, not for completely replacing enterprise-grade, highly customized SQL data engineering pipelines.
No more lag in data management. Unlock the power of the OROVA Insight system to sync O2O (Online-to-Offline) data flows and visualize every report in real time.
OROVA Insight: Integrate Online - Offline data, visualize reports in Real-time.
How to choose marketing analytics tools by business size
Selecting software based purely on feature lists often leads to bloated budgets and unused technology. Integration projects often stall when infrastructure costs were not estimated up front. You must align your technology choices with your organizational scale and technical capabilities.
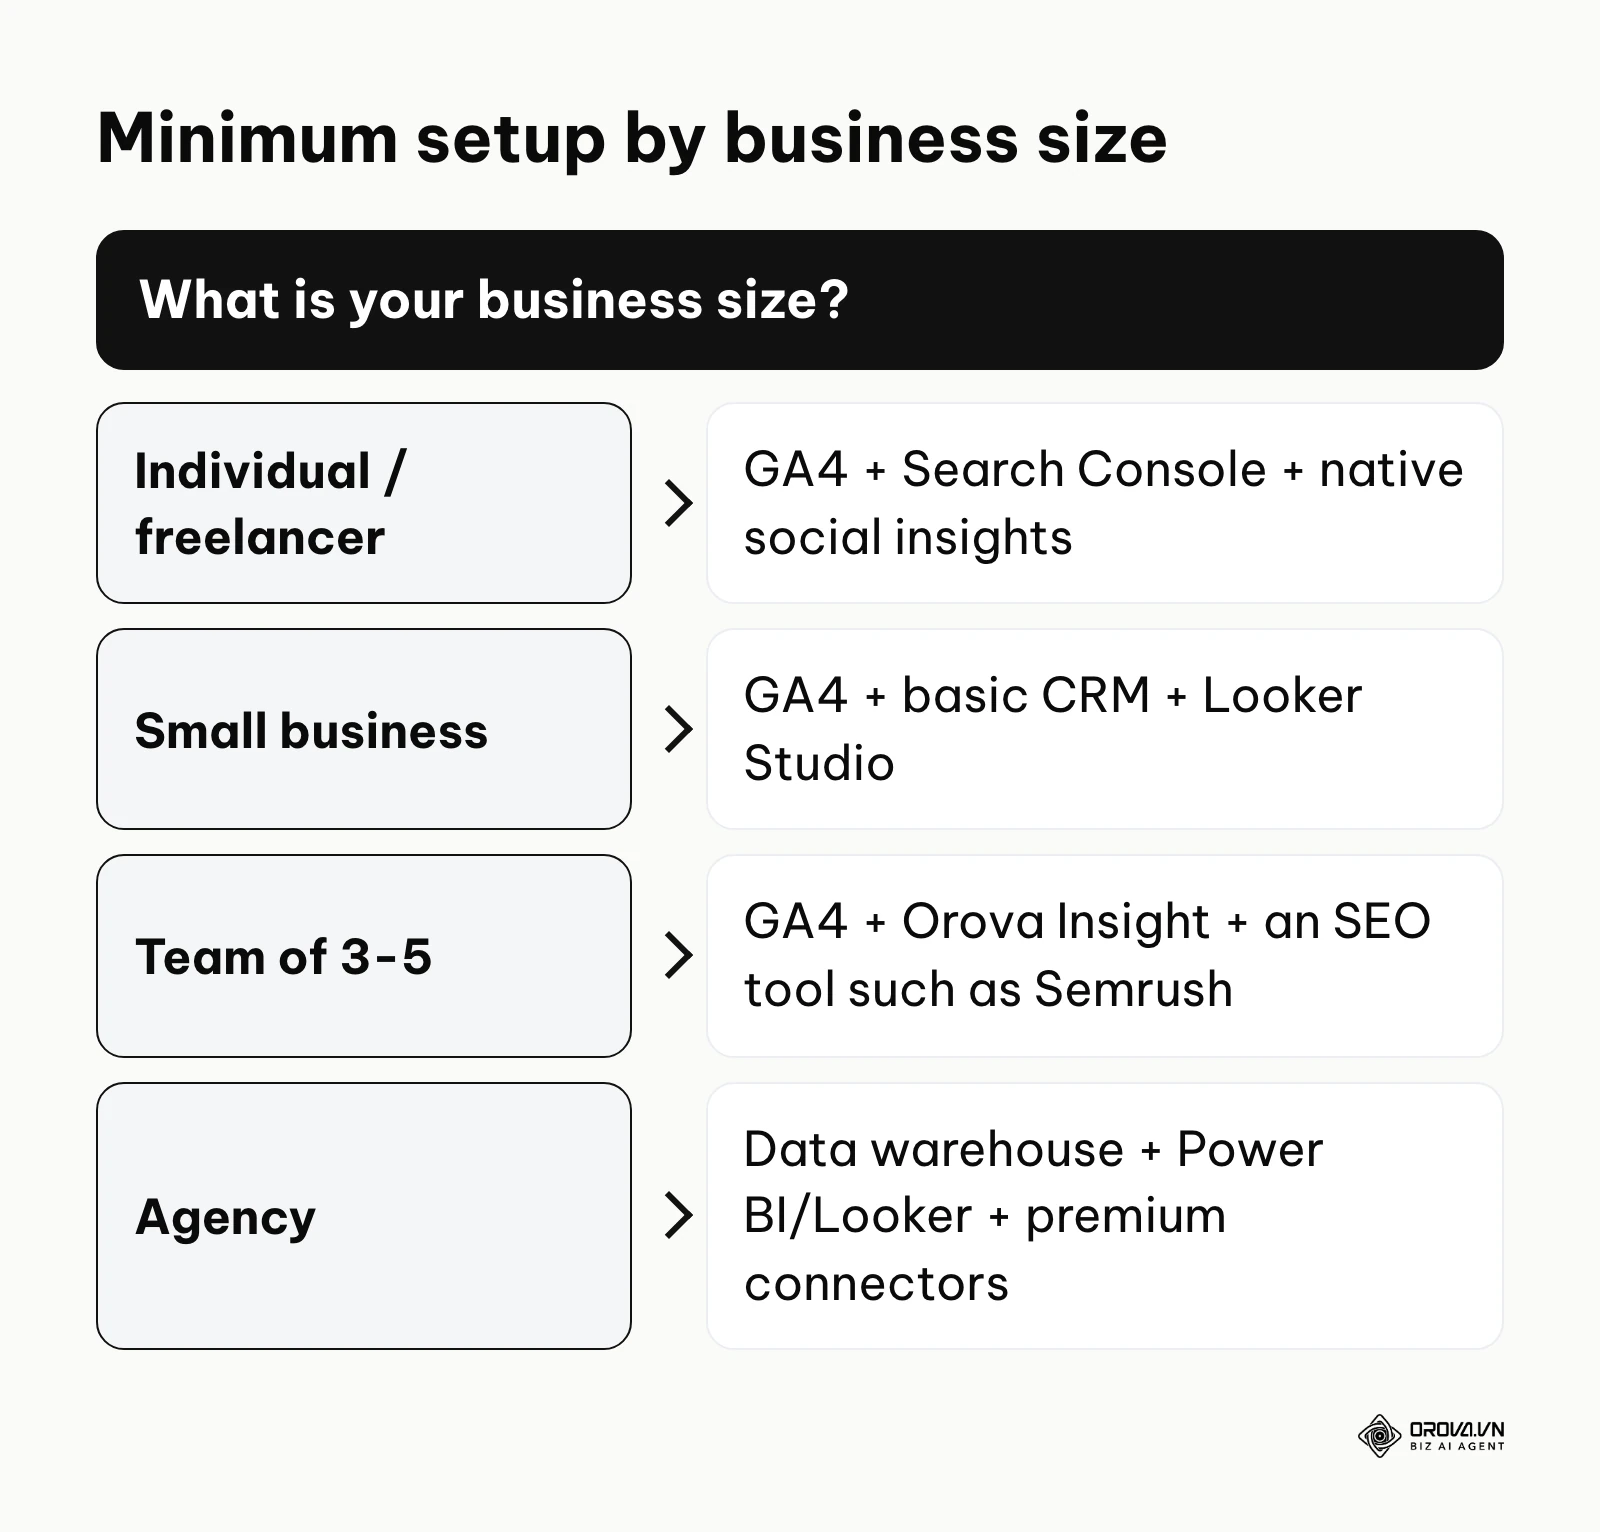
The matrix below outlines the minimum recommended setups tailored to different business sizes, ensuring you do not overbuy or under-equip your team.
| Business Size | Recommended Minimum Setup | Rationale |
|---|---|---|
| Individual / Freelancer | GA4 + Google Search Console + Native Social Insights | Covers basic tracking needs with native tools and no API management. |
| Small Business | GA4 + Basic CRM + Looker Studio | Centralizes basic reporting to save time, providing a unified view of lead generation efforts. |
| Team of 3-5 | GA4 + Orova Insight + Specialized SEO Tool (Semrush) | Automates reporting workflows, freeing up small teams from manual spreadsheet data entry. |
| Agency | Custom Data Warehouse + Power BI/Looker + Premium Connectors | Handles massive, multi-client data volumes efficiently while providing white-labeled, secure dashboards. |
When choosing your stack, beware of the hidden costs associated with data pipelines. Many extraction tools charge per row of data processed. If you leave a tracking script running unchecked on a high-traffic website, your monthly API connector fees can skyrocket unexpectedly.
Illustrative example: Context: A fast-growing retail agency with 15 employees wanted to build a unified reporting dashboard for all their enterprise clients. Steps taken: They signed up for a premium data warehousing service without estimating their total data volume. Next, they connected 20 different advertising accounts using an automated pipeline tool. Then, they built complex dashboards that queried the entire historical database every time a client opened the reporting page. Stumbling block and fix: Their monthly server bill unexpectedly spiked due to inefficient, heavy queries running constantly; they fixed this by modifying their pipeline to aggregate the raw data into daily summary tables before the dashboard accessed it. Result: The agency delivered fast-loading, stable reports to clients while keeping infrastructure costs predictable and cutting most of their manual reporting work.
Marketing analytics tools trends in the next few years: my perspective
As the digital landscape evolves, the software we use to measure success must adapt. Based on current technological trajectories, I anticipate several major shifts in how we approach data over the next few years.
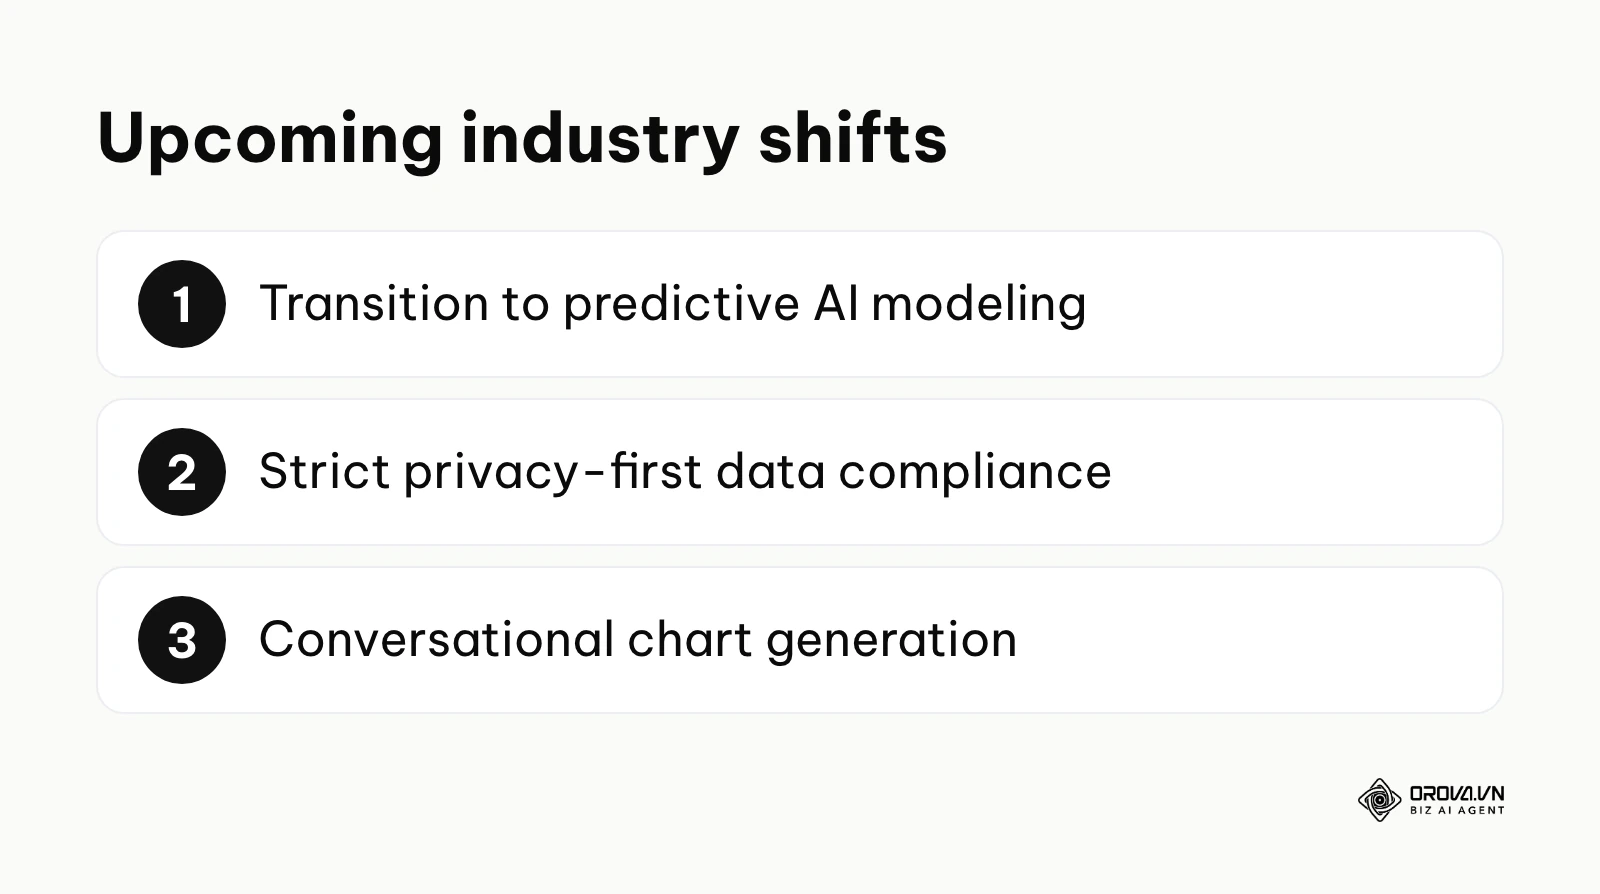
The transition from historical reporting to predictive AI modeling
Currently, most dashboards tell you what happened last week. I believe that in the coming years, standard platforms will put far more weight on predicting what will happen next month. I expect AI models to analyze historical seasonal trends and current ad performance to flag likely revenue drop-offs earlier. You should prepare for this by ensuring your historical data is clean and rigorously structured today, as AI models cannot generate accurate predictions from messy, fragmented datasets.
Strict privacy-first data compliance becomes mandatory
We are already seeing the deprecation of third-party cookies and heightened regulatory scrutiny. I expect granular, user-level tracking to keep getting harder for most businesses, with platforms leaning more on aggregated, modeled data to estimate conversions. To prepare, you must begin building a robust first-party data strategy immediately, incentivizing your users to log in and share their information directly with your business in exchange for clear value.
The rise of conversational chart generation
I think the reliance on complex SQL queries and deep drag-and-drop menus will shrink for everyday reporting. My view is that conversational interfaces will become a common way marketers interact with their data stacks: you ask your dashboard a question, and the system builds a first version of the chart for you to check. You should start familiarizing your team with basic prompt engineering concepts now, as clearly articulating business questions will become a more valuable skill than memorizing software interface layouts.
Frequently asked questions about marketing analytics tools
What is the difference between marketing analytics and web analytics?
Web analytics focuses strictly on website behavior, such as page load speeds, bounce rates, and session durations. Marketing analytics encompasses a broader scope, integrating web data with offline sales, advertising spend, and CRM records to calculate overall return on investment across the entire business.
How does AI impact modern marketing analytics tools?
AI is fundamentally changing how we interact with data by automating anomaly detection and natural language processing. Instead of manually digging through spreadsheets to find a drop in performance, AI features can flag unusual changes and generate charts by interpreting your written questions.
Do I need to learn SQL to use these platforms?
For most modern, out-of-the-box platforms, you do not need SQL. Tools utilize drag-and-drop interfaces or conversational AI to build reports. However, if you are building a custom enterprise data stack using a raw data warehouse, a foundational understanding of SQL is highly recommended for creating advanced data models.
How long does it take to implement a new analytics stack?
A basic setup using free native tools can be deployed in a few days. However, constructing a robust, integrated stack that connects multiple advertising platforms to a CRM and a central visualization layer typically requires three to six weeks of planning, configuration, and rigorous testing to ensure data accuracy.
What are the biggest hidden costs in data reporting?
The most significant hidden costs are API connector fees and cloud storage charges. Many automated pipeline tools charge based on the volume of data processed, meaning a sudden spike in website traffic can result in a massive, unexpected monthly bill if your data ingestion limits are not carefully managed.
Can I rely solely on native advertising platform data?
Relying exclusively on the numbers provided by ad platforms is risky, as they have a vested interest in claiming credit for conversions. A third-party analytics tool serves as an independent source of truth, helping you verify whether a Facebook ad or a Google search truly drove the final, measurable business result.
Where to start with marketing analytics tools?
Navigating the landscape of data software can be paralyzing. Instead of attempting to implement a massive, enterprise-grade architecture on day one, you should take a single, practical step based on your current operational reality.
If your organization has absolutely zero tracking in place, your immediate priority is establishing a baseline. Spend one afternoon installing the foundational tracking scripts on your website and verifying that they fire correctly. This single action begins the crucial process of accumulating historical data, which you will need for any future analysis.
If you have basic tracking enabled but your information is scattered across dozens of disconnected platforms, your next step is standardization. Dedicate a planning session to writing a strict, global naming convention document for your campaigns and links. Enforcing this consistency immediately stops the creation of messy data silos.
If your systems are fully connected but you are drowning in overwhelming, complex dashboards that no one reads, you need to simplify. Schedule a meeting with your primary stakeholders and force them to identify the three absolute most critical metrics that dictate business success. Archive all other reports and focus entirely on automating the visualization of those three specific numbers using modern marketing analytics tools.
About the author

Builder of Orova
Nguyễn Đỗ Trọng Ân has 8 years of experience in marketing, including 6 years managing market development across Asia. He builds Orova, a Biz AI Agent that never sleeps: it plans, runs and optimizes work for businesses.
Run your business with AI Agents
Orova is the always-on Biz AI Agent — it plans, runs, and optimizes the work for you.
Save time, unlock productivity.