
Data driven marketing: a step-by-step omnichannel framework

Data driven marketing means using customer and campaign data, instead of gut feeling, to decide who to target, what to say and where to spend your budget. Picture the alternative: you are pouring thousands of dollars into advertising, content, and email campaigns, yet when the leadership team asks which specific channel drove the most profitable customers last month, you hesitate. You open five different browser tabs, pull numbers that do not match, and ultimately rely on a gut feeling to allocate the next quarter's budget. This scenario is incredibly common, and it is exactly what happens when your operations lack a foundational data architecture. Marketing has evolved from a discipline of creative intuition into an exact science of behavioral analysis.
This comprehensive guide breaks down how to transition to a true data driven marketing operation. We will explore how to dismantle isolated data silos, adapt to strict privacy regulations, and build a unified omnichannel ecosystem that turns raw numbers into predictable revenue. Whether you are managing a small startup with limited tools or steering an enterprise operation, this framework will give you the exact steps to build a strategy that scales effectively.
What Is Data Driven Marketing?
Data driven marketing is the strategic practice of leveraging actionable customer information to optimize targeted media buying, personalize creative messaging, and accurately predict future consumer behavior. Instead of relying on broad demographic assumptions or historical industry trends, practitioners use real-time interactions—such as website clicks, email open rates, and in-store purchase history—to shape every campaign decision. The goal is to deliver the right message, to the precise user, at the exact moment they are most likely to convert, thereby maximizing return on investment.
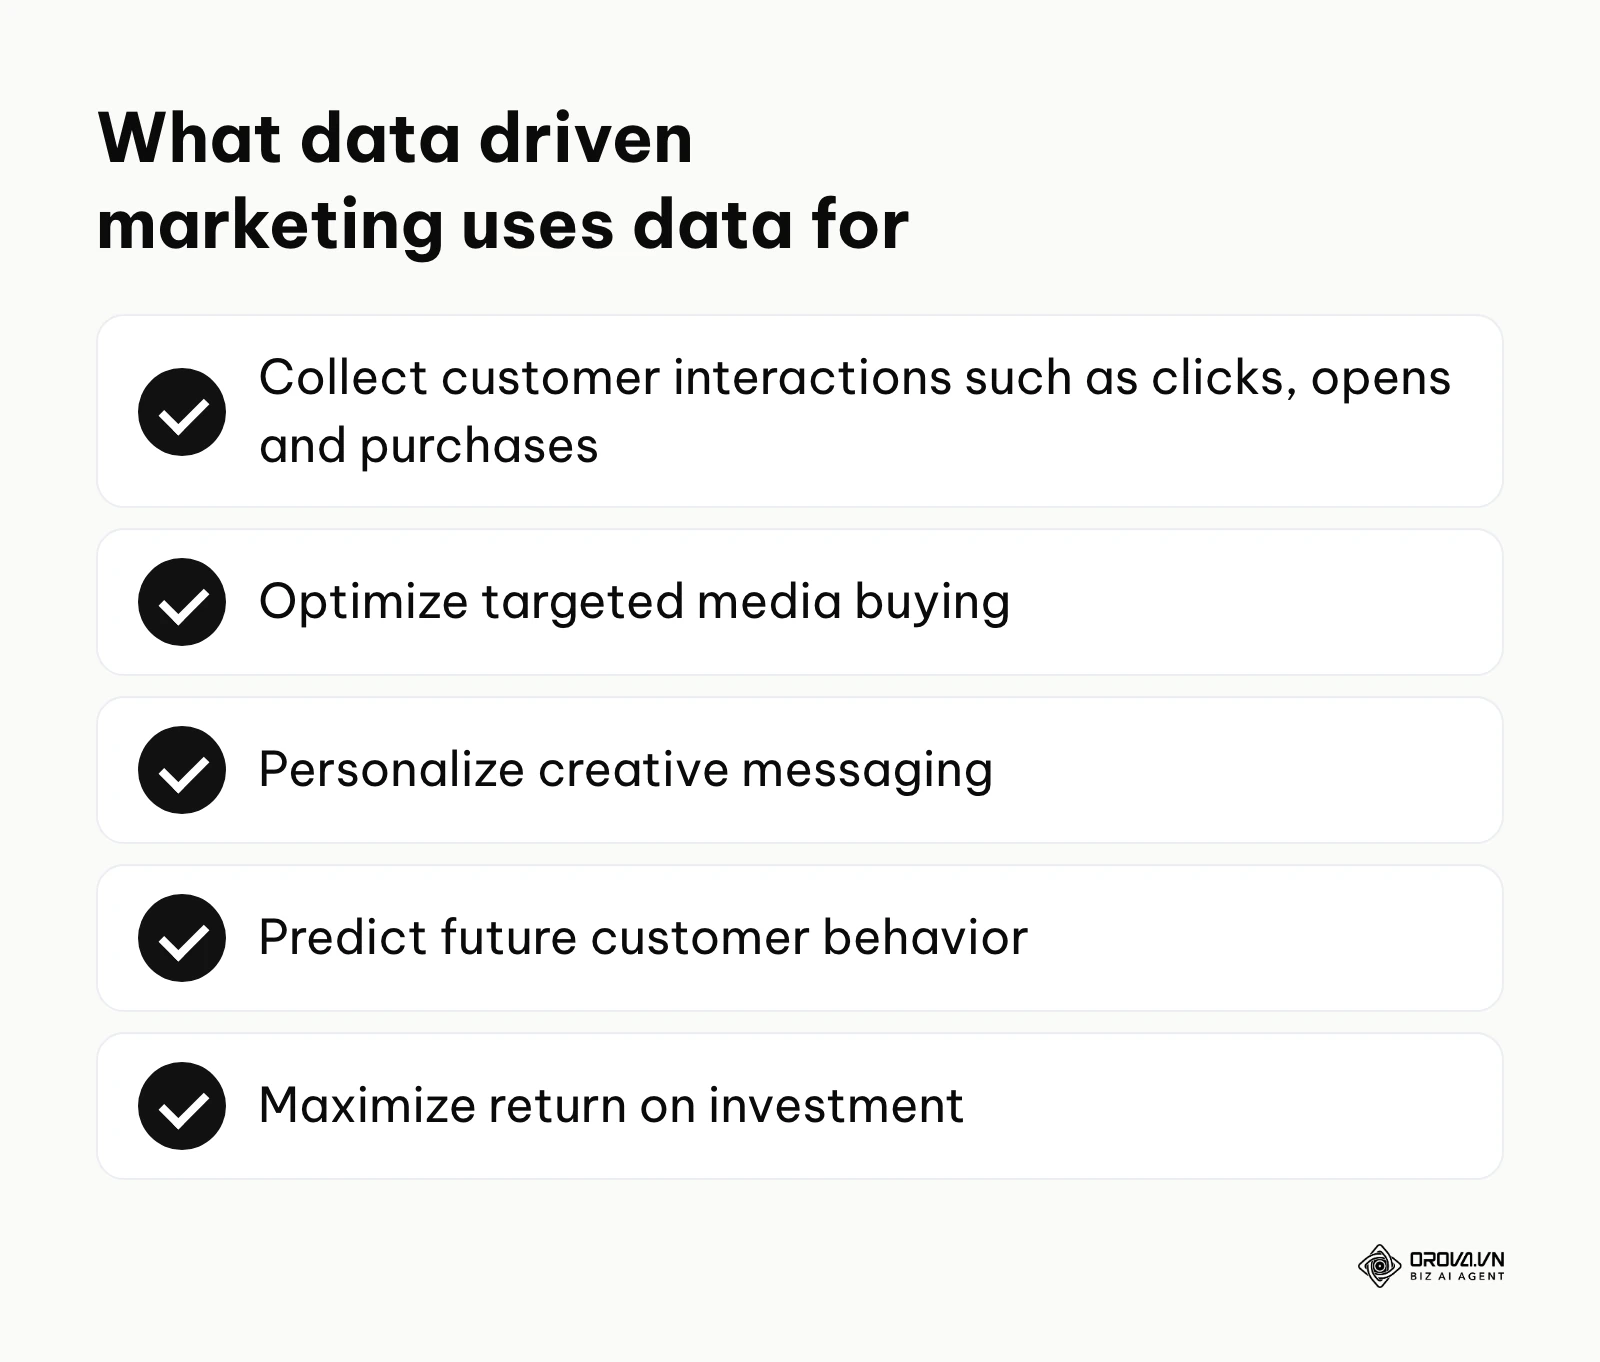
High-performing marketing teams typically draw on many different data sources to inform their cross-channel strategies. This approach is essential for any business operating in a competitive digital landscape where customer acquisition costs are steadily rising. E-commerce brands, B2B SaaS companies, and omnichannel retailers stand to gain the most because their customer journeys are complex and trackable. However, if your business is completely offline with no digital footprint, or a brand-new startup with practically zero historical traffic to analyze, investing heavily in complex data infrastructure prematurely is a mistake; you must first focus on generating baseline demand.
Preparation: The Data Health Checklist
Before you can build predictive models or launch hyper-personalized campaigns, you must ensure the foundation is solid. A house built on messy, inaccurate, or siloed data will eventually collapse under the weight of bad decisions. Preparing for data driven marketing means auditing what you have, defining what you need, and establishing strict rules for how information flows through your organization.
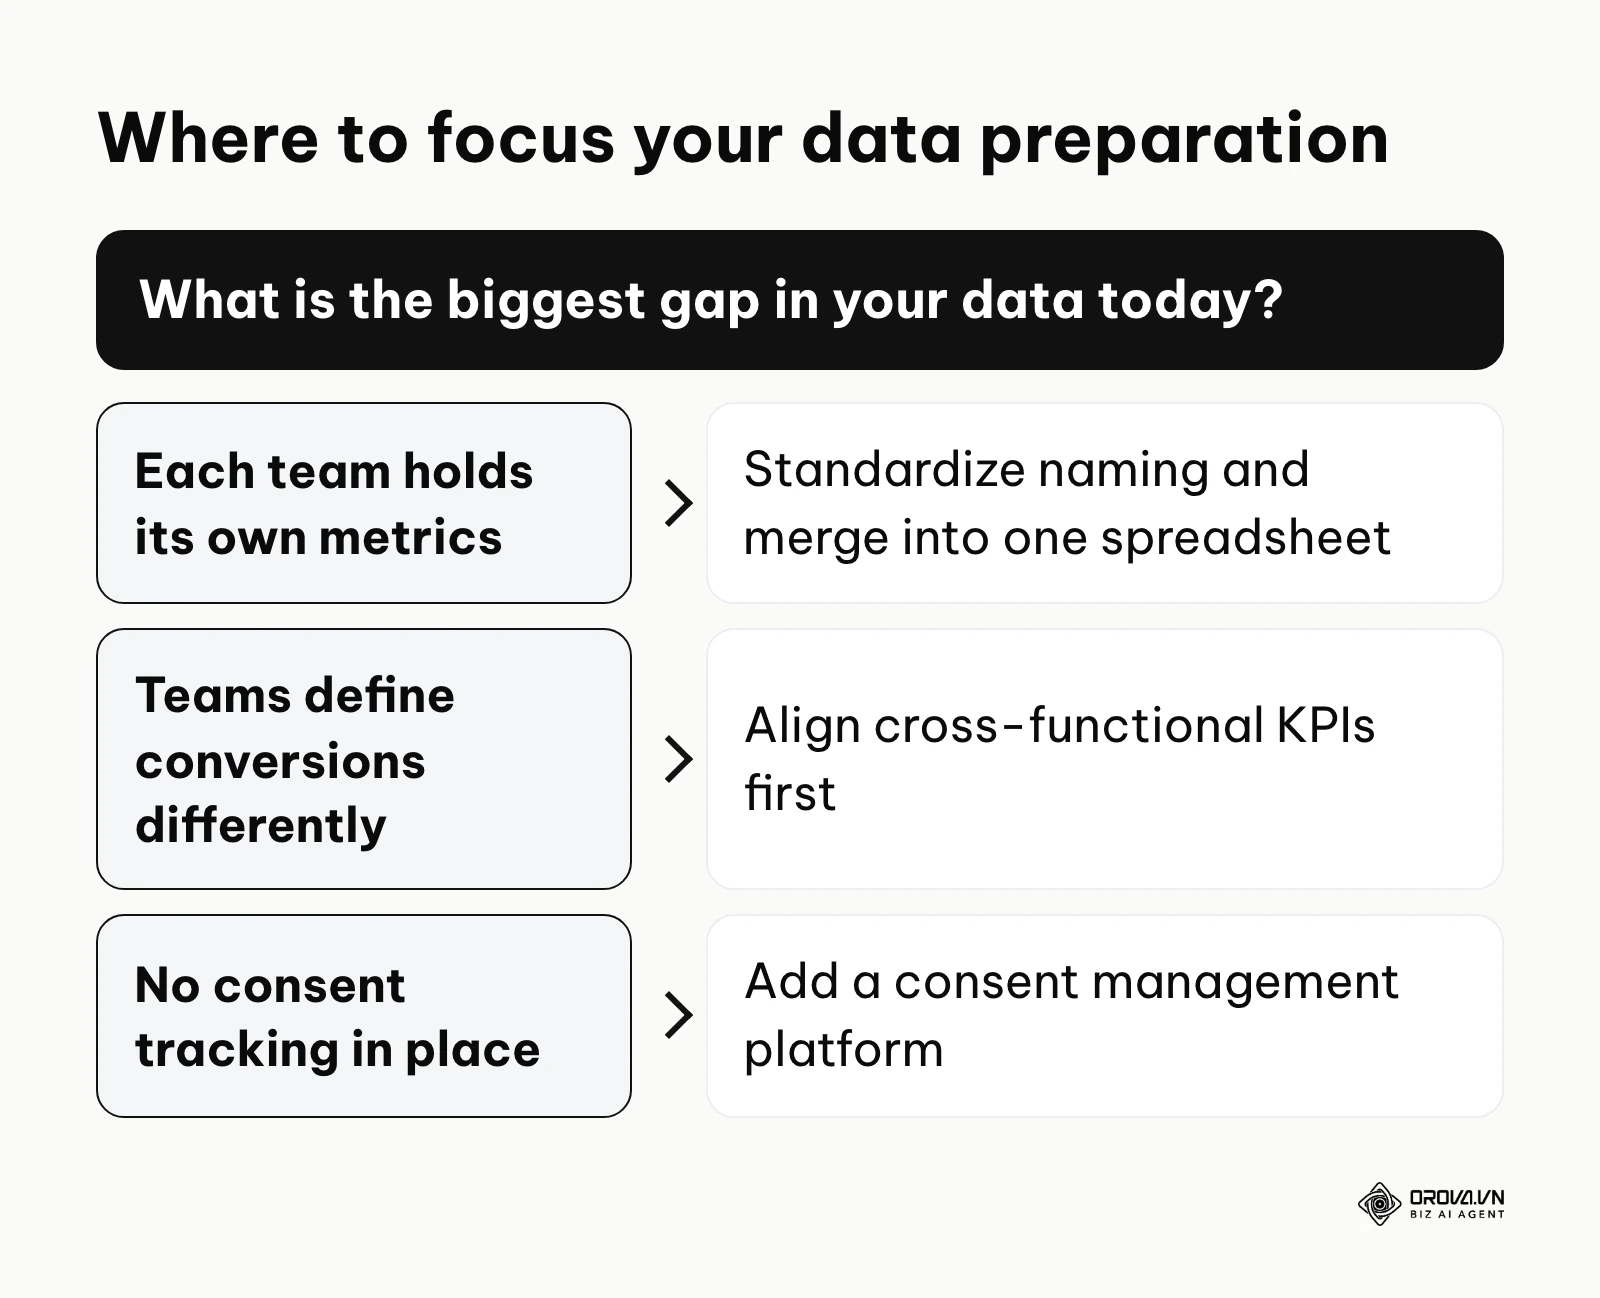
The biggest hurdle for most organizations is "data silos." This occurs when the social media team holds the engagement metrics, the sales team hoards the CRM records, and the web team controls the site analytics. To break this, even small businesses with zero budget can start by standardizing their naming conventions and using simple spreadsheet integrations to create a single source of truth.
| Asset Required | Where to source it | Estimated Time to Implement |
|---|---|---|
| Unified Tracking Taxonomy | Internal marketing team consensus (UTM parameters naming rules). | 1 - 2 weeks |
| Primary Data Hub | Google Sheets (for beginners) or Data Warehouses like BigQuery. | 2 days - 4 weeks |
| Consent Management Platform | Tools like Cookiebot or OneTrust for privacy compliance. | 1 - 2 weeks |
| Cross-functional KPI Alignment | Leadership meetings to define what "conversion" means. | 2 - 3 weeks |
To effectively execute, you must ensure that every tool you use speaks the same language. For instance, if your email platform records a "lead" differently than your advertising platform, your centralized reports will be fundamentally flawed. Preparation is largely about governance rather than purchasing expensive software.
Data Driven Marketing: Step-by-Step Execution Framework
Transitioning to a data-driven model is not an overnight project. It requires a systematic overhaul of how you collect, process, and activate information. The following steps outline a robust, vendor-neutral omnichannel execution framework designed to withstand the complexities of the modern digital landscape.
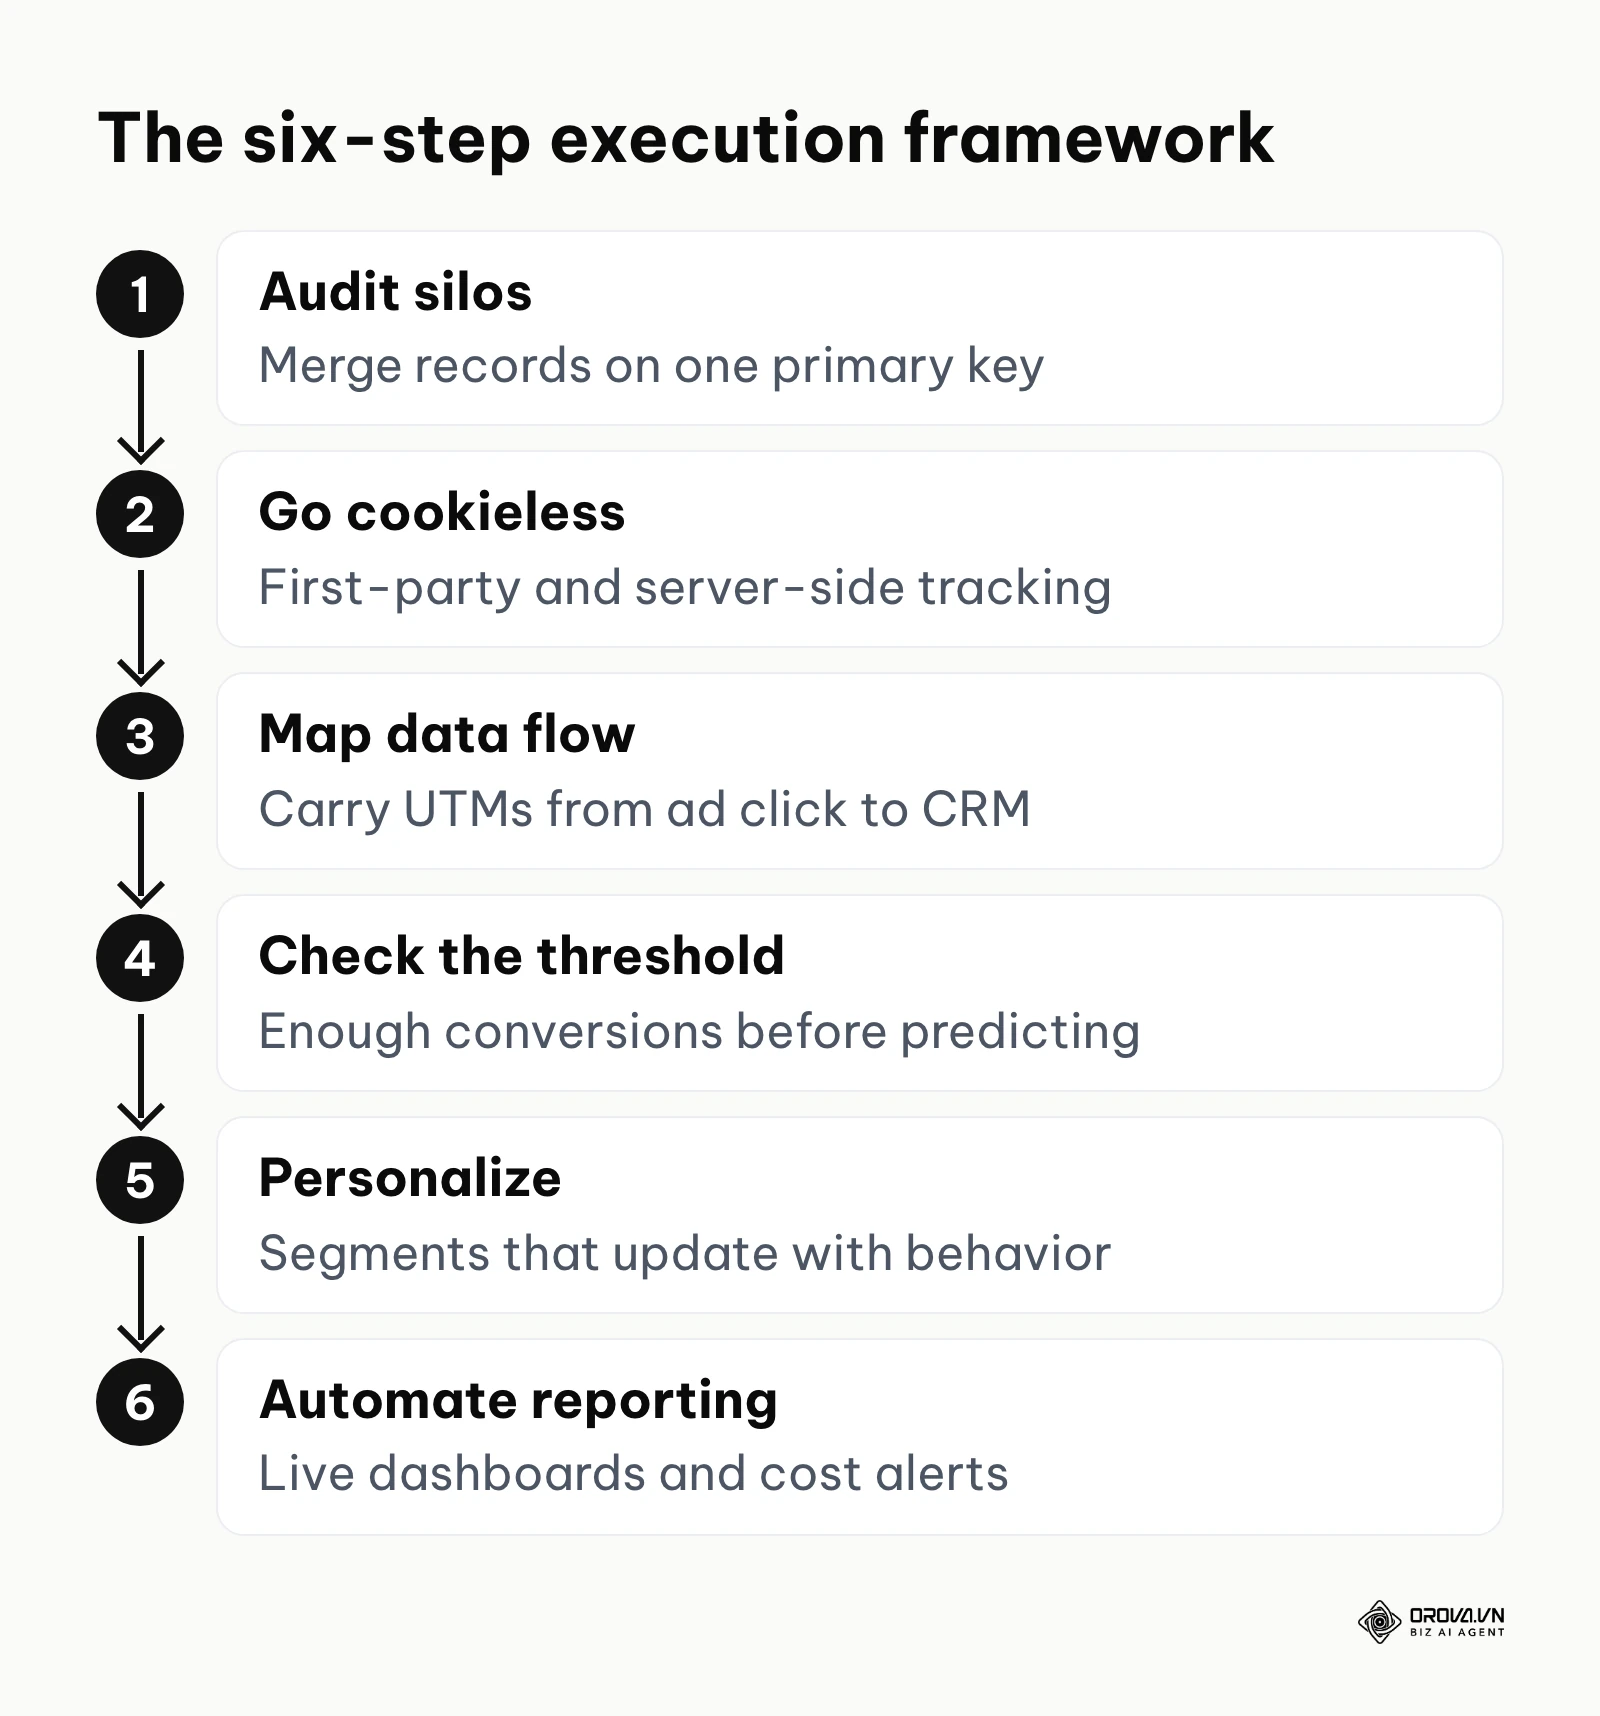
Step 1: Audit and Break Down Data Silos
The very first action is to map out every single place where customer information lives within your organization. This includes your CRM, your website analytics, your advertising accounts, your customer support ticketing system, and even offline point-of-sale systems. You must identify what data is collected, who owns it, and how it is formatted. The goal is to move from fragmented visibility to a unified customer profile.
To resolve silos, you need a unique identifier—a "primary key" in database terms. This is typically the customer's email address or phone number. When you export data from different systems, you use this primary key to merge records. For businesses with limited budgets, this can initially be done manually using VLOOKUP functions in spreadsheets before graduating to automated pipelines. The critical sign that you are doing this correctly is when you can pull up a single user profile and see their customer service tickets alongside their recent purchase history and email engagement.
Illustrative example:
- Context: A B2B software company with 50 employees where the marketing director struggled to align lead numbers between the sales CRM and the marketing automation platform.
- Actions Taken: The director exported CSV files from both systems and audited the email fields. They discovered that sales reps were manually entering variations of company names, while the marketing tool used strict domain tracking. They implemented a standardized data entry rule and used a spreadsheet script to merge the lists based on the exact email address.
- Hurdles and Fixes: The initial merge failed because of inconsistent capitalization and trailing spaces. The team applied data cleaning formulas (TRIM, LOWER) to standardize the text before the final merge.
- Visible Results: The consolidated list revealed a 30% overlap in lead counting, preventing the company from drastically overestimating their quarterly pipeline and allowing them to reallocate budget accurately.
Step 2: Establish a Cookieless Tracking Foundation
The era of relying heavily on third-party cookies to track users across the internet is ending due to privacy regulations and browser updates. To survive, your strategy must pivot aggressively toward Zero-party data (information a customer intentionally shares, like a preference quiz) and First-party data (behavioral data you observe on your own properties).
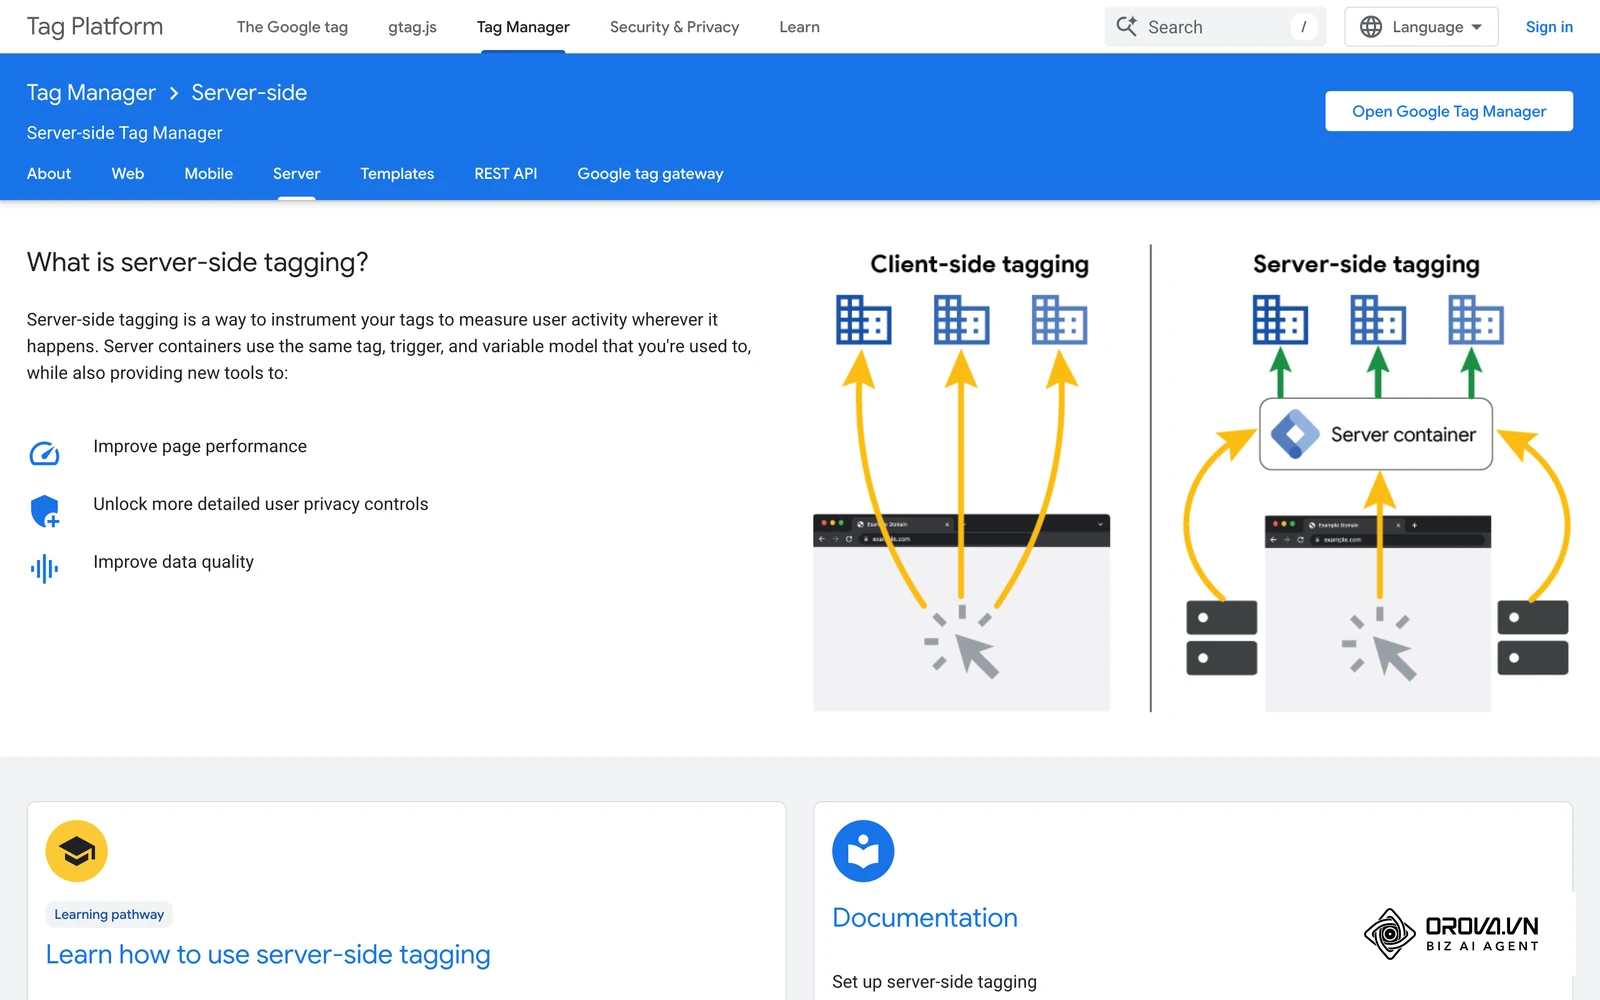
Implementing a cookieless foundation requires technical adjustments. You should transition from client-side tracking (where the user's browser sends data to ad networks) to server-side tracking. In a server-side setup, your website sends interaction data to your own cloud server first, which then securely routes it to your marketing platforms. This approach not only complies with modern privacy standards but also bypasses ad-blockers, ensuring your analytics remain accurate. Furthermore, you must implement strong value exchanges—like exclusive content or loyalty programs—to encourage users to willingly hand over their contact information.
Step 3: Map the Omnichannel Data Flow
Customers do not interact with your brand in a vacuum. A user might discover you on Instagram, read a blog post via organic search, and finally convert through a promotional email a week later. Mapping the omnichannel data flow means establishing a system that connects these touchpoints to accurately attribute revenue and understand the complete journey.
You must configure your tracking infrastructure to pass parameters smoothly between environments. For example, make sure the organic search data you get from Google Search Console is cross-referenced with your website's behavioral analytics. When a user clicks an ad, the UTM parameters must be captured and stored in hidden fields within your lead capture forms, which then pass directly into your CRM. If you fail to maintain this continuous thread, your marketing channels will compete against each other for credit, leading to massive budget inefficiencies.
Step 4: Define the Predictive Marketing Threshold
Predictive marketing uses historical data and machine learning to forecast future outcomes, such as which customers are most likely to churn or who has the highest potential lifetime value. However, a common mistake is attempting to deploy predictive models before acquiring sufficient data volume. If you feed an algorithm a tiny dataset, it will generate highly volatile, inaccurate predictions.
You must define the minimum threshold required for statistical significance. As a general rule, ad platform machine learning algorithms (like those used for predictive lookalike audiences) require at least 50 to 100 specific conversion events per week per campaign to stabilize. If your high-value conversion (like a final purchase) does not hit this threshold, you must train your models on "micro-conversions"—such as adding an item to a cart or downloading a whitepaper. You will know you have crossed the predictive threshold when the algorithm's automated recommendations consistently outperform your manual, rules-based targeting.
Step 5: Execute Personalized Campaigns
Once the data is centralized and the volume is sufficient, the next step is activation. Personalization goes far beyond simply inserting a first name into an email greeting. True data driven personalization involves dynamically altering the website experience, the ad creative, and the product recommendations based on the user's past behavior and predicted intent.
This requires setting up dynamic audience segments that update automatically. For instance, if a user makes a purchase in-store and that data hits your CRM, they should be instantly removed from your "new customer acquisition" ad campaigns and moved into a "post-purchase cross-sell" segment. This level of orchestration ensures that your marketing feels deeply relevant rather than intrusive or redundant.
Illustrative example:
- Context: An omnichannel retail brand where the campaign lead wanted to sync in-store point-of-sale data with online advertising efforts.
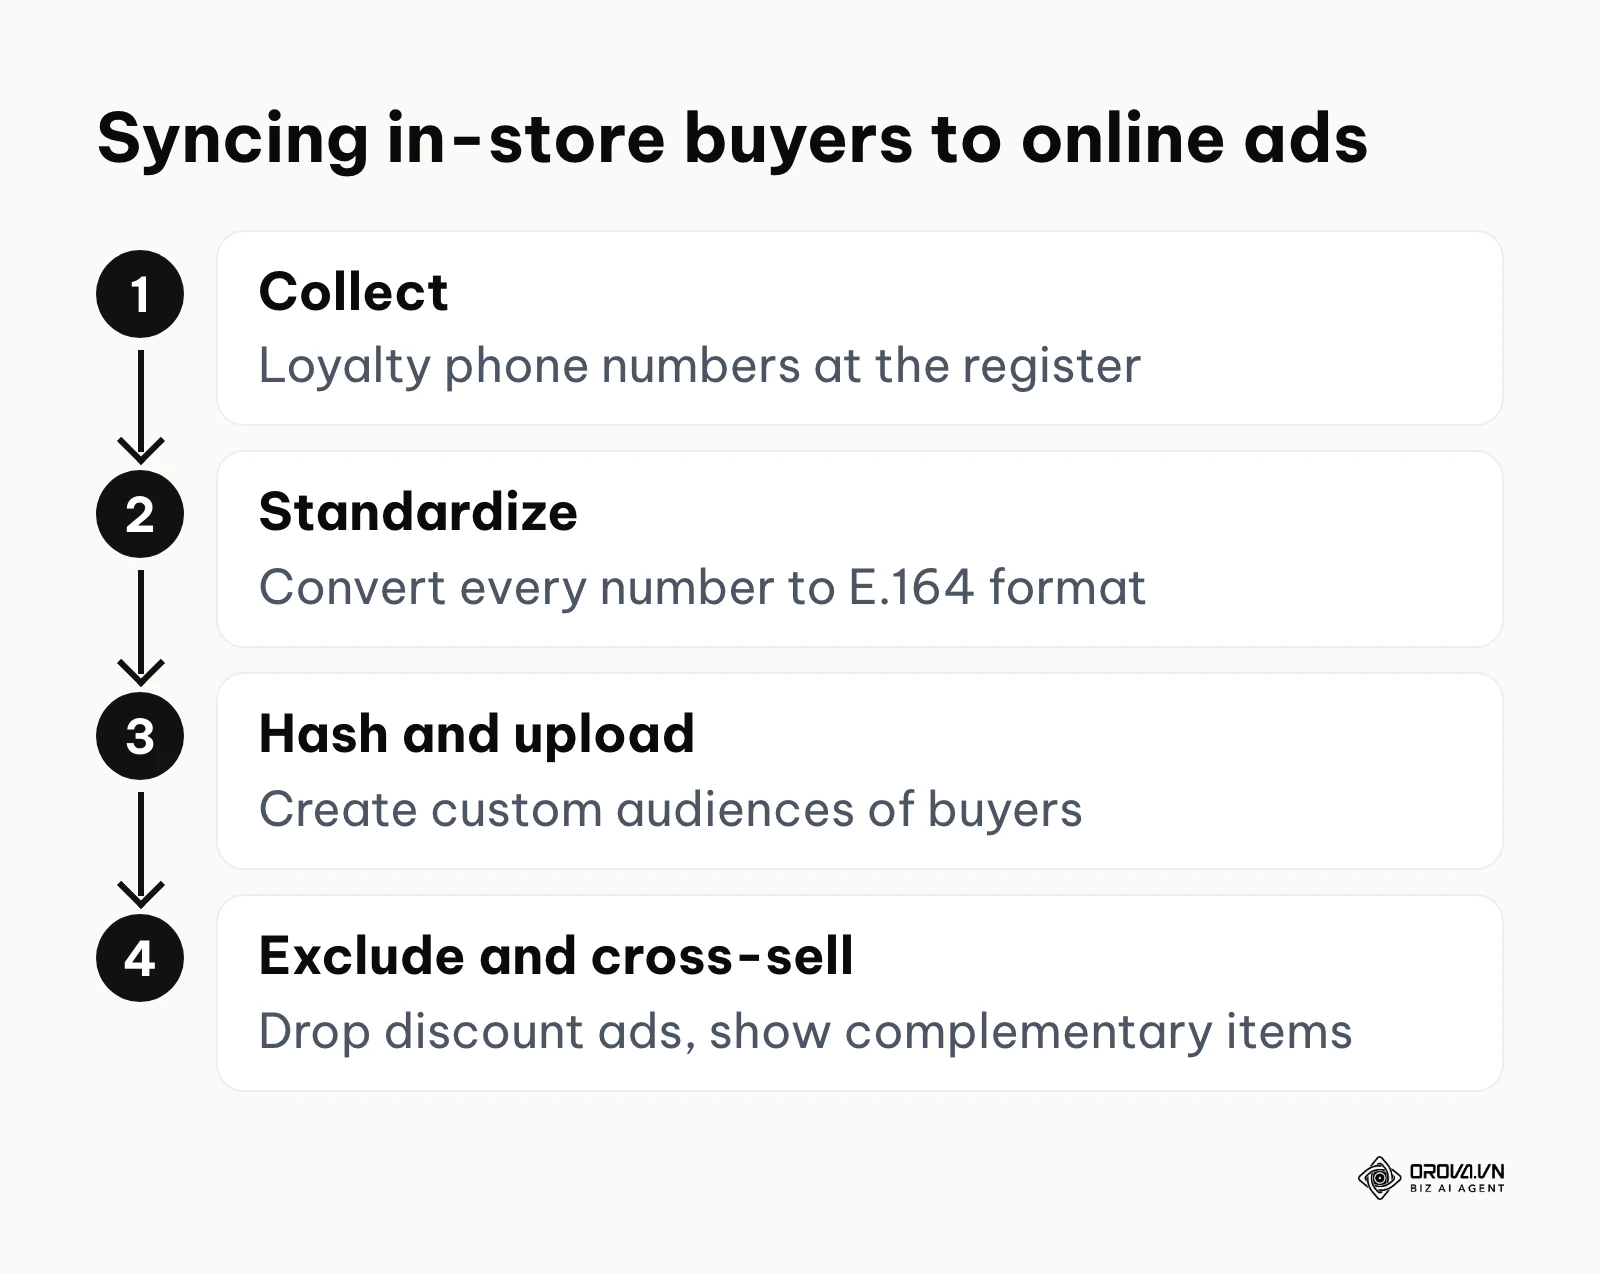
- Actions Taken: The lead mapped the loyalty program phone numbers collected at physical registers. They then securely hashed this data and uploaded it to ad networks to create custom audiences of recent in-store buyers.
- Hurdles and Fixes: Initially, the match rate was abysmal because cashiers entered phone numbers in five different formats (with country codes, without, with dashes). The team used a script to standardize all numbers to E.164 format before hashing.
- Visible Results: The clean data upload achieved an 80% match rate, and by excluding these recent buyers from aggressive discount ads, the team visibly reduced wasted ad spend while increasing repeat purchase frequency through targeted "complementary item" campaigns.
Step 6: Automate Reporting and Optimization
The final step is establishing an automated feedback loop. If your team is spending Friday afternoons manually copying and pasting numbers into presentation slides, they are not doing data driven marketing; they are doing data entry. You must automate the reporting process so that analysts spend their time interpreting the numbers rather than formatting them.
Connect your unified data sources to a visualization tool to create live dashboards. These dashboards should be tailored to specific roles: high-level revenue metrics for executives, and granular campaign-level metrics for specialists. More importantly, this automated reporting must trigger automated optimization. Set up alerts that notify the team immediately if a campaign's cost-per-acquisition spikes beyond the acceptable threshold, allowing for rapid intervention rather than waiting for a month-end review.
Tired of downloading CSV files and building reports by hand every week? Orova Insight connects GA4, Search Console, Google Ads, Meta, TikTok, YouTube, LinkedIn and more to one drag-and-drop dashboard, and brings in CRM or custom data through API, webhook or Google Sheets. Ask a question in plain language and the AI builds the chart for you.
Deep Analysis: Tool Ecosystem and Maturity Framework
Navigating the marketing technology landscape can be overwhelming. Vendors often promise that their software is the silver bullet, leading businesses to over-invest in complex stacks they are not ready to use. Understanding the tool ecosystem requires categorizing software by function and aligning it with your organization's data maturity.
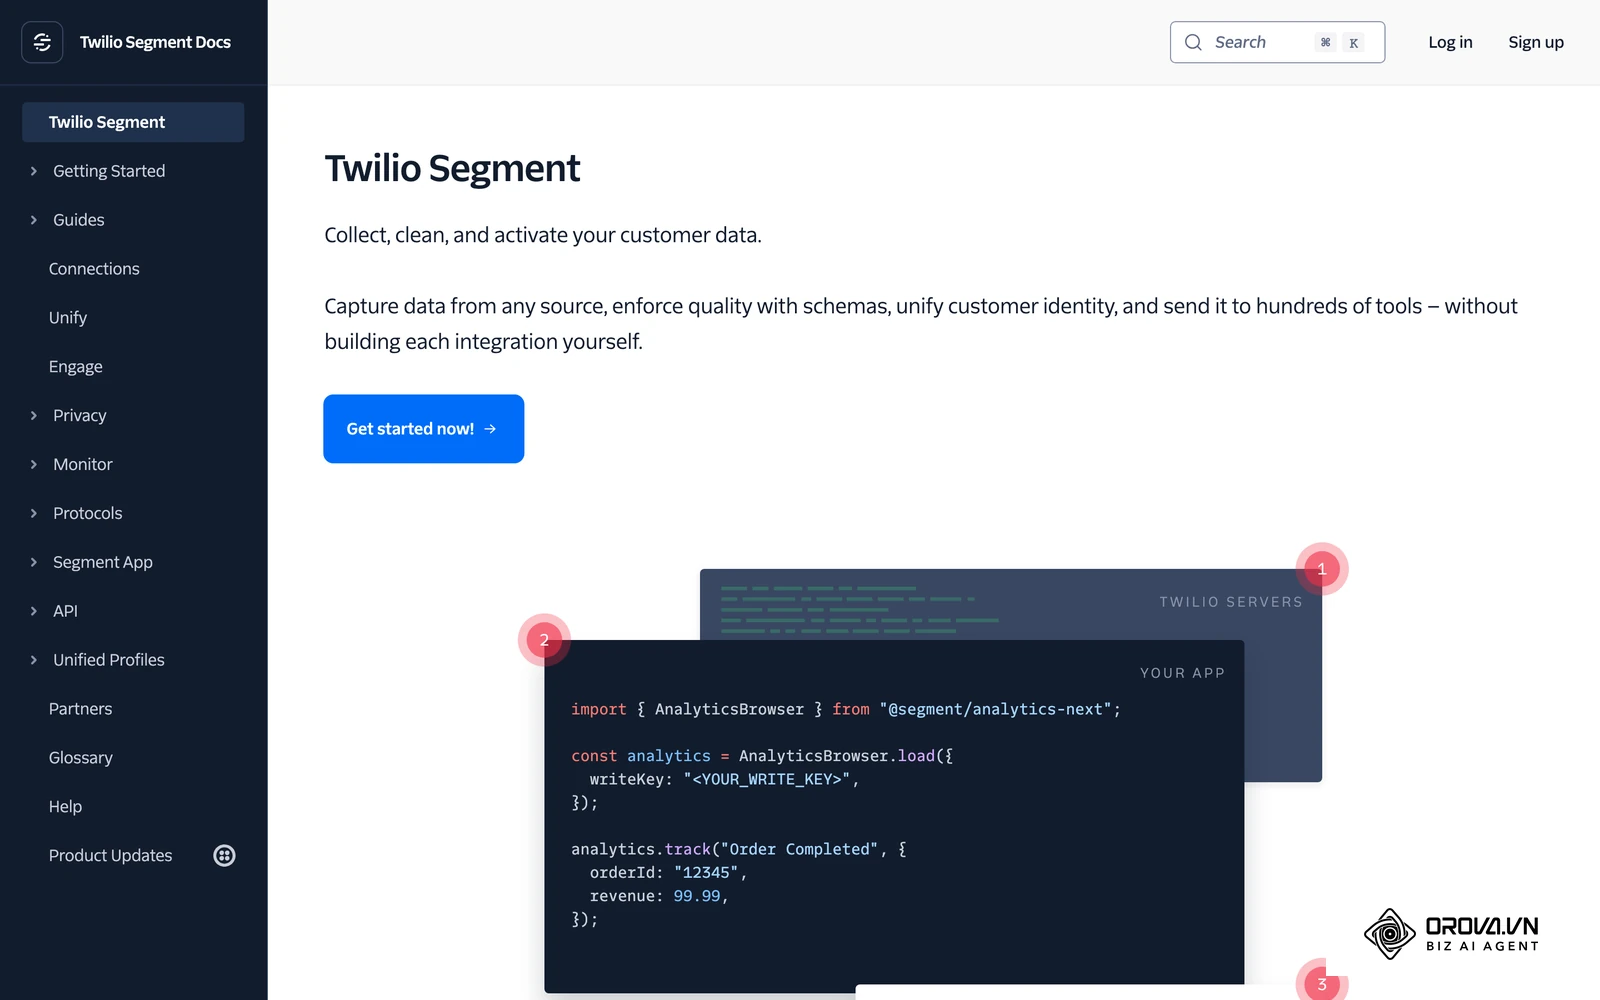
The ecosystem generally breaks down into four layers: Collection (e.g., Google Tag Manager, Snowplow), Storage (e.g., Snowflake, BigQuery), Analytics (e.g., Google Analytics, Mixpanel), and Activation (e.g., Klaviyo, Braze). Customer Data Platforms (CDPs) often bridge the gap between storage and activation by providing marketer-friendly interfaces to manage audiences. Small businesses should focus on native integrations between their core platforms, while enterprise organizations must invest in a centralized data warehouse architecture to handle massive scale and custom modeling.
| Maturity Stage | Ideal For | Typical Architecture | Key Weakness |
|---|---|---|---|
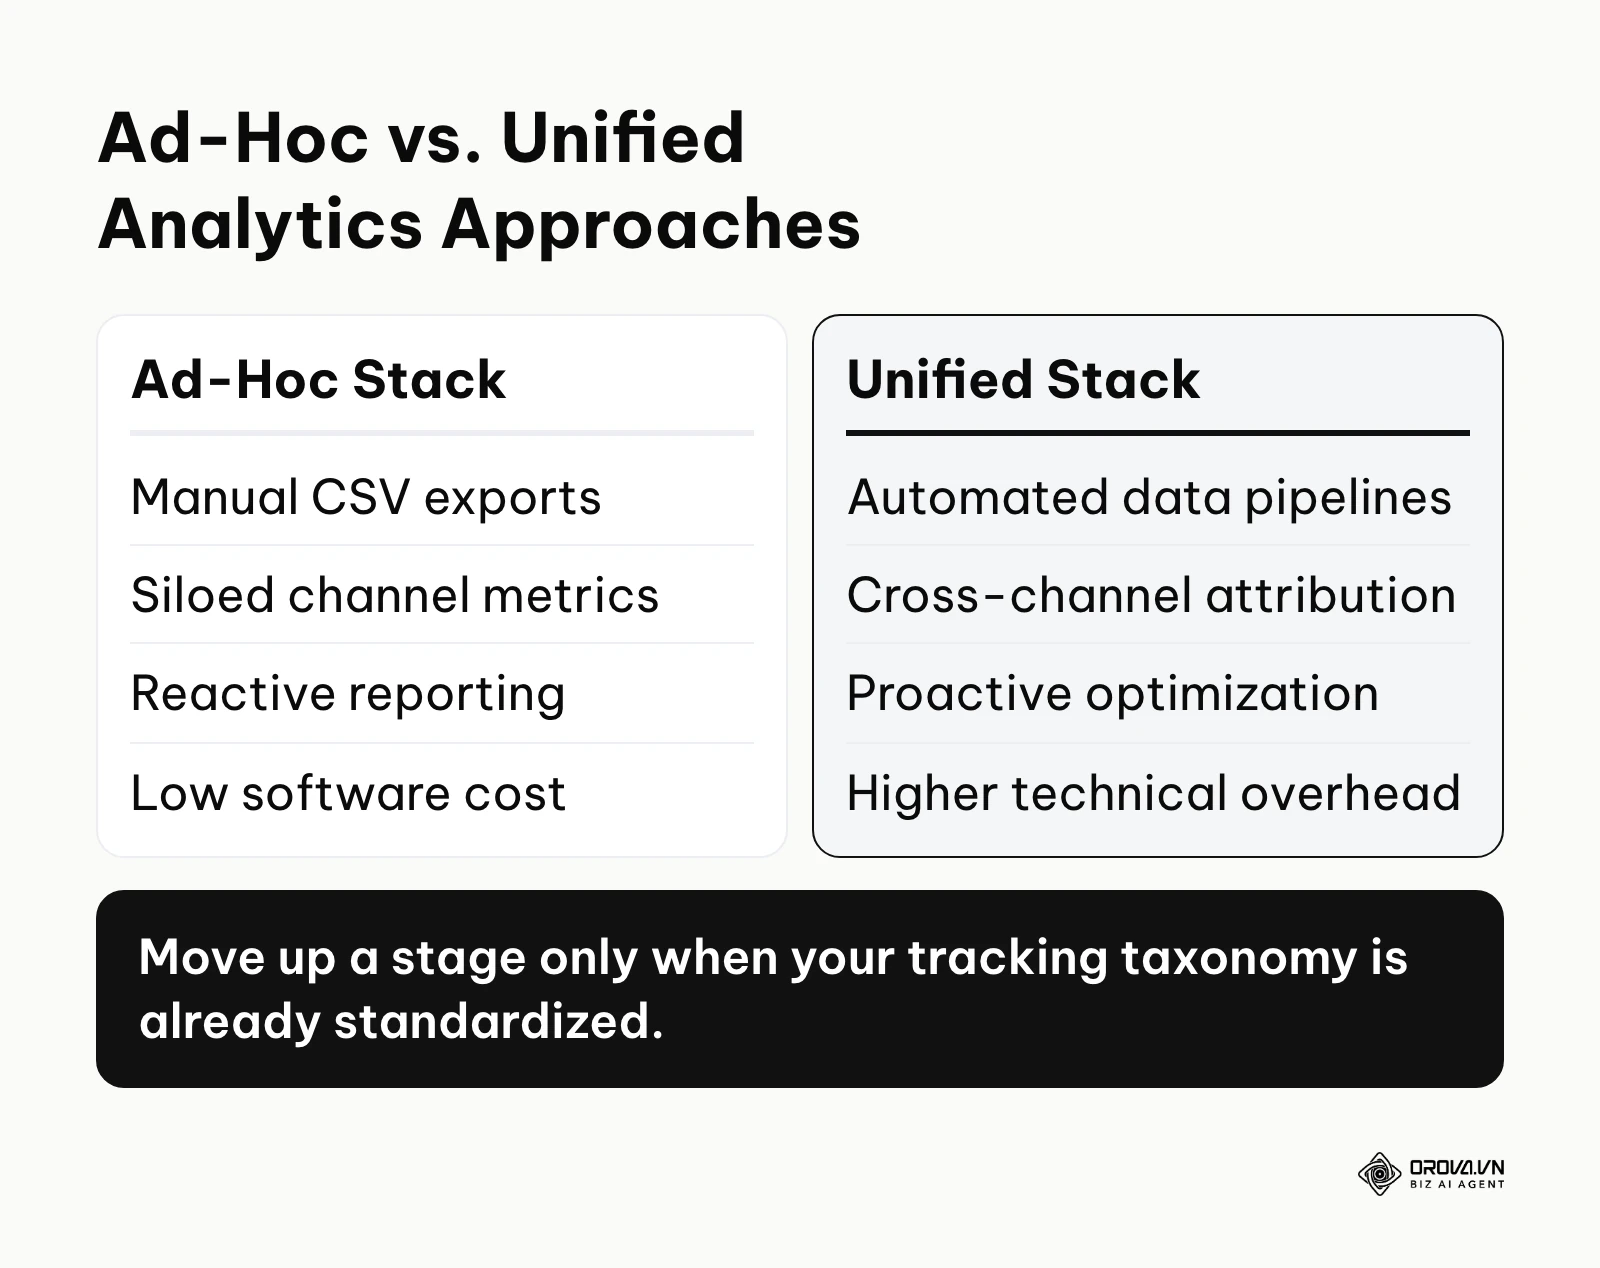
| Ad-Hoc Analytics | Startups, Solo entrepreneurs | Native platform reporting, manual CSV exports. | Highly susceptible to human error and data silos. |
| Connected Hub | SMBs, Growing agencies | Direct API integrations, Zapier/Make, standardized UTMs. | Struggles with complex cross-channel attribution. |
| Unified Warehouse | Mid-market, High-volume e-commerce | Cloud data warehouse, ETL pipelines, dedicated BI tools. | Requires significant engineering bandwidth to maintain. |
| Predictive Engine | Enterprise, Advanced tech firms | Real-time CDPs, custom machine learning models. | Enormous financial cost and complex data governance requirements. |
Your choice of tools should strictly follow your maturity stage. Purchasing an enterprise-grade CDP when you do not yet have a standardized tracking taxonomy is a recipe for expensive failure. Always evaluate whether a new tool simplifies the data flow or merely adds another layer of complexity.
Measuring the Impact of Data Driven Marketing
You cannot manage what you do not measure. The transition to a data-centric approach must be quantified to justify the investment in infrastructure and talent. However, looking at the wrong metrics can lead you astray. You must move away from vanity metrics—like total impressions or social media likes—and focus rigorously on unit economics and business outcomes.
To accurately measure impact, you must establish clear baseline metrics before implementing major changes. You need to look at both the macro level (overall profitability) and the micro level (campaign efficiency). The key is to monitor the relationship between the cost to acquire a user and the revenue they generate over time, ensuring that your conversion rate optimization efforts are translating into actual bottom-line growth.
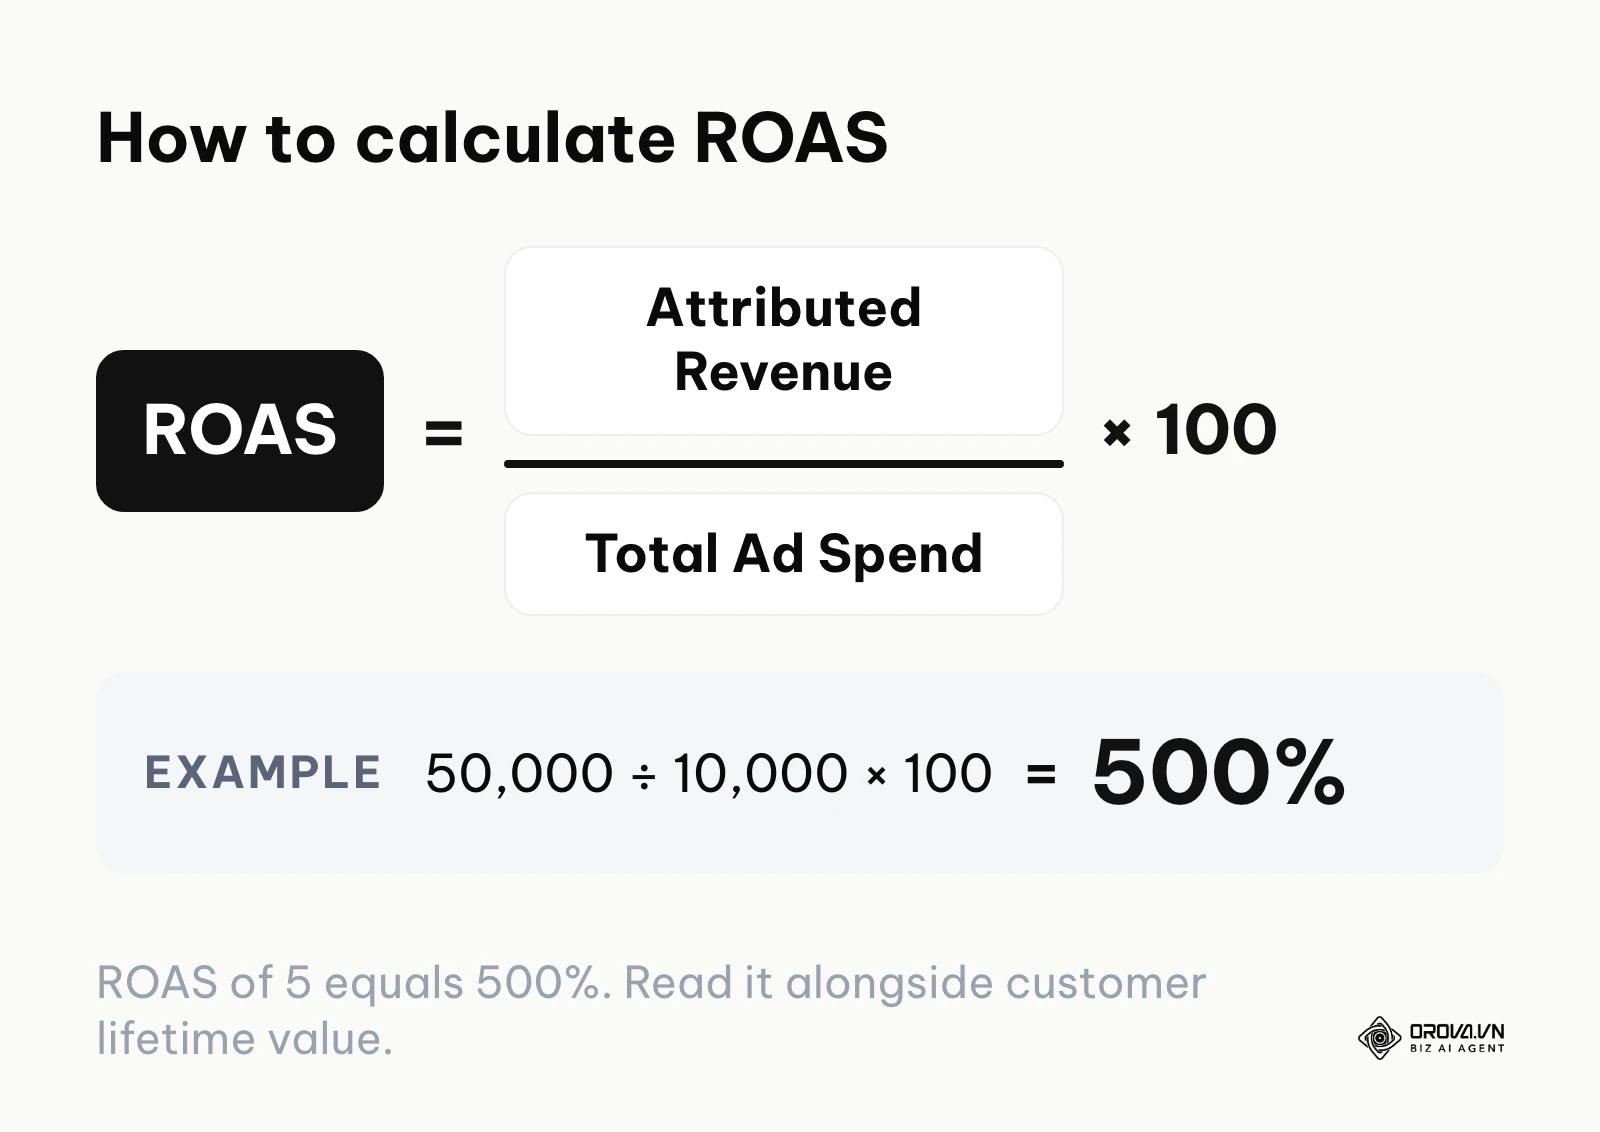
Return on ad spend is the simplest place to start. Divide attributed revenue by total ad spend: 50,000 in attributed revenue on 10,000 of ad spend gives a ROAS of 5, or 500%. Our ROAS formula guide walks through the variations and the pitfalls of attribution.
| Metric | Meaning in Context | Warning Threshold |
|---|---|---|
| Customer Acquisition Cost (CAC) | Total marketing spend divided by new customers acquired. | When CAC exceeds 33% of the Customer Lifetime Value. |
| Return on Ad Spend (ROAS) | Revenue generated directly from specific advertising efforts. | When ROAS drops below your gross margin break-even point. |
| Data Match Rate | The percentage of offline or CRM records successfully matched to online profiles. | Consistently below 40%, indicating poor data quality or formatting. |
| Time to Insight | Hours required for the team to generate an actionable campaign report. | Taking more than 24 hours to identify a critical campaign failure. |
Common Mistakes in Data Driven Marketing
Even teams with the best intentions and the largest budgets can fail if they fall into common traps. Data is merely an instrument; executing a strategy flawlessly requires avoiding these frequent operational pitfalls.
Collecting Data Without a Purpose
Many companies hoard massive amounts of customer information simply because they can. They track every click, scroll, and hover without any plan for how to use that information. This not only increases storage costs and slows down website performance but also creates significant liability under privacy laws. The consequence is "analysis paralysis," where analysts drown in noise. The fix is strict data minimization: before deploying any tracking tag, you must document exactly which business decision that specific metric will inform.
Ignoring Data Hygiene and Governance
If you allow users to input "US," "USA," "U.S.A.," and "United States" into your CRM country field, your geographic segmentation will be broken from day one. Poor data hygiene leads to inaccurate personalization, where you might email a discount to someone who purchased at full price yesterday. The fix is implementing strict input validations on all forms, scheduling regular automated data cleansing routines, and establishing a single point of authority for naming conventions.
Over-Relying on Last-Click Attribution
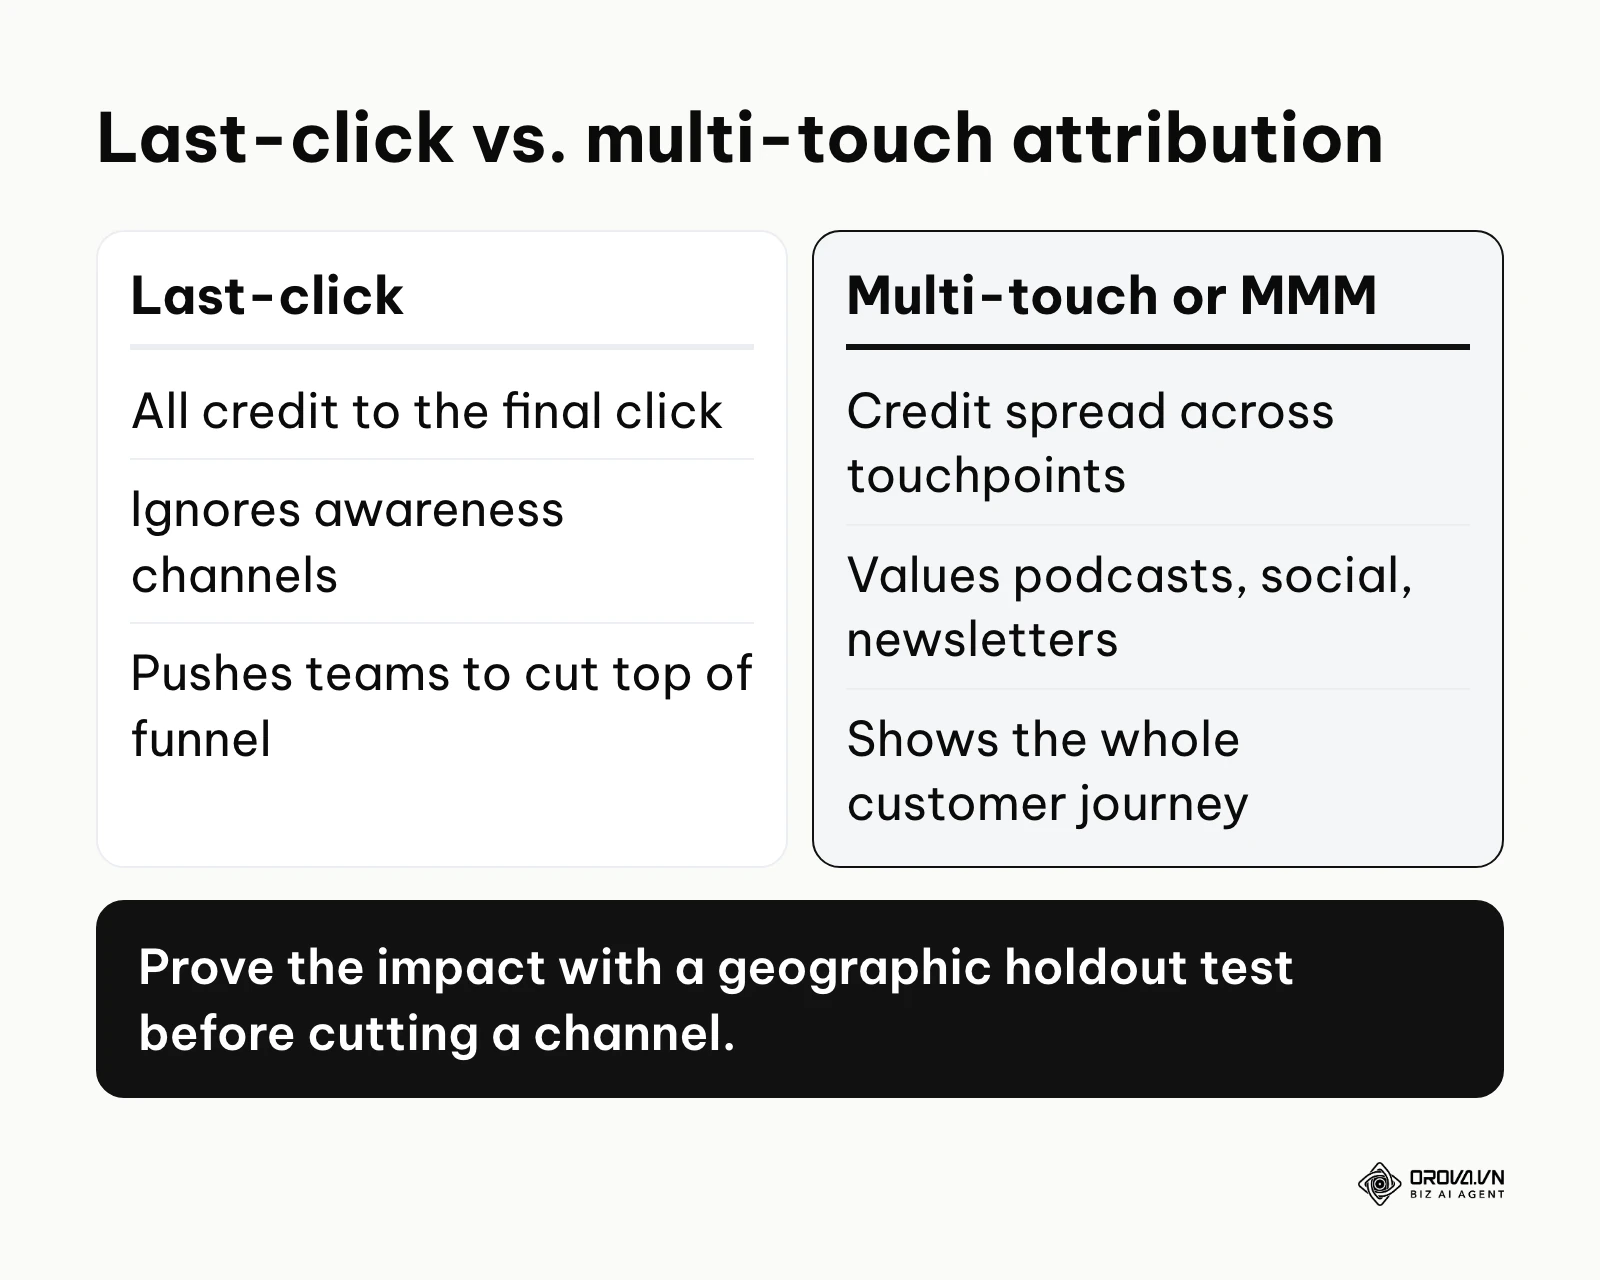
Attributing 100% of the conversion value to the last link a user clicked before buying severely distorts reality. It ignores the brand awareness generated by a podcast ad or the trust built by a well-timed newsletter. This mistake causes teams to defund top-of-funnel channels, eventually starving the bottom of the funnel. The fix is adopting multi-touch attribution models—or increasingly, marketing mix modeling (MMM)—to understand the holistic impact of the entire customer journey.
Illustrative example:
- Context: A SaaS startup where the marketing manager analyzed data showing that Google Search Ads drove 90% of conversions on a last-click basis, prompting them to cut Facebook Ads entirely.
- Actions Taken: Within two months, search conversions plummeted. The manager realized Facebook was generating the initial brand awareness. They implemented a linear attribution model to spread credit across all touchpoints.
- Hurdles and Fixes: The leadership team resisted the change because linear attribution made search ads look less profitable. The manager ran a geographical holdout test (turning off Facebook in one region only) to definitively prove the multi-channel impact.
- Visible Results: The holdout test showed a clear 25% drop in total regional sales without Facebook, convincing leadership to restore top-of-funnel funding based on holistic data rather than siloed last-click metrics.
Failing to Adapt to Privacy Regulations
Ignoring the shift towards strict data privacy is a fatal error. Relying entirely on unauthorized third-party scraping or ignoring consent banners will result in severe legal penalties and a complete collapse of tracking capabilities when browsers update their protocols. The consequence is operating totally blind. The fix is proactively building a robust First-party data strategy, implementing proper consent management, and learning to model data for the users who opt out of tracking.
Letting Tools Dictate the Strategy
A massive mistake is purchasing an expensive, complex marketing platform and then trying to reverse-engineer a strategy to justify the cost. Teams end up altering their perfectly good workflows to fit the rigid structure of the new software. The fix is defining your precise strategic requirements, your required integrations, and your team's technical capabilities first, and only then evaluating software that seamlessly fits that defined architecture.
Isolating the Data Team from Creatives
When data analysts sit in a separate room from the copywriters and designers, you get technically perfect campaigns with terrible, robotic messaging. Data should fuel creativity, not stifle it. If the analysts only deliver spreadsheets instead of actionable narratives, the creative team will ignore them. The fix is forcing cross-functional collaboration, ensuring that every creative brief is backed by behavioral insights, and requiring analysts to explain the "why" behind the numbers.
Stop guessing your return on investment and start deciding from unified metrics. Orova Insight lets you define your own metrics, schedule recurring reports, and share dashboards with permissions or present them live to your team. Sign up and start consolidating your performance data today, free until July 7, 2027.
Where data driven marketing is heading in the next few years: the author's take
As we look toward the evolution of the digital landscape, the way we collect, process, and activate information will undergo a radical transformation. Based on the shifts I am seeing today, here is my personal read on where the industry is heading.
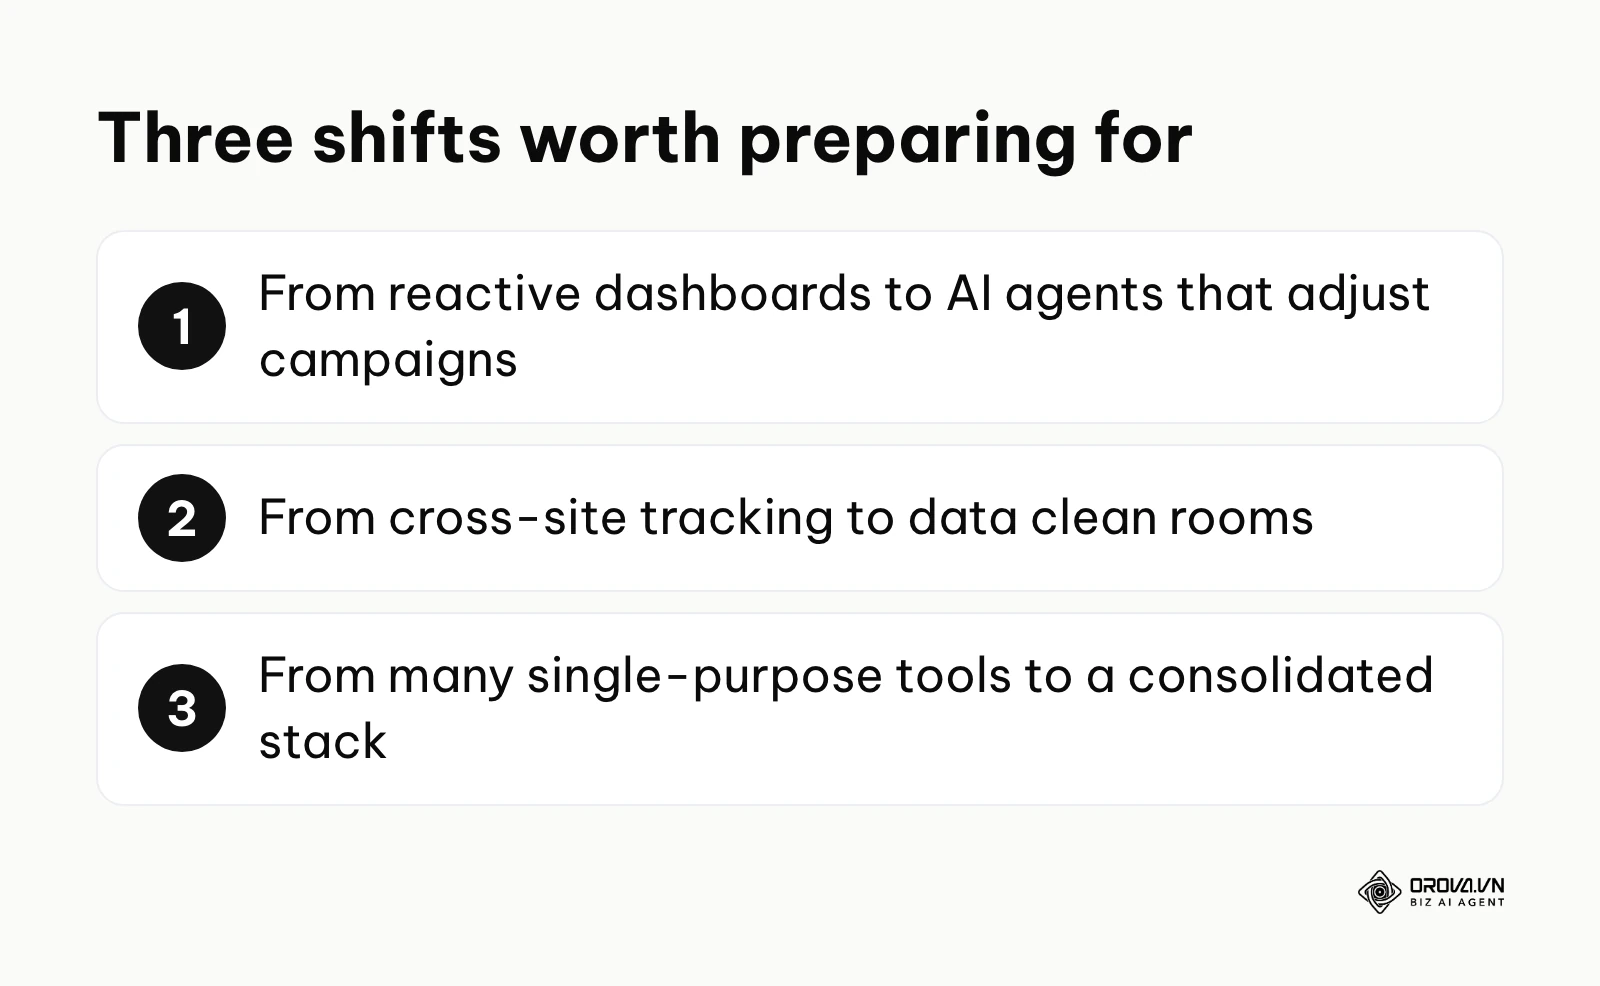
The Shift from Reactive Analytics to Proactive AI Orchestration
Currently, most marketing teams use dashboards to look backward—analyzing what happened last week to adjust next week's budget. I think that over the next few years, AI will start to flip this dynamic. Instead of humans interpreting every chart, AI agents are likely to monitor incoming data and suggest or make small adjustments to bidding, creative rotation, and channel allocation much faster than a weekly review allows. Marketers should prepare by shifting their focus from manual execution to defining the strict boundaries, governance rules, and overarching logic that will guide these autonomous systems. If my assessment is wrong, it will likely be because the black-box nature of AI causes critical brand safety failures, forcing platforms to return control to human operators.
The Rise of Decentralized Data Clean Rooms
With several browsers already restricting third-party cookies and privacy regulations tightening in many markets, traditional cross-site tracking keeps getting less reliable. My read is that more brands will turn to data clean rooms—secure, encrypted environments where multiple companies (like a brand and a publisher) can cross-reference their First-party data sets without ever exposing personally identifiable information. To prepare, organizations must aggressively prioritize building their own robust First-party databases today; if you do not have your own rich data to bring to the clean room, you will be locked out of advanced partnership targeting entirely.
The Consolidation of the Marketing Technology Stack
For the past decade, the trend has been proliferation: buying a separate tool for email, another for social, another for analytics, and trying to stitch them together. My read is that the market is moving toward consolidation. The friction of maintaining complex API connections and dealing with broken data pipelines is becoming too costly. I expect more businesses to gravitate toward unified, all-in-one platforms that handle the entire lifecycle natively. You should prepare by auditing your current stack and actively looking to ruthlessly eliminate redundant tools that only serve a single, isolated function.
Frequently Asked Questions
How much data is actually required to start predictive marketing?
You do not need millions of records to begin, but you do need statistical significance and stability. For standard machine learning models on ad platforms to predict accurately, you generally need a minimum of 50 to 100 conversions per week, per campaign. If your data volume is lower, the models will struggle to find patterns and will operate erratically.
How can a small business with no budget start being data-driven?
Start with strict discipline, not expensive software. Focus on defining a rigorous UTM parameter naming convention so your traffic is perfectly categorized in Google Analytics. Use free tools like Google Sheets to manually combine your weekly ad spend data with your CRM pipeline data. The goal is to build the habit of cross-referencing metrics before spending money on automated data warehousing.
What is the role of AI in a data driven marketing strategy?
AI acts as the processing engine that scales human capability. While humans define the strategic goals and creative boundaries, AI excels at identifying hidden patterns in massive datasets, segmenting audiences in real-time, and automatically generating insights from raw numbers. It transforms data analysis from a weeks-long manual project into an instant, conversational query.
How do we handle historical data that is completely unorganized?
Do not attempt to clean years of terrible historical data all at once; the ROI on that effort is usually negative. Instead, draw a line in the sand. Establish strict data governance rules for all new incoming data starting today. Once your forward-looking data pipeline is clean and functional, you can systematically backfill and clean historical records based on specific, high-priority analytical needs.
How does this approach impact content planning?
A data-driven approach fundamentally changes how you create assets. Instead of brainstorming topics based on internal assumptions, you use search intent data, historical engagement metrics, and audience feedback to shape your content calendar, ensuring every piece of content maps directly to a proven audience need.
Why is there so much discrepancy between my ad platform and my website analytics?
Discrepancies are normal and stem from different tracking methodologies. The numbers you see in Facebook Ads Manager often rely on view-through attribution and its own pixel logic, while web analytics platforms typically rely on click-based, session-level tracking. Understanding these differing models is crucial to finding the objective truth in the middle.
Where to start?
Reading about omnichannel strategies and predictive models can feel overwhelming, especially if your current setup is chaotic. The key is to start small and focus on immediate visibility rather than attempting a massive infrastructure overhaul on day one. Determine which of the following situations best describes your current reality and execute the single corresponding action.
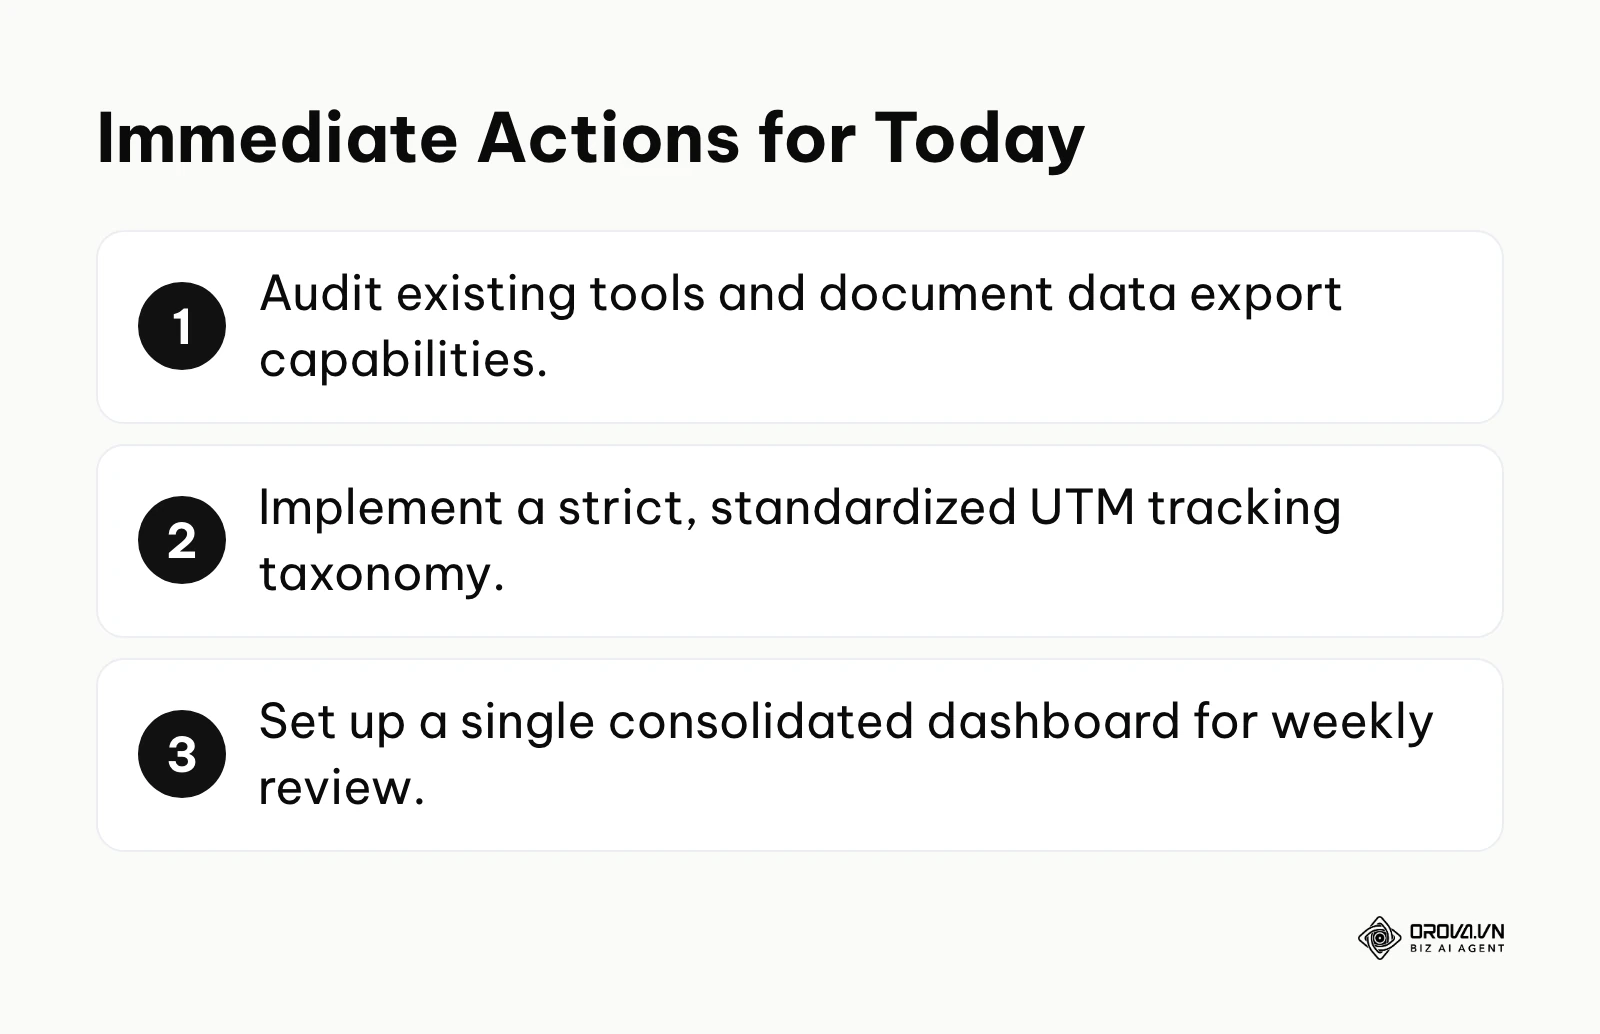
If your data is scattered across multiple native platforms: Your immediate priority is establishing a centralized view. Dedicate one afternoon to auditing every platform you use (Meta, Google, CRM, Email). Document exactly what metrics each platform provides and export the last 30 days of core performance data into a single, standardized spreadsheet to force yourself to look at the numbers side-by-side.
If your team uses inconsistent tracking links: You must fix your data inputs before worrying about the outputs. Create a master document defining your organization's strict UTM parameter rules (e.g., standardizing whether you use "facebook" or "fb" as the source). Enforce a rule that no campaign goes live unless the links are generated through this master tracking framework.
If you have clean data but spend hours reporting manually: It is time to automate the visualization. Choose one key stakeholder report—like the weekly executive summary—and connect those specific data sources to an automated dashboarding tool. Focus on displaying only the top 5 critical metrics that drive actual business decisions, eliminating the manual copy-pasting process entirely.
The transition to data driven marketing is continuous. By implementing these foundational steps, breaking down silos, and maintaining rigorous data hygiene, you build an agile operation capable of turning complex customer interactions into sustained competitive advantage.
About the author

Builder of Orova
Nguyễn Đỗ Trọng Ân has 8 years of experience in marketing, including 6 years managing market development across Asia. He builds Orova, a Biz AI Agent that never sleeps: it plans, runs and optimizes work for businesses.
Run your business with AI Agents
Orova is the always-on Biz AI Agent — it plans, runs, and optimizes the work for you.
Save time, unlock productivity.