
How to measure website traffic: an actionable 6-step framework

When you first log into your newly created analytics dashboard, seeing a sudden spike in visitors feels incredibly rewarding. However, that initial excitement quickly fades when you check your sales platform and realize your total revenue remains completely unchanged. This frustrating disconnect happens because most traditional guides only teach you to install a basic script and stare at raw pageviews. They treat your own internal analytics and your external competitor intelligence as two entirely separate disciplines, leaving you with incomplete information. If you want to measure website traffic accurately, filter out the automated noise, and turn those complex numbers into profitable business decisions, you need a completely different approach. In short: install one analytics property through a tag manager, filter out bots and internal visits, track conversions as events, compare your numbers with competitor estimates, and turn every finding into a specific action. This guide walks you through that framework step by step.
What It Means to Measure Website Traffic
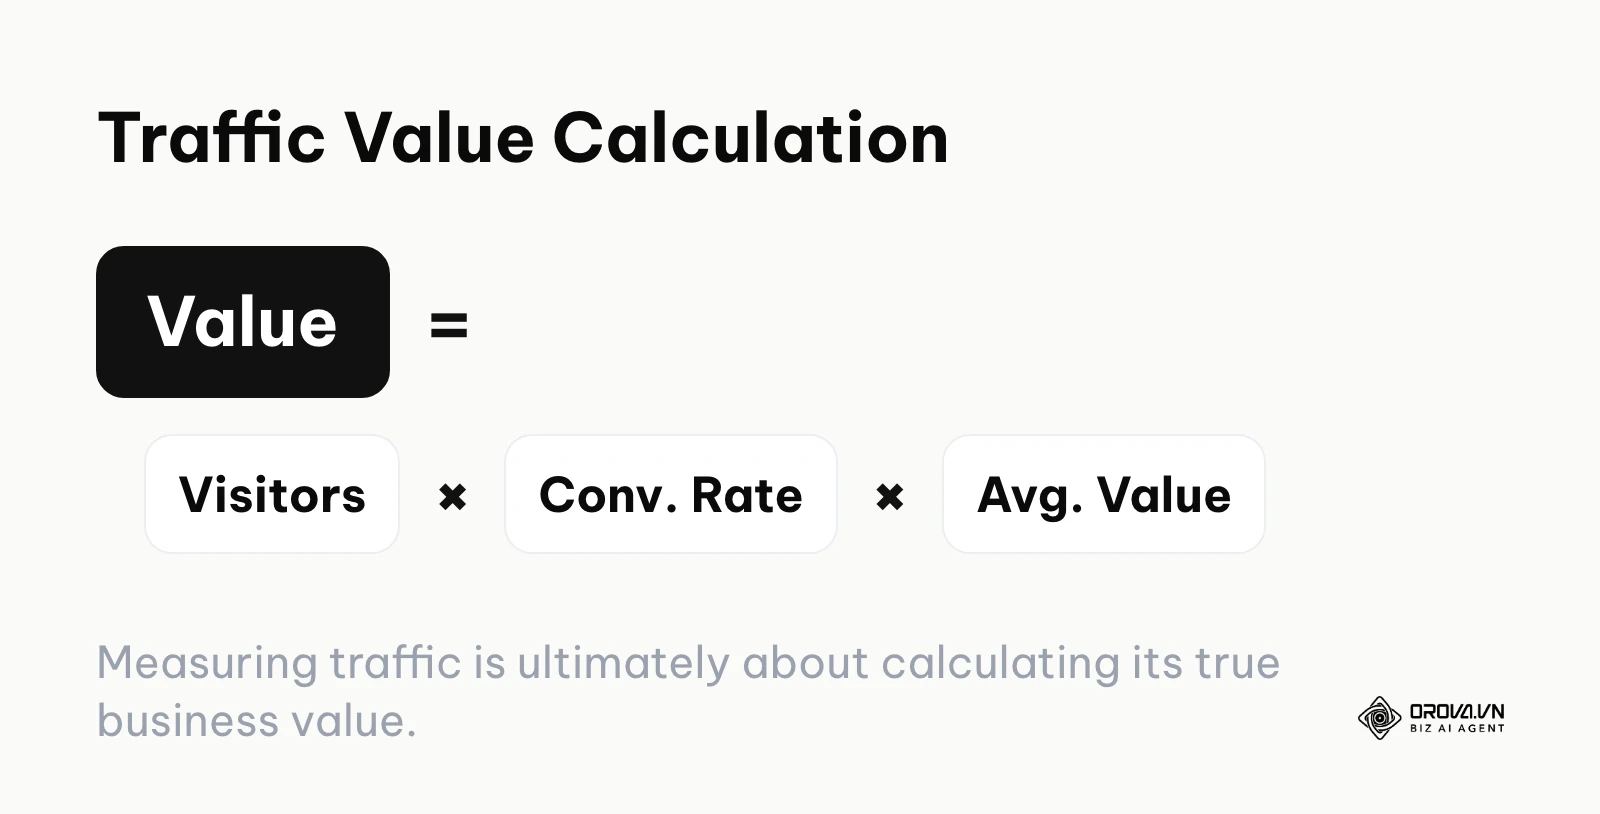
To measure website traffic means actively tracking how many people visit your site, identifying exactly where they come from, and understanding what specific actions they take before they leave. You do this to find out which marketing channels actually generate revenue and which ones waste your budget. A simple way to see the business value of a channel: value = visitors × conversion rate × average value per conversion. Anyone running a business website, an e-commerce store, or a lead generation page must do this thoroughly. You should not worry about advanced traffic measurement if your site is just a personal journal with no financial goals.
What You Need Before You Measure Website Traffic
Before you dive into complex dashboards and intricate reporting tools, you need to establish a solid baseline. Gathering data without a proper structure will only lead to confusion and incorrect assumptions. Many beginners rush to install the first piece of code they find, resulting in duplicated data and broken conversion tracking. You need to prepare a specific set of tools and documents before you write a single line of tracking code.
The preparation phase is critical because it dictates how clean your data will be moving forward. If you skip this, you will spend months looking at corrupted metrics, wondering why your paid ad reports do not match your actual bank deposits. You need administrative access to your website, a clear understanding of your business objectives, and a list of competitors to benchmark against.
| Required Item | Where to Get It | Estimated Time Needed |
|---|---|---|
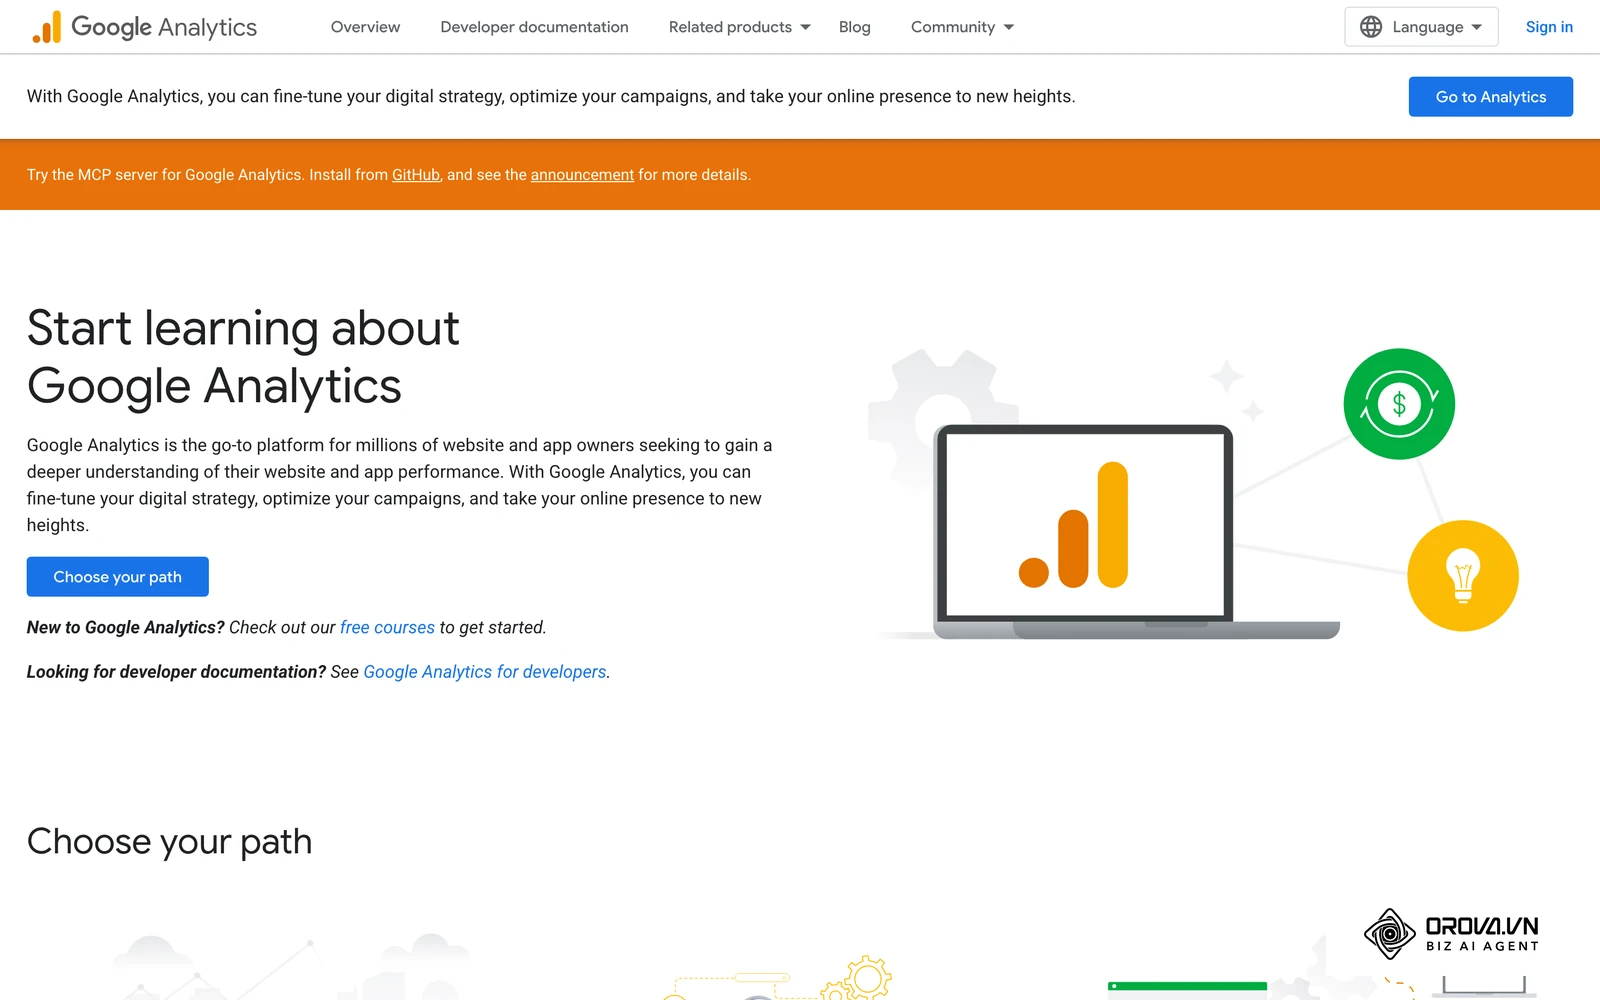
| Primary Analytics Property | Google Analytics platform | 10 minutes |
| Tag Management System | Google Tag Manager | 15 minutes |
| List of Direct Competitors | Your sales or marketing team | 20 minutes |
| Defined Conversion Goals | Your overall business plan | 30 minutes |
| Website Administrative Access | Your IT department or hosting provider | 5 minutes |
You must secure administrative access to your website's header code or content management system. Without this, you cannot install the tag management container that holds all your future tracking scripts. Furthermore, defining your conversion goals before you start is non-negotiable. You need to know exactly what a successful visit looks like, whether it is a completed purchase, a newsletter signup, or a whitepaper download. Knowing your competitors allows you to set realistic expectations. If you know the industry leader gets ten thousand visits a month, you will not set an unrealistic goal of one million visits for your brand new site.
The 6-Step Actionable Framework to Measure Website Traffic
This framework bridges the gap between internal tracking and external benchmarking. By following these steps in order, you will build a robust system that not only tells you what is happening on your own site but also reveals how you stack up against the rest of your industry.
Step 1: Set Up Your Primary Analytics Engine
Your primary analytics engine is the central hub where all your internal data lives. For the vast majority of websites, this will be Google Analytics 4. You must install this properly to ensure every pageview and session is recorded accurately.
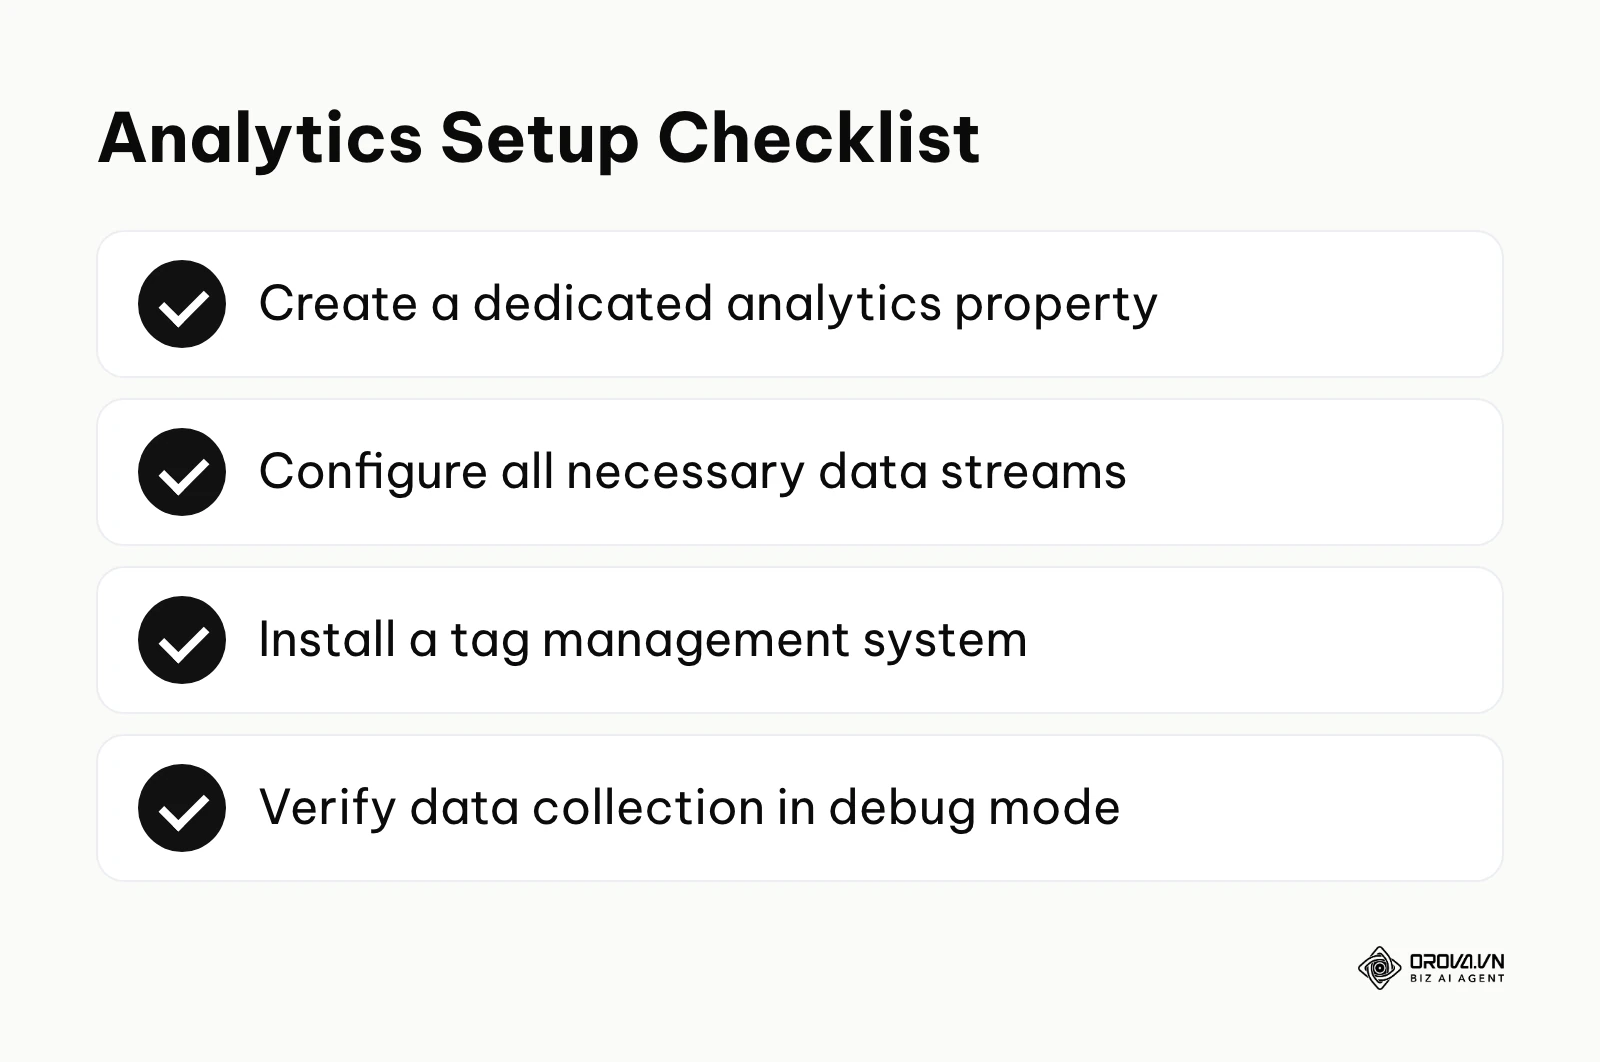
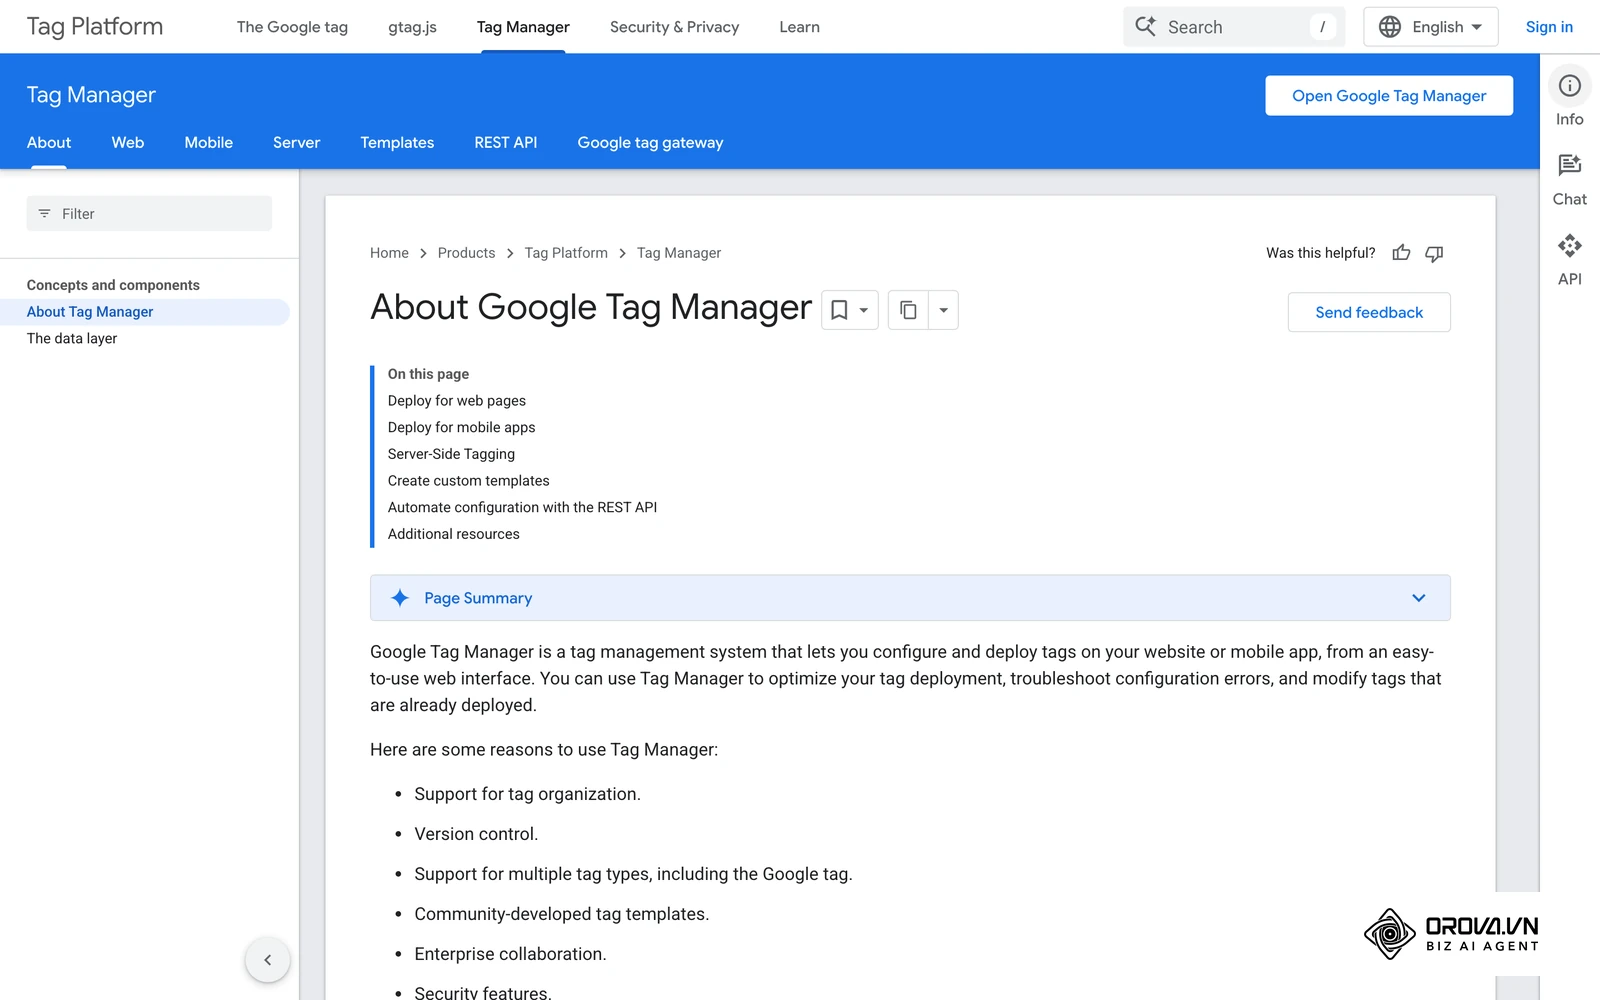
You need to create a dedicated property and link it to your site using a tag management system. Placing tracking codes directly into your website header is an outdated practice that makes future updates incredibly difficult and increases the risk of breaking your site's functionality. Instead, you will place one master container code on your site, and manage all subsequent tracking tags through a separate interface.
Here is the exact 10-step checklist you need to follow to set this up correctly:
- Navigate to the Google Analytics platform and create a new account for your business.
- Create a new Property within that account, selecting your correct time zone and currency.
- Set up a Web Data Stream by entering your exact website URL and stream name.
- Copy the unique Measurement ID provided at the end of the stream setup process.
- Open Google Tag Manager and create a new container for your website.
- Install the two provided snippets of container code into the head and body sections of your website.
- Inside the tag manager workspace, create a new tag and select the Google tag type.
- Paste your Measurement ID into the tag configuration field.
- Set the firing trigger to trigger on all pages.
- Publish your workspace changes and use the built-in debug mode to verify data is flowing.
The clearest sign that you have done this correctly is seeing your own active session appear in the real-time report within seconds of visiting your site. A common error at this stage is accidentally installing multiple instances of the tracking code, which will cause your system to record double pageviews and artificially inflate your numbers.
Step 2: Filter Out Bot Traffic and Spam
Once your engine is running, you will immediately start collecting data. However, a significant portion of this initial data is entirely fake. Automated programs constantly crawl the internet, and their visits will skew your metrics if left unchecked. You must remove these fake visits so your data reflects actual human behavior. Google Analytics 4 already excludes traffic from known bots and spiders automatically, but unknown bots and spam still slip through. Bot sessions usually show near-zero engagement time, a single pageview per session and visits concentrated in one unexpected location, while real visitors vary on all three.
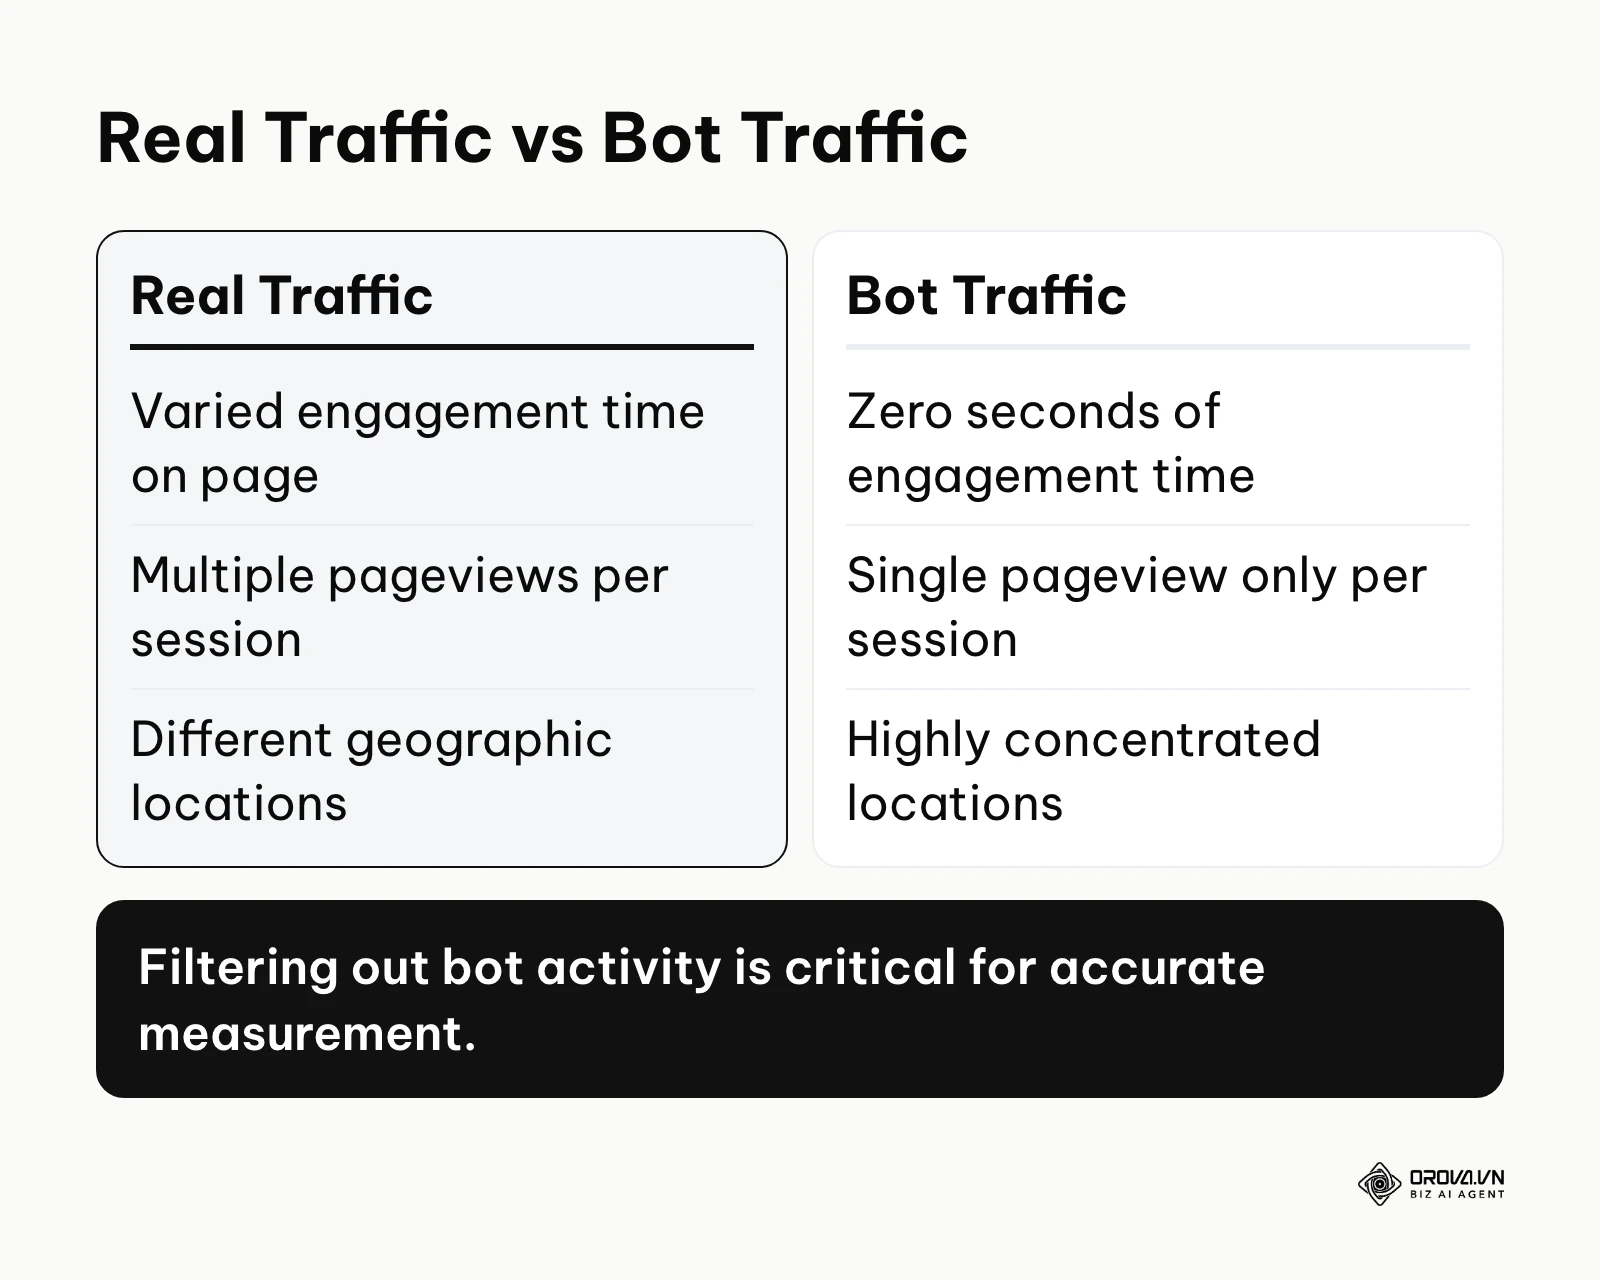
Bot traffic ruins your engagement metrics, inflates your pageviews, and makes your conversion rates look artificially low. To fix this, you need to configure specific filters within your analytics platform. The most fundamental step is excluding your own internal traffic. Every time you or your team members visit the site to check a typo or test a form, you are polluting the data.
You must identify the public IP addresses of your office and the home networks of your remote team members. Once you have these addresses, you navigate to the data stream settings in your analytics platform and define internal traffic rules based on those IP addresses. You then activate the internal traffic data filter in the property settings so that data matching those rules is excluded from your reports. Furthermore, you should identify known spam referral domains that appear in your acquisition reports and segment them out of your analysis so they do not distort your channel numbers.
The sign of success here is a slight, immediate drop in your total traffic volume, accompanied by a noticeable increase in your average engagement time and conversion rates. The most common error is forgetting to update your IP exclusion list when your company moves to a new office or changes internet service providers.
Step 3: Configure Conversion Tracking and Events
Basic pageviews tell you very little about business success. You need to configure specific event tracking to monitor the actions that actually matter to your bottom line, such as button clicks, form submissions, and video plays.
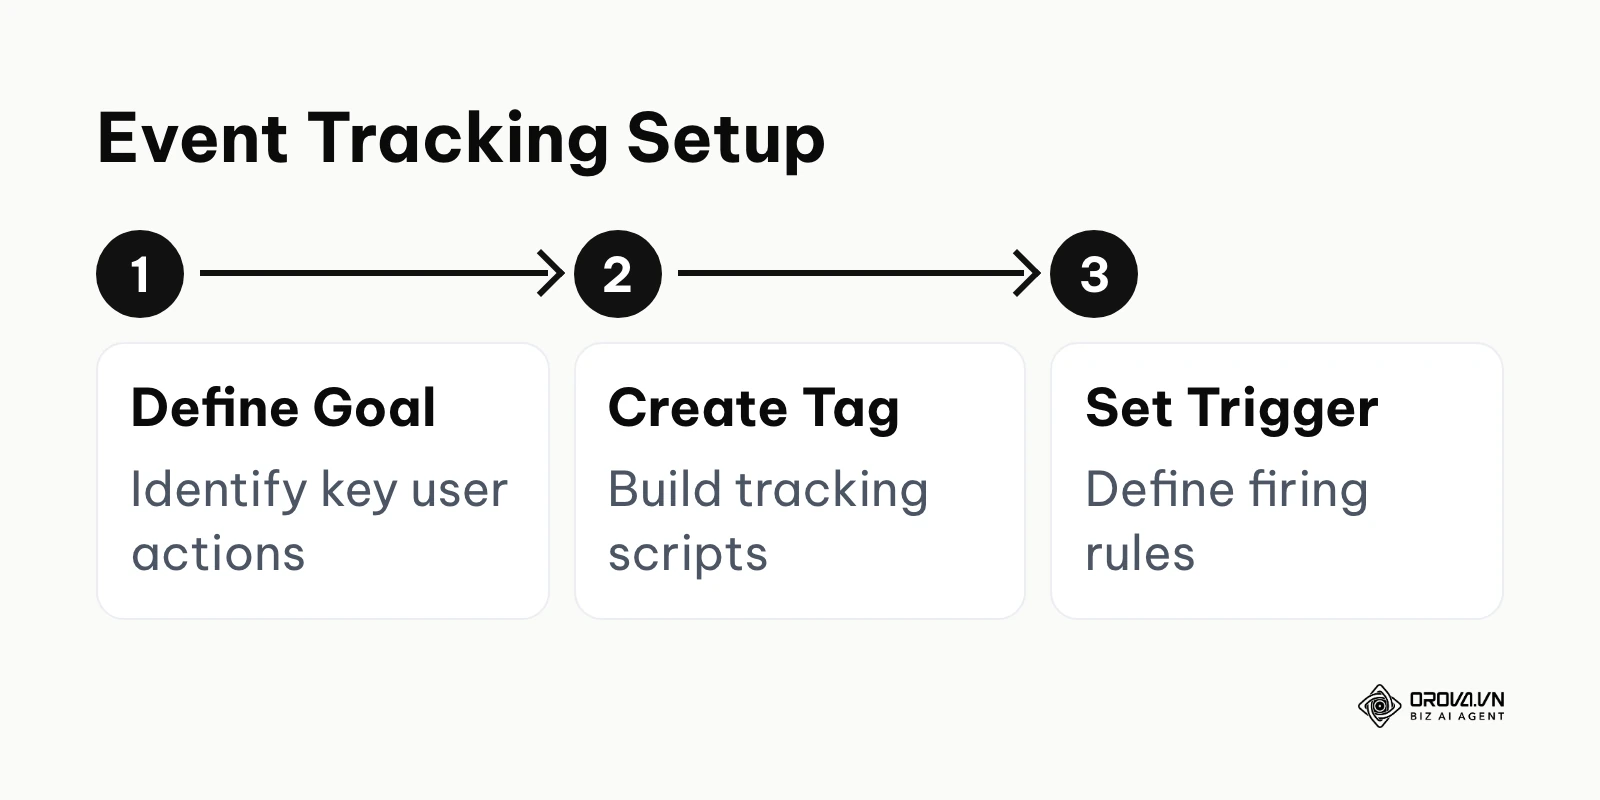
You achieve this by utilizing the data layer within your tag management system. Instead of relying on fragile URL changes, you instruct your system to listen for specific interactions. For external marketing campaigns, you must append specific parameters to your links to track exactly which ad or social post drove the visit. If you are running multiple campaigns, you need a systematic way to generate these links, which you can learn more about by utilizing a UTM builder tool.
When you track events, you must differentiate between micro conversions and macro conversions. A micro conversion might be a user scrolling halfway down a page, while a macro conversion is a completed purchase. You need to map both types of events to understand the full user journey. You should configure tags to fire only when specific conditions are met, ensuring accuracy. For instance, if you are struggling to monitor how users interact with specific page elements, you should review a comprehensive click tracking guide.
Illustrative example:
- Context: A mid-sized B2B software company employing 45 people needed to track whitepaper downloads to justify their quarterly marketing spend.
- Actions: First, they installed a centralized tag management system to handle all tracking scripts without developer intervention. Second, they created a specific trigger based on the backend form submission event rather than just tracking clicks on the submit button. Third, they mapped this specific event as a key conversion in their primary analytics dashboard.
- Blockers and Fixes: Initially, the form did not redirect to a thank-you page upon completion, causing the tag to fire even when users submitted completely empty forms. They fixed this significant issue by pushing a custom success event to the data layer only upon successful server-side validation.
- Visible Results: The marketing team generated a reliable dashboard showing that exactly 142 valid downloads came from one specific organic article, allowing them to confidently reallocate their budget toward producing similar technical content.
Step 4: Measure Competitor Website Traffic
Looking only at your own data is like running a race with a blindfold on. You need to find out how much traffic your rivals receive to understand your true market position and identify missed opportunities.
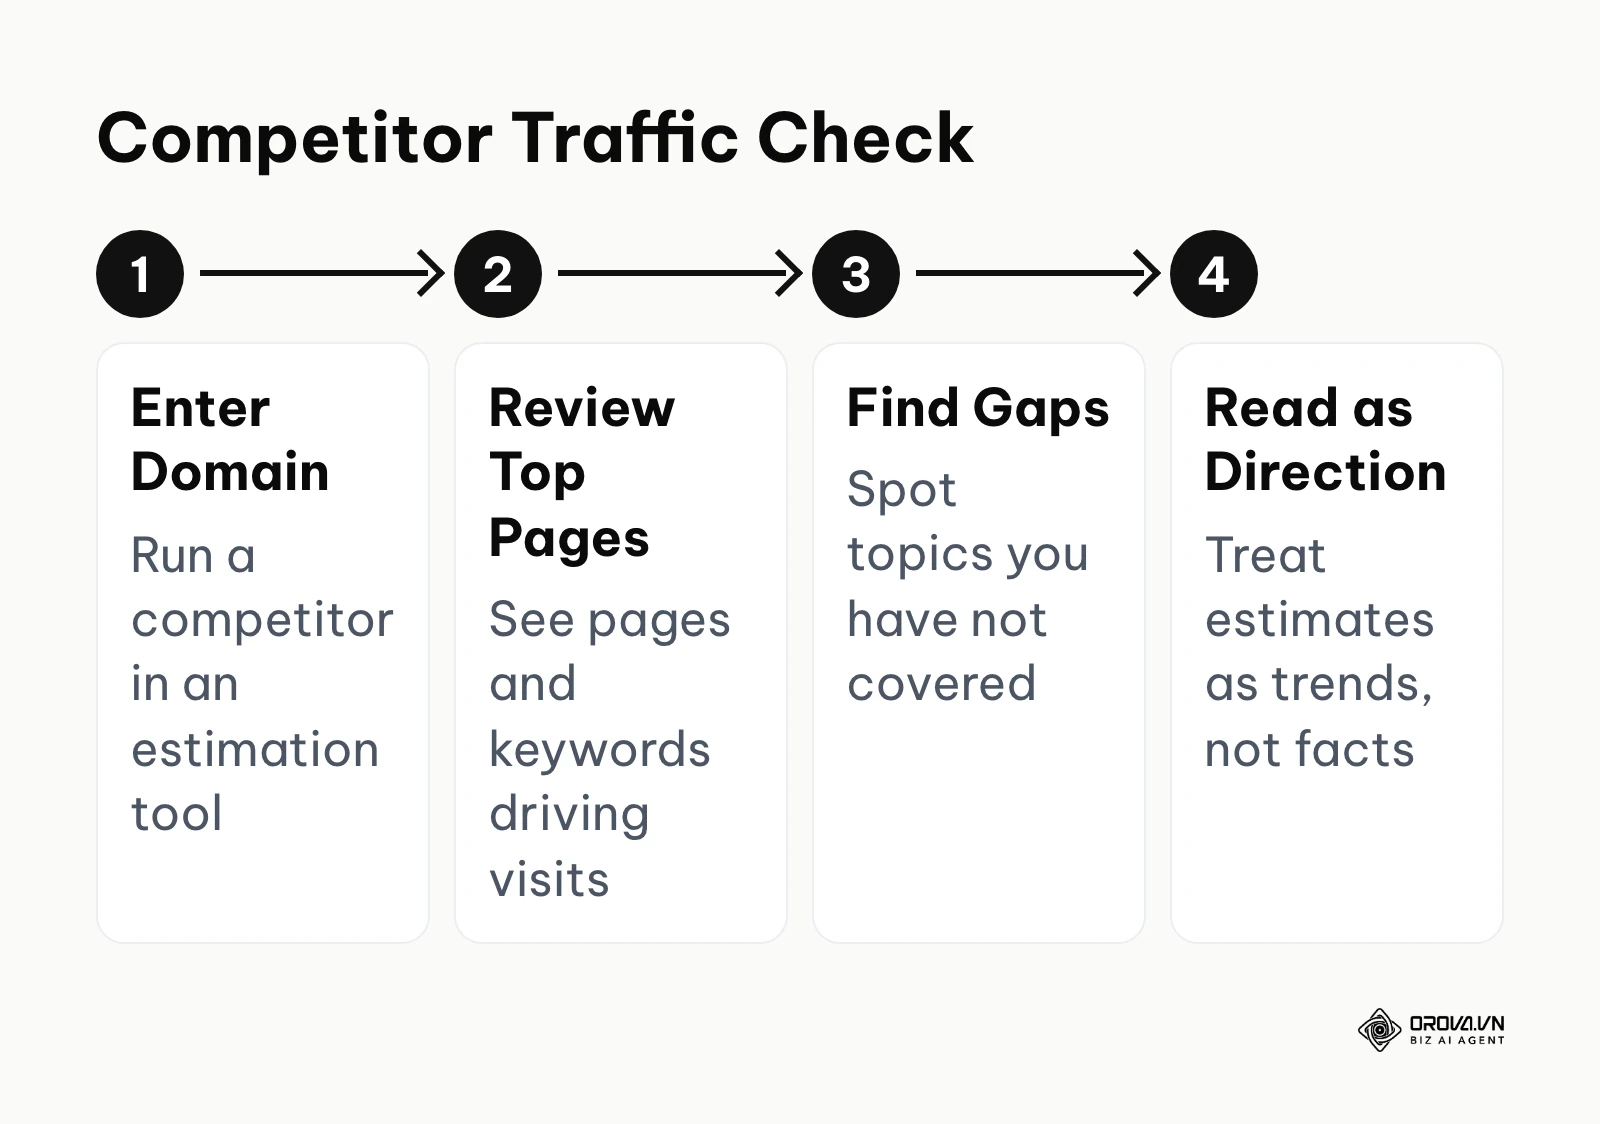
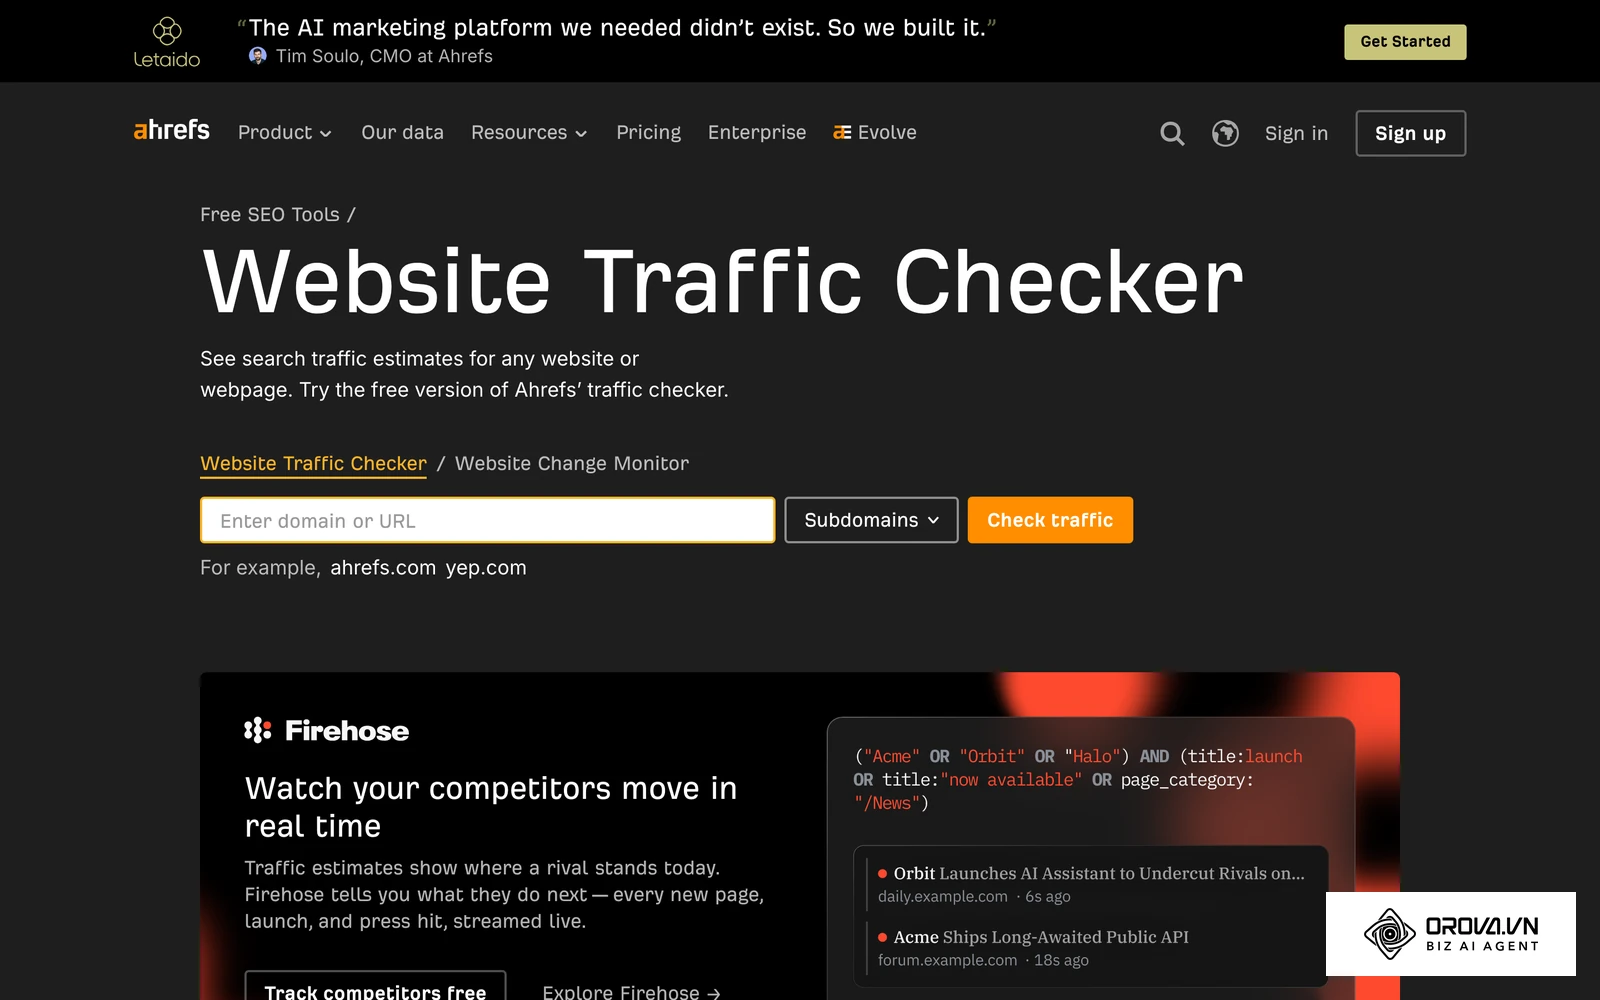
Because you do not have access to your competitors' internal analytics, you must use third-party estimation tools like Similarweb or Ahrefs. These tools combine clickstream panels, search ranking data and other modeled signals to estimate the volume and sources of traffic going to any given domain. You enter your competitor's domain name into the tool, and it generates a report showing their estimated monthly visits, their top performing pages, and the keywords driving the most organic search traffic.
By analyzing their top pages, you can conduct a content gap analysis. If a competitor is receiving massive traffic for a specific topic that you have not covered, you immediately know what your next content piece should be. If you notice they have technical advantages, you might need to run a deep analysis, similar to a comprehensive SEO audit case study, to figure out why they are outranking you.
The clearest sign of success is identifying a high-traffic keyword or referral source that your competitor dominates, which you previously did not know existed. The most common error in this step is assuming that third-party estimation data is completely flawless and treating it as absolute fact rather than directional guidance.
Step 5: Connect Internal Tracking with Competitor Benchmarks
Data becomes truly actionable when you connect your internal reality with external market conditions. You must compare your exact internal metrics against the estimated metrics of your competitors to calculate your share of voice.
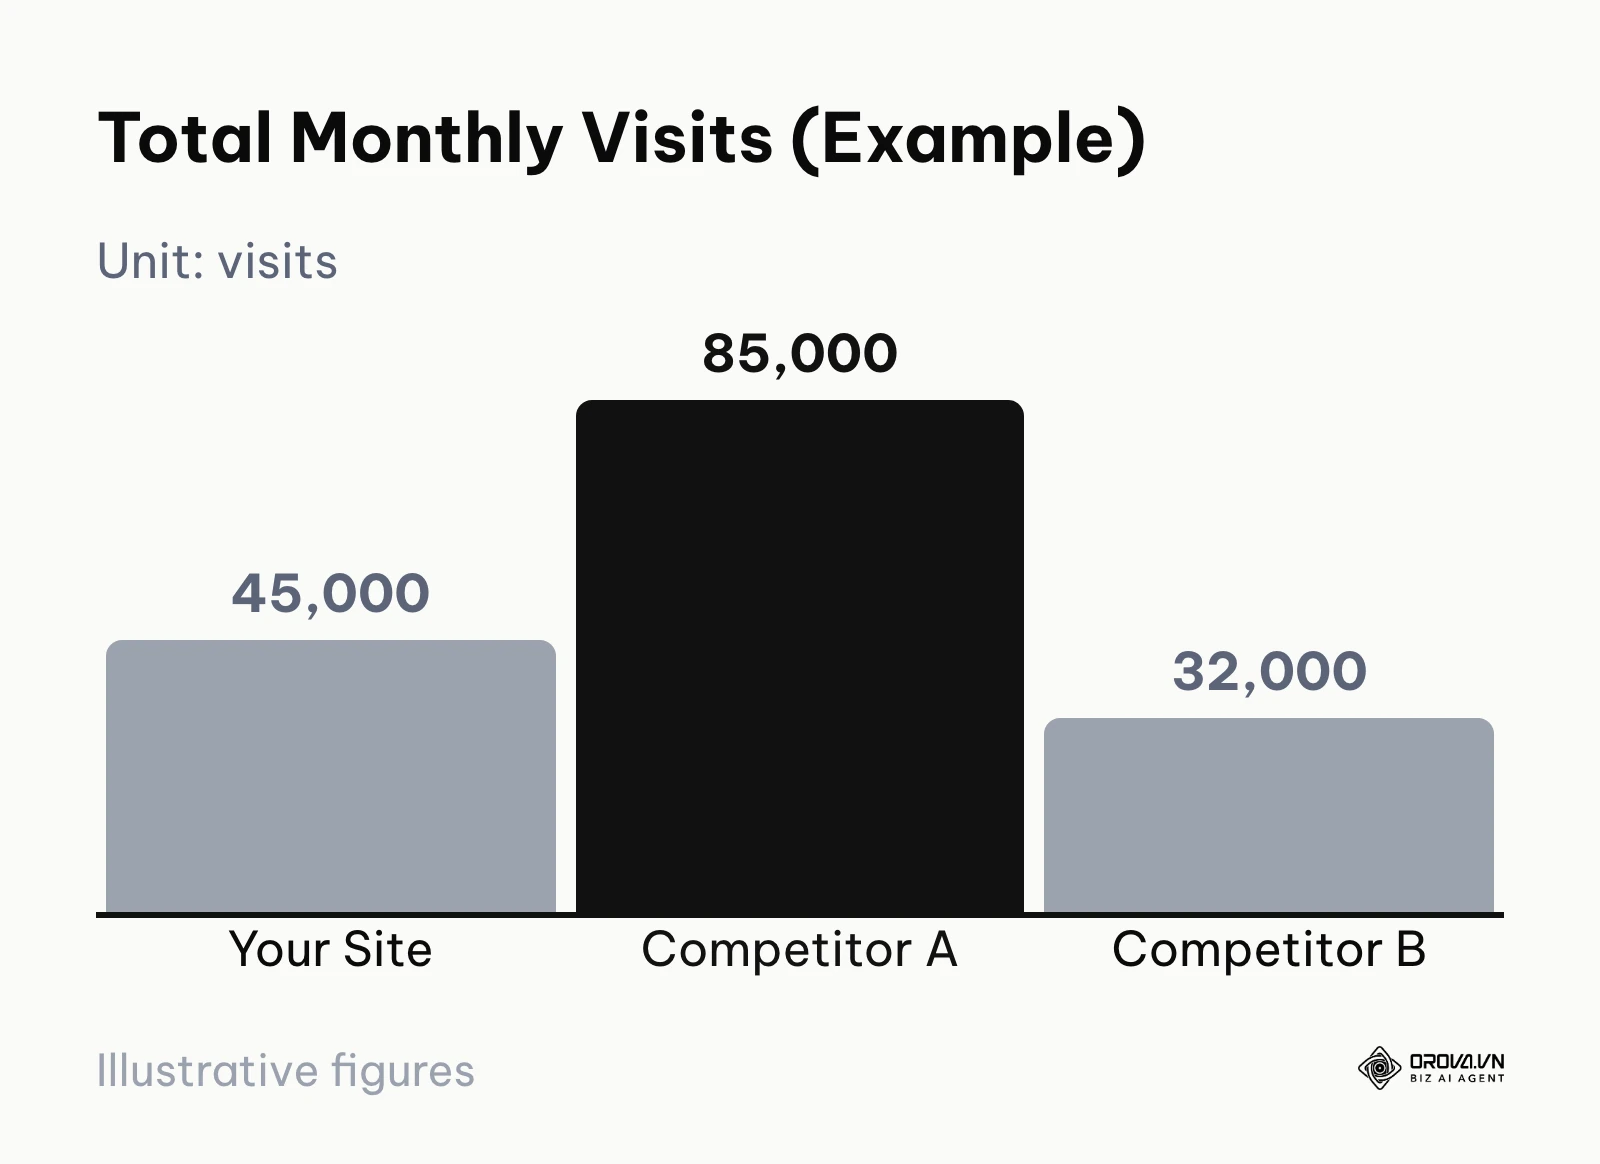
You achieve this by building a custom spreadsheet that blends data from both sources. This manual blending process forces you to look at the numbers critically rather than just glancing at a pre-built dashboard. You create columns for your top keywords, your actual traffic for those keywords, and your competitor's estimated traffic for the same terms.
Below is a spreadsheet template you can recreate to track your competitive performance (the values are example figures):
| Metric Category | Your Actual Data | Competitor A Estimate | Competitor B Estimate | Market Position |
|---|---|---|---|---|
| Total Monthly Visits | 45,000 | 85,000 | 32,000 | #2 |
| Organic Search Share | 60% | 40% | 75% | Strong |
| Direct Traffic Share | 20% | 45% | 15% | Weak |
| Top Performing Page | /pricing | /blog/guide | /features | N/A |
| Average Session Duration | 2m 15s | 3m 40s | 1m 50s | Needs Improvement |
The sign of success here is spotting glaring structural gaps in your strategy. For example, your spreadsheet might reveal that a competitor relies heavily on expensive paid ads while you are quietly winning the long-term organic search battle. The common error is comparing your exact, filtered internal numbers directly with their estimated numbers and panicking over minor discrepancies. You must look at the overall trends and percentages, not the raw absolute numbers.
Step 6: Turn Data into Actionable Insights
Collecting data is entirely pointless if it does not change how you operate your business. You must make strategic decisions based on the numbers you have gathered and connected.
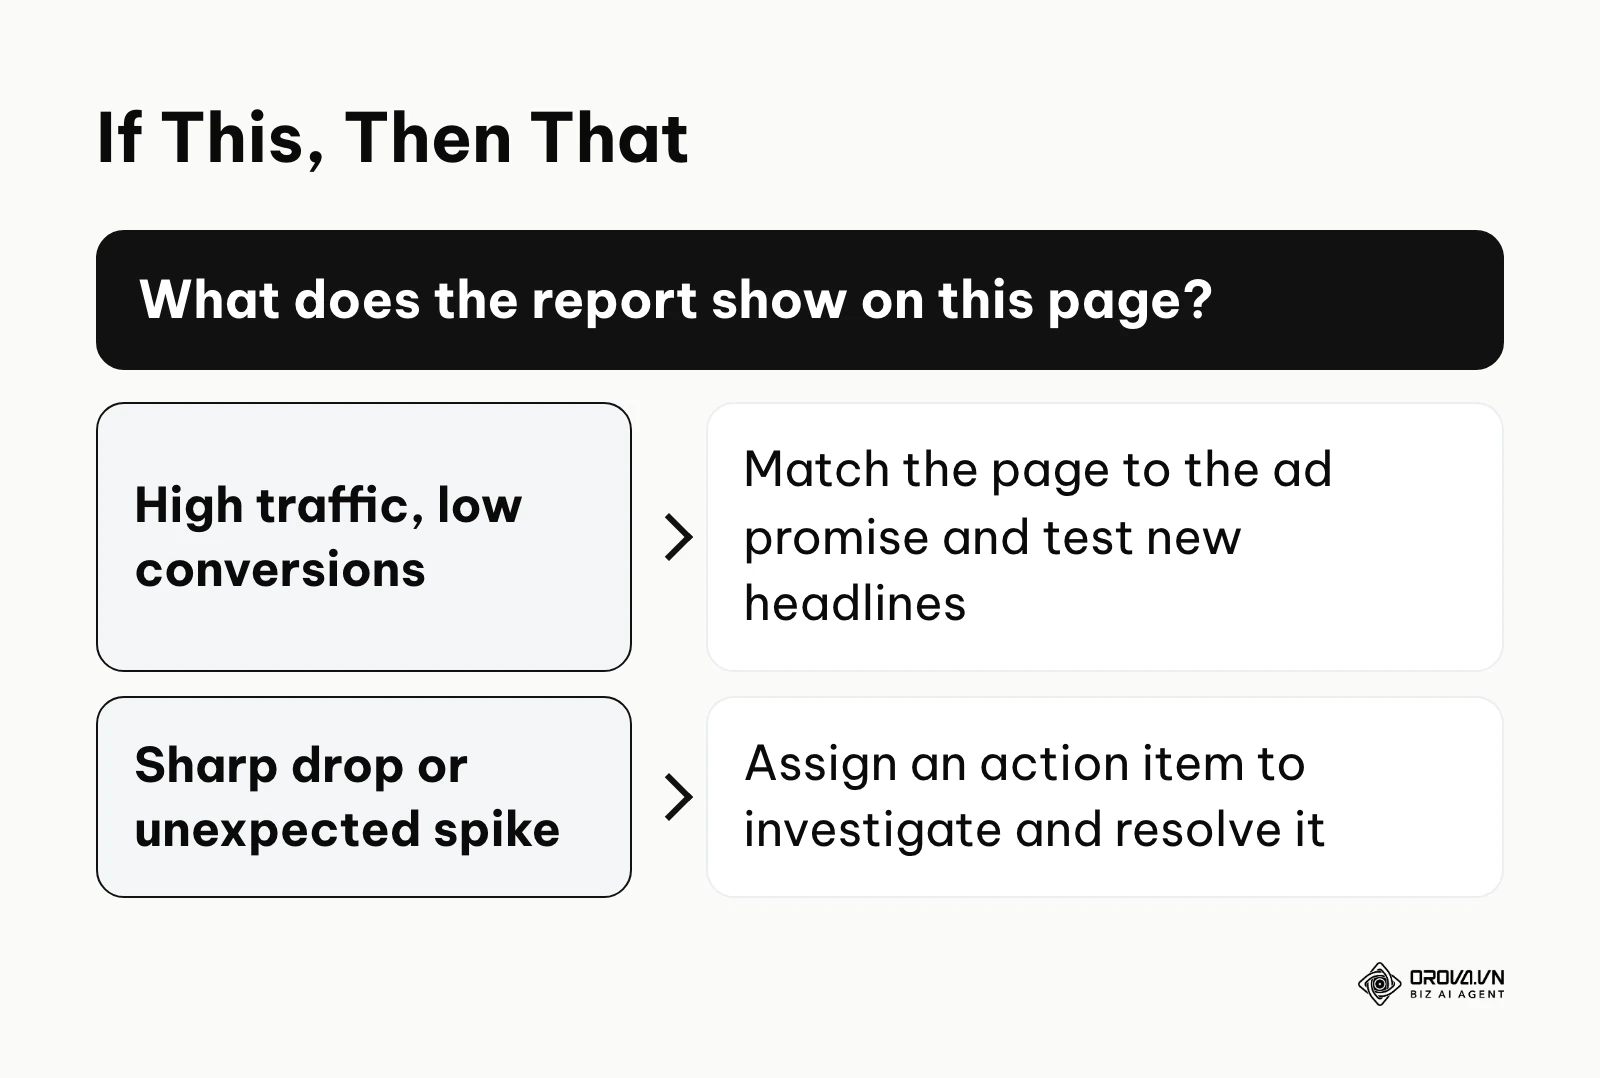
You do this by applying an "If This, Then That" logic framework to your reporting. You look for anomalies, sharp drops, or unexpected spikes, and immediately assign an action item to investigate and resolve them. For example, if you see high traffic but low conversions on a specific landing page, the data is telling you that the promise made in the ad does not match the content on the page. You then test new headlines or redesign the layout. If you need a structured approach to improving your visibility based on data, following a detailed website ranking roadmap can provide clarity.
Illustrative example:
- Context: An independent e-commerce retailer managing a catalog of 200 products wanted to understand exactly why their primary checkout page had a historically high abandonment rate.
- Actions: They analyzed a funnel exploration report within their analytics platform to identify the exact step where the drop-off occurred. They implemented specific event tracking on the final shipping calculation button. They then segmented the resulting data by comparing mobile users against desktop users.
- Blockers and Fixes: The initial analytics data was heavily skewed because third-party payment gateway redirects were starting entirely new sessions upon return. They resolved this tracking issue by adding the specific payment gateway domain to the unwanted referrals list in their data stream settings.
- Visible Results: The corrected, accurate report revealed a massive 65% drop-off occurring specifically on mobile devices at the shipping calculation step, leading them to completely redesign the mobile checkout interface and immediately recover 20% of their previously lost daily sales.
Discover Orova.vn – a Biz AI Agent platform with OROVA SEO, a complete solution for every website. The system supports search engine optimization from A to Z with features including keyword research, writing new SEO-ready articles, optimizing existing content, rank tracking, plus competitor analysis and in-depth technical analysis. Sign up today to experience OROVA SEO completely free (offer valid through July 7, 2027).
Tool Stack Decision: Free vs. Paid Options
Choosing the right tools determines the depth of your analysis. You face a critical choice between relying entirely on free platforms or investing heavily in paid enterprise software. The free tools provide the absolute truth about your own website, while the paid tools provide necessary context about everyone else.
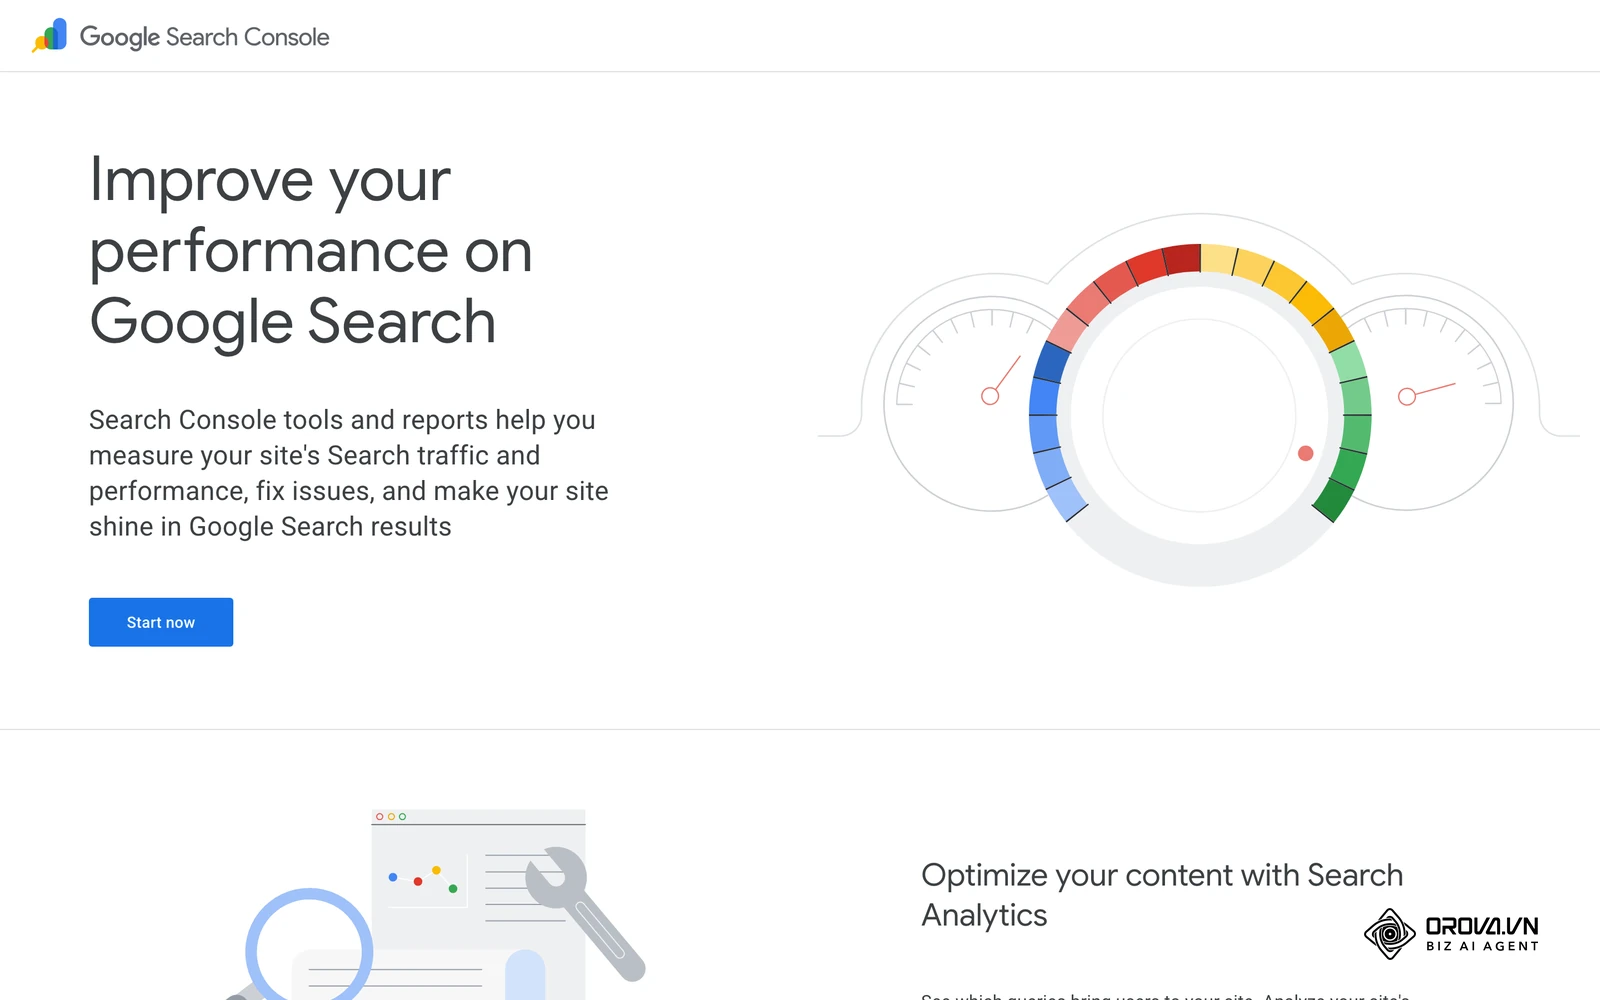
You should not blindly purchase expensive software before you have mastered the free tools. A tool is only as valuable as the person interpreting its output. If you do not understand the basic difference between a session and a pageview, an expensive subscription will not save you. Search Console is the free tool most teams underuse, so if you have not connected it yet, start with this guide to Google Search Console for SEO.
| Tool Category | Best Used For | Learning Curve | Primary Weakness |
|---|---|---|---|
| Google Analytics 4 | Internal user behavior tracking | High | Complex interface requires training |
| Google Search Console | Internal search visibility | Low | Keeps only 16 months of data and hides some anonymized queries |
| Semrush / Ahrefs | Competitor keyword research | Medium | Expensive monthly recurring costs |
| Similarweb | Broad market traffic estimations | Low | Estimates are less reliable for small sites |
| Hotjar / Clarity | Visual heatmaps and session recordings | Low | Adds another script to every page and recordings need a privacy review |
Illustrative example:
- Context: A local retail business with 5 employees was deciding on a tool stack to monitor their new online store's performance.
- Actions: They initially started with completely free tools, installing only Google Search Console and basic analytics. A few months later, they decided to try a paid tool subscription to uncover competitor keywords.
- Blockers and Fixes: The paid tool had far too many complex features, completely overwhelming and confusing the small team. They quickly downgraded to a much cheaper tier and focused exclusively on the simple domain overview report rather than complex backlink analysis.
- Visible Results: They successfully maintained a lean monthly budget while identifying three specific competitor products that consistently drove high traffic, allowing them to stock similar items and increase their own store revenue by 15%.
Key Metrics to Track (and Their Actionable Fixes)
Metrics are only numbers until you understand the story they tell. Focusing on the wrong metrics leads to terrible business decisions and wasted marketing budgets. You must focus on metrics that directly correlate with user satisfaction and financial return.
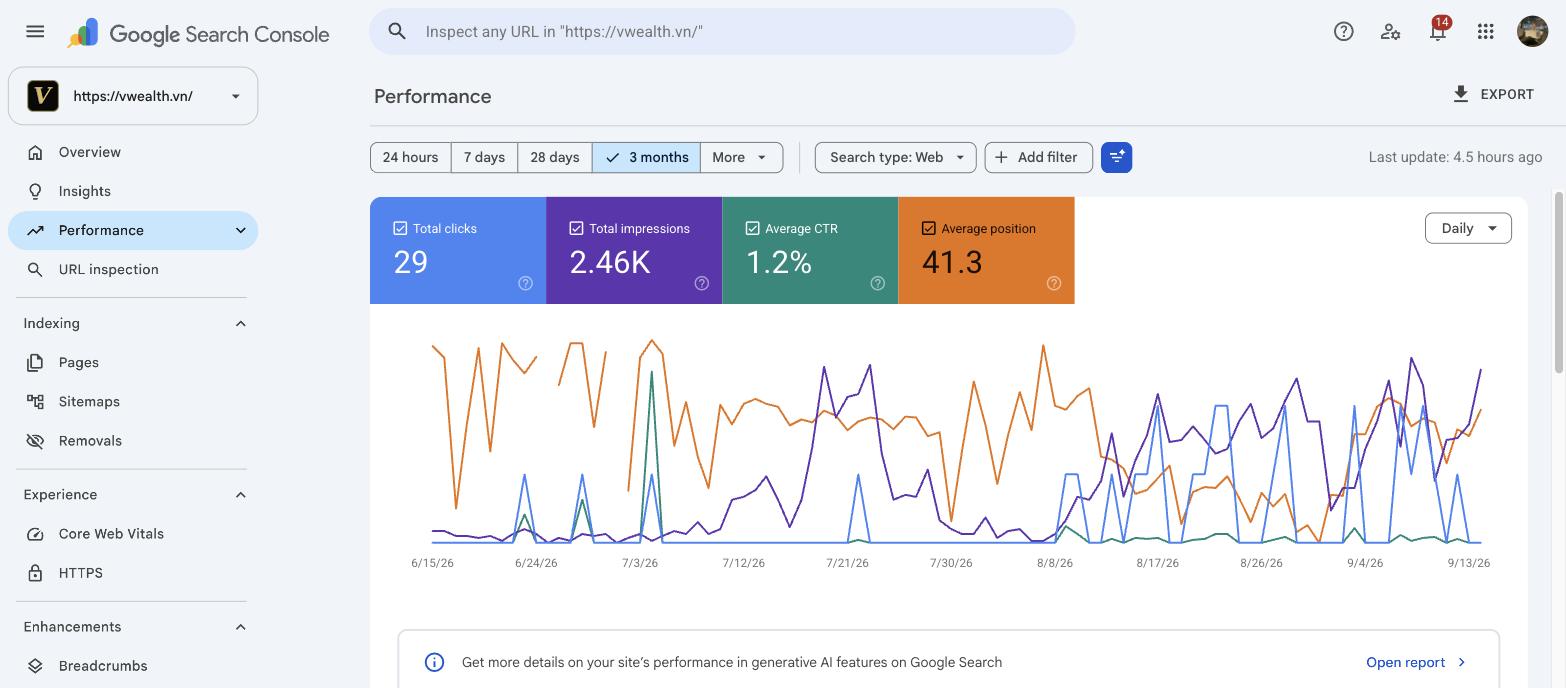
Tracking vanity metrics, like total followers or raw social impressions, might make you feel good, but they do not pay the bills. You need to monitor the specific indicators of actual engagement and conversion efficiency.
| Crucial Metric | What It Actually Means | The Worrying Threshold |
|---|---|---|
| Engagement Time | The actual seconds a user spends actively looking at your page | Consistently under 30 seconds for long-form content |
| Bounce Rate | The percentage of users who leave without interacting further | Consistently over 80% on primary landing pages |
| Conversion Rate | The percentage of sessions that result in a defined goal completion | Consistently under 1% for targeted e-commerce traffic |
| Traffic by Source | The distribution of where your visitors are coming from | Relying on a single source for more than 70% of traffic |
| Exit Rate | The percentage of views that were the last in a given session | Unusually high rates on your primary checkout pages |
If your engagement time is low, you must aggressively edit your content. You need to remove long, boring introductions and get straight to the point. Add formatting, bullet points, and clear headings to make the text scannable.
If your conversion rate is abysmal, the problem is rarely the traffic volume itself. The problem is usually a terrible user experience, a confusing checkout process, or a fundamental mismatch between what the ad promised and what the landing page delivers. You must ensure your messaging is absolutely consistent from the first click to the final purchase, because a visitor who does not find what the ad promised leaves before converting.
With OROVA.VN and the OROVA SEO module, you put an end to the exhausting days of manual work for good. Instead of struggling for hours to write articles and compile reports, the entire process is now optimized and completed in just 5 minutes.
5 Costly Mistakes When Measuring Traffic
Even experienced marketers make fundamental errors when analyzing their data. These mistakes do not just result in bad reports; they lead to catastrophic budget misallocations.
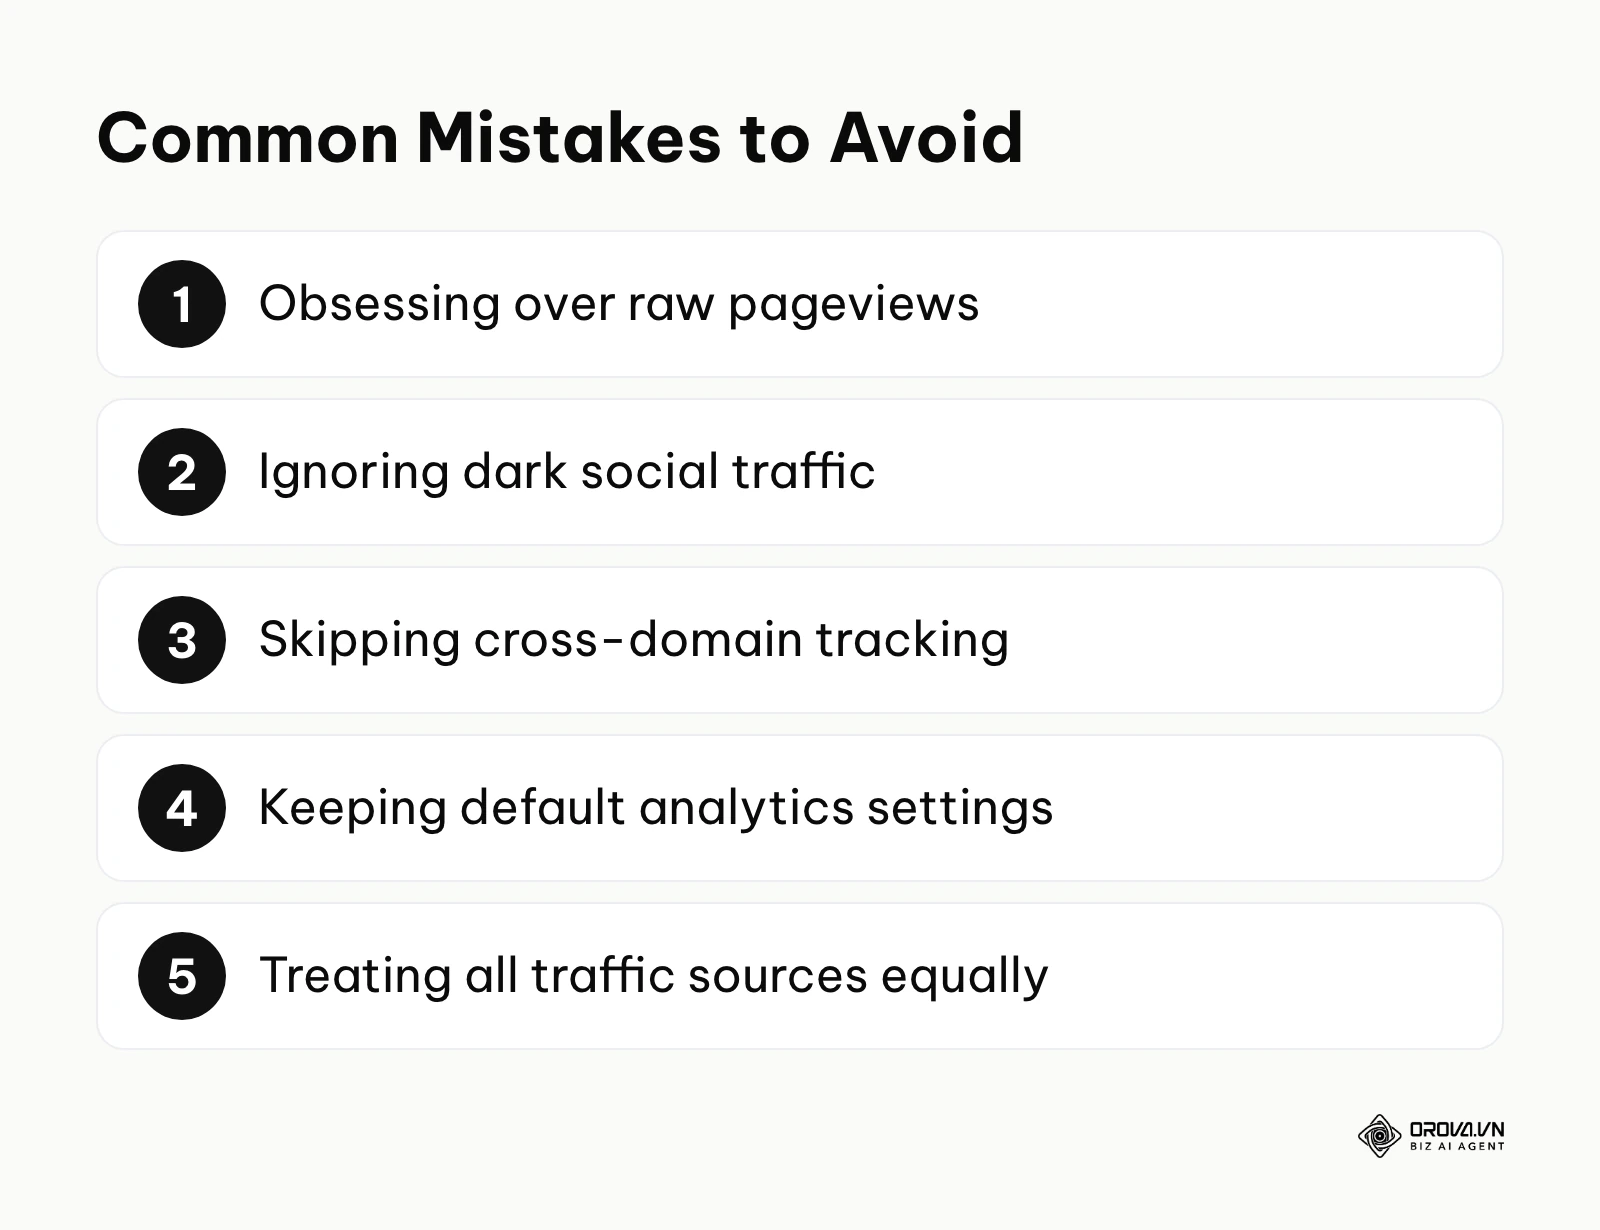
The first massive mistake is obsessing over raw pageviews. Pageviews tell you nothing about intent. One hundred highly targeted visitors who read an entire article are vastly more valuable than ten thousand random visitors who click away after two seconds.
The second mistake is ignoring dark social traffic. When people share your links privately in messaging apps like WhatsApp or Slack, analytics platforms often miscategorize this as generic direct traffic. You fix this by rigorously using tracking parameters on every link you share publicly, minimizing the unknown variables.
The third mistake is failing to track cross-domain movement. If your blog sits on one domain and your checkout cart sits on another, the analytics system will treat one user as two separate people unless you specifically configure cross-domain tracking in your tag manager.
The fourth mistake is keeping the default analytics settings. Out of the box, analytics platforms are configured to track basic metrics that apply to everyone. You must customize the system to track the specific events that matter to your unique business model.
The fifth mistake is treating all traffic sources equally. A visitor from an organic search query like "buy leather shoes now" has a drastically different intent than a visitor who clicked a funny meme on social media. You must segment your data and evaluate the performance of each channel independently.
Illustrative example:
- Context: A digital marketing agency managing paid campaigns for a regional dental clinic needed to firmly prove the financial value of their recent ad spend.
- Actions: They set up conversion tracking for the primary appointment booking form on the site. They generated a detailed monthly report comparing paid traffic against organic traffic. They then presented the overall cost per acquisition based on these generated numbers.
- Blockers and Fixes: The angry client complained that the reported 50 monthly conversions in the dashboard did not match the 10 actual bookings in their physical CRM system. The agency quickly discovered they were tracking casual visits to the contact page instead of successful form submissions. They immediately updated the tracking trigger to fire only when the appointment system returned a definitive success message.
- Visible Results: The following month, the analytics dashboard displayed exactly 15 accurate, verified bookings, aligning perfectly with the client CRM and instantly restoring trust in the campaign data.
Website Traffic Measurement Trends in the Next Few Years: My Predictions
As of 2026, the entire landscape of data analysis is undergoing a massive transformation. The old methods of simply dropping a cookie and tracking a user indefinitely are rapidly becoming obsolete. Here is where I think the industry is heading.
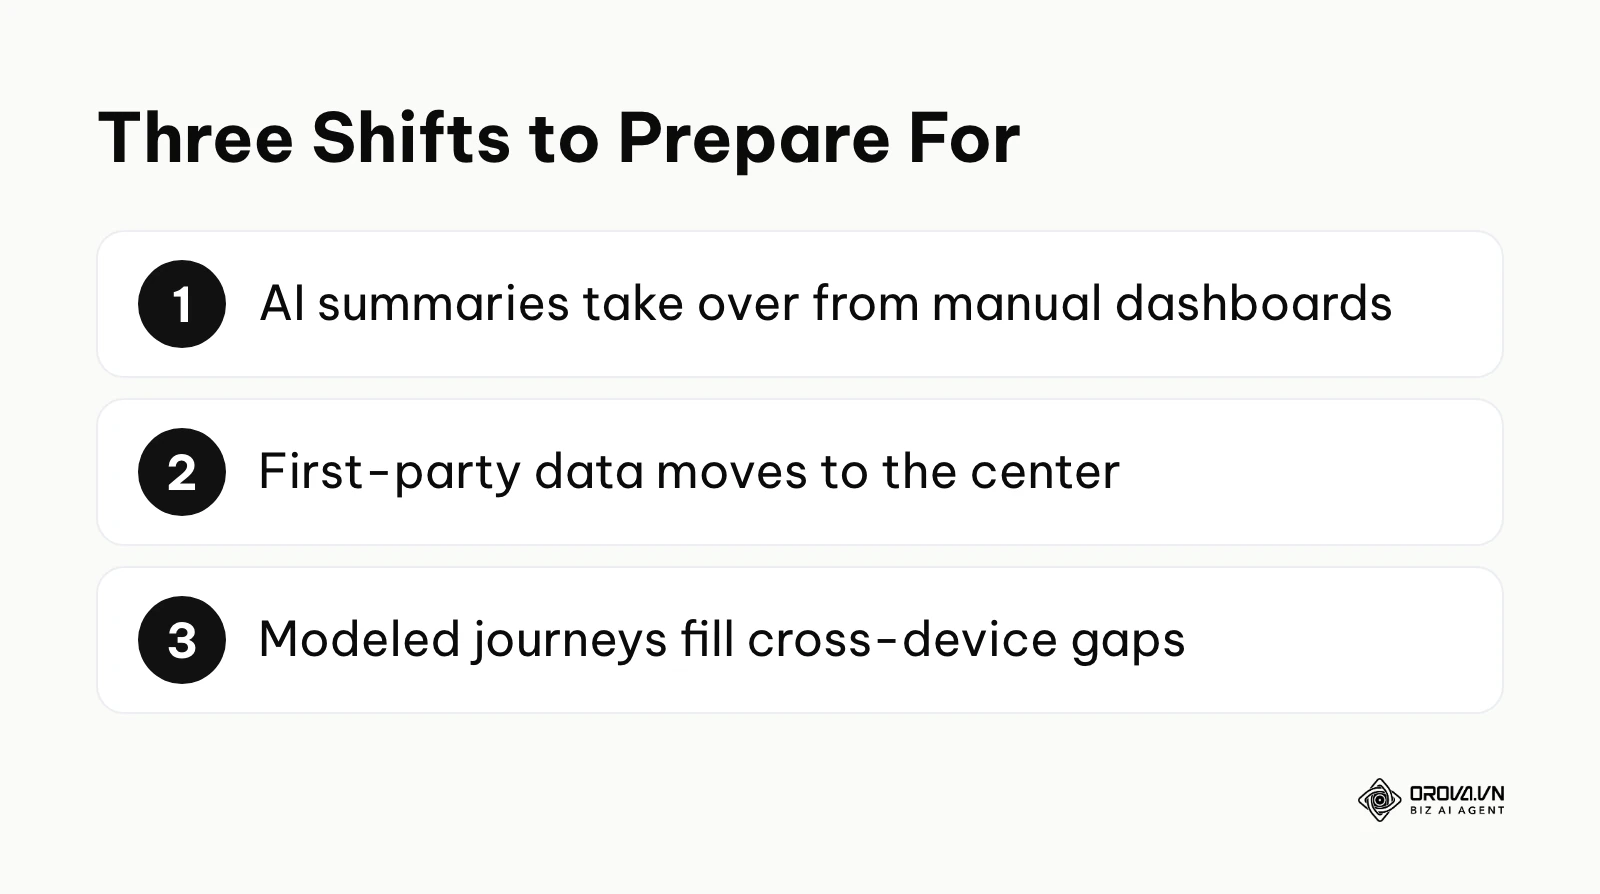
AI-Driven Insights Will Replace Manual Dashboards
Many teams still spend hours staring at complex charts, trying to find a single actionable insight. I believe that over the next few years, fewer people will start their day in a traditional bar chart. Instead, AI assistants will increasingly scan the data and surface plain-text summaries of what changed and why. You need to start treating your data infrastructure seriously today, because AI requires perfectly clean data to function. If your current tracking is broken, future AI tools will only summarize broken numbers faster.
Privacy Rules Will Put First-Party Data at the Center
Browser restrictions and privacy laws are making it increasingly difficult to track users across the web. I think third-party cookies will matter less and less, pushing most businesses to rely mainly on first-party data. This means you must build direct relationships with your users. You should prepare by prioritizing email capture and user registrations now, creating compelling reasons for visitors to voluntarily log in to your website rather than remaining anonymous browsers.
Cross-Device Tracking Will Rely on Predictive Modeling
A user often researches a product on their phone and buys it on a laptop days later. Traditional tracking loses this connection completely. I expect that analytics platforms will increasingly rely on predictive machine learning models to fill in these tracking gaps. They will estimate user journeys rather than recording them perfectly. In my view, absolute precision is becoming a thing of the past, and the teams that do well will be the ones comfortable making decisions on well-modeled estimates rather than perfect deterministic data.
Frequently Asked Questions About Measuring Website Traffic
How long does it take to see accurate data after setup?
Once you install your tracking tags correctly, real-time data will appear within minutes. However, comprehensive reports regarding user demographics, complex acquisition channels, and verified conversions typically take between 24 and 48 hours to fully process and populate accurately within most modern analytics platforms.
Why do different tools show completely different numbers?
Different tools use fundamentally different methodologies to collect data. Google Analytics relies on a script executing in the user's browser, which can be blocked by ad blockers. Your server logs record every single request, including bots. Third-party SEO tools rely on estimates modeled from rankings and panel data. You should never expect these numbers to match perfectly; instead, you should focus on the overall directional trends.
How will AI change how we analyze this traffic?
AI is starting to reduce the need to manually dig through secondary dimensions and complex tables. Instead of asking a data scientist to build a custom report, you can increasingly ask an AI assistant a question like, "Why did revenue drop last Tuesday?" and get a narrative answer that points to where the drop happened, such as mobile conversions. The answer is only as good as the tracking behind it, so verify it against your reports.
Do I need a developer to set up basic tracking?
You do not need a developer for the absolute basics if you use a tag management system. You can follow simple tutorials to install the initial container snippet. However, if you run a complex e-commerce store and need to track dynamic cart values, specific product variations, and intricate user flows, hiring a professional developer to configure your data layer correctly is highly recommended.
What is considered a good bounce rate?
There is no universal standard for a good bounce rate because it depends entirely on the context of the page. A high bounce rate on a dictionary definition page is excellent because the user found the answer instantly. A high bounce rate on a multi-step checkout page is catastrophic. In Google Analytics 4, bounce rate is simply the share of sessions that were not engaged, so you should focus on engagement time and specific event triggers rather than obsessing over traditional bounce rate percentages.
Where to Start?
Feeling overwhelmed by data is a completely normal reaction. The key is to start small and build your measurement infrastructure progressively. You do not need a massive enterprise dashboard on day one. You just need to take one specific, targeted action based on your current situation.
If you currently have absolutely no tracking installed on your website, your only priority for today is creating a Google Tag Manager account. Do not worry about advanced conversion events or cross-domain linking. Simply generate your container code, follow the instructions to place it in your website's header, and publish an empty workspace. Getting the foundation in place is the hardest step.
If you already have analytics installed but you simply do not trust the numbers you are seeing, your task today is to identify and filter your internal traffic. Find your office IP address and create an exclusion rule in your analytics property settings. By removing the noise generated by your own team testing the site, your data will instantly become more reliable and reflective of actual customer behavior.
If you have clean internal data and want to start expanding your strategy, your task today is to identify your three biggest direct competitors and run their domains through a free estimation tool. Look specifically at their top performing organic pages. Identify one specific topic they are receiving massive traffic for that you have completely ignored. You can then use AI writing tools for website SEO to quickly draft a superior, more comprehensive article on that exact topic to start stealing their market share.
About the author

Builder of Orova
Nguyễn Đỗ Trọng Ân has 8 years of experience in marketing, including 6 years managing market development across Asia. He builds Orova, a Biz AI Agent that never sleeps: it plans, runs and optimizes work for businesses.
Run your business with AI Agents
Orova is the always-on Biz AI Agent — it plans, runs, and optimizes the work for you.
Save time, unlock productivity.