
PPC reporting: a practical guide to turning ad data into decisions

PPC reporting is the work of turning raw Google Ads and Meta Ads data into a short story your stakeholders can act on: what happened, why it happened, and what you will do next. Most reports stop at the first part, and that is why they get ignored.
You spend hours every Monday morning downloading CSV files from five different ad platforms, wrestling with broken pivot tables, and meticulously formatting slides to match the corporate color palette. You send out the email with the subject line "Weekly Performance Update." And then—silence. Nobody replies. Nobody asks questions. The business continues operating exactly as it did before you hit send.
This is the harsh, frustrating reality for many marketers and agency account managers. You are building dashboards, but you are not delivering insights. Your stakeholders do not care about a 0.5% fluctuation in Click-Through Rate (CTR); they care about why the sales pipeline is drying up, why inventory is sitting in the warehouse, and whether they are wasting their marketing budget. When you present platform-level vanity metrics to business-level decision-makers, you instantly commoditize your role.
If your current process feels like a tedious exercise in data entry rather than a strategic advisory role, your framework is fundamentally broken. You are acting as a reporter, not an analyst. Reporters read the news; analysts explain what the news means and what to do about it.
This comprehensive guide will dismantle the outdated, manual ways of presenting data. We will rebuild your approach from the ground up, providing you with report structures, diagnostic frameworks, and communication scripts needed to ensure your insights actually drive business decisions. Whether you are managing a modest monthly budget for a local service business or a seven-figure monthly budget for a global enterprise, the principles of data storytelling remain the same.
What is PPC reporting and why does it dictate strategy?
PPC reporting is the systematic process of extracting, analyzing, and presenting data from paid advertising campaigns (like Google Ads, Meta Ads, LinkedIn Ads, or TikTok) to evaluate performance against macro business goals. It is not merely a summary of numbers; it is the critical translation layer between algorithmic platform behavior and human decision-making.
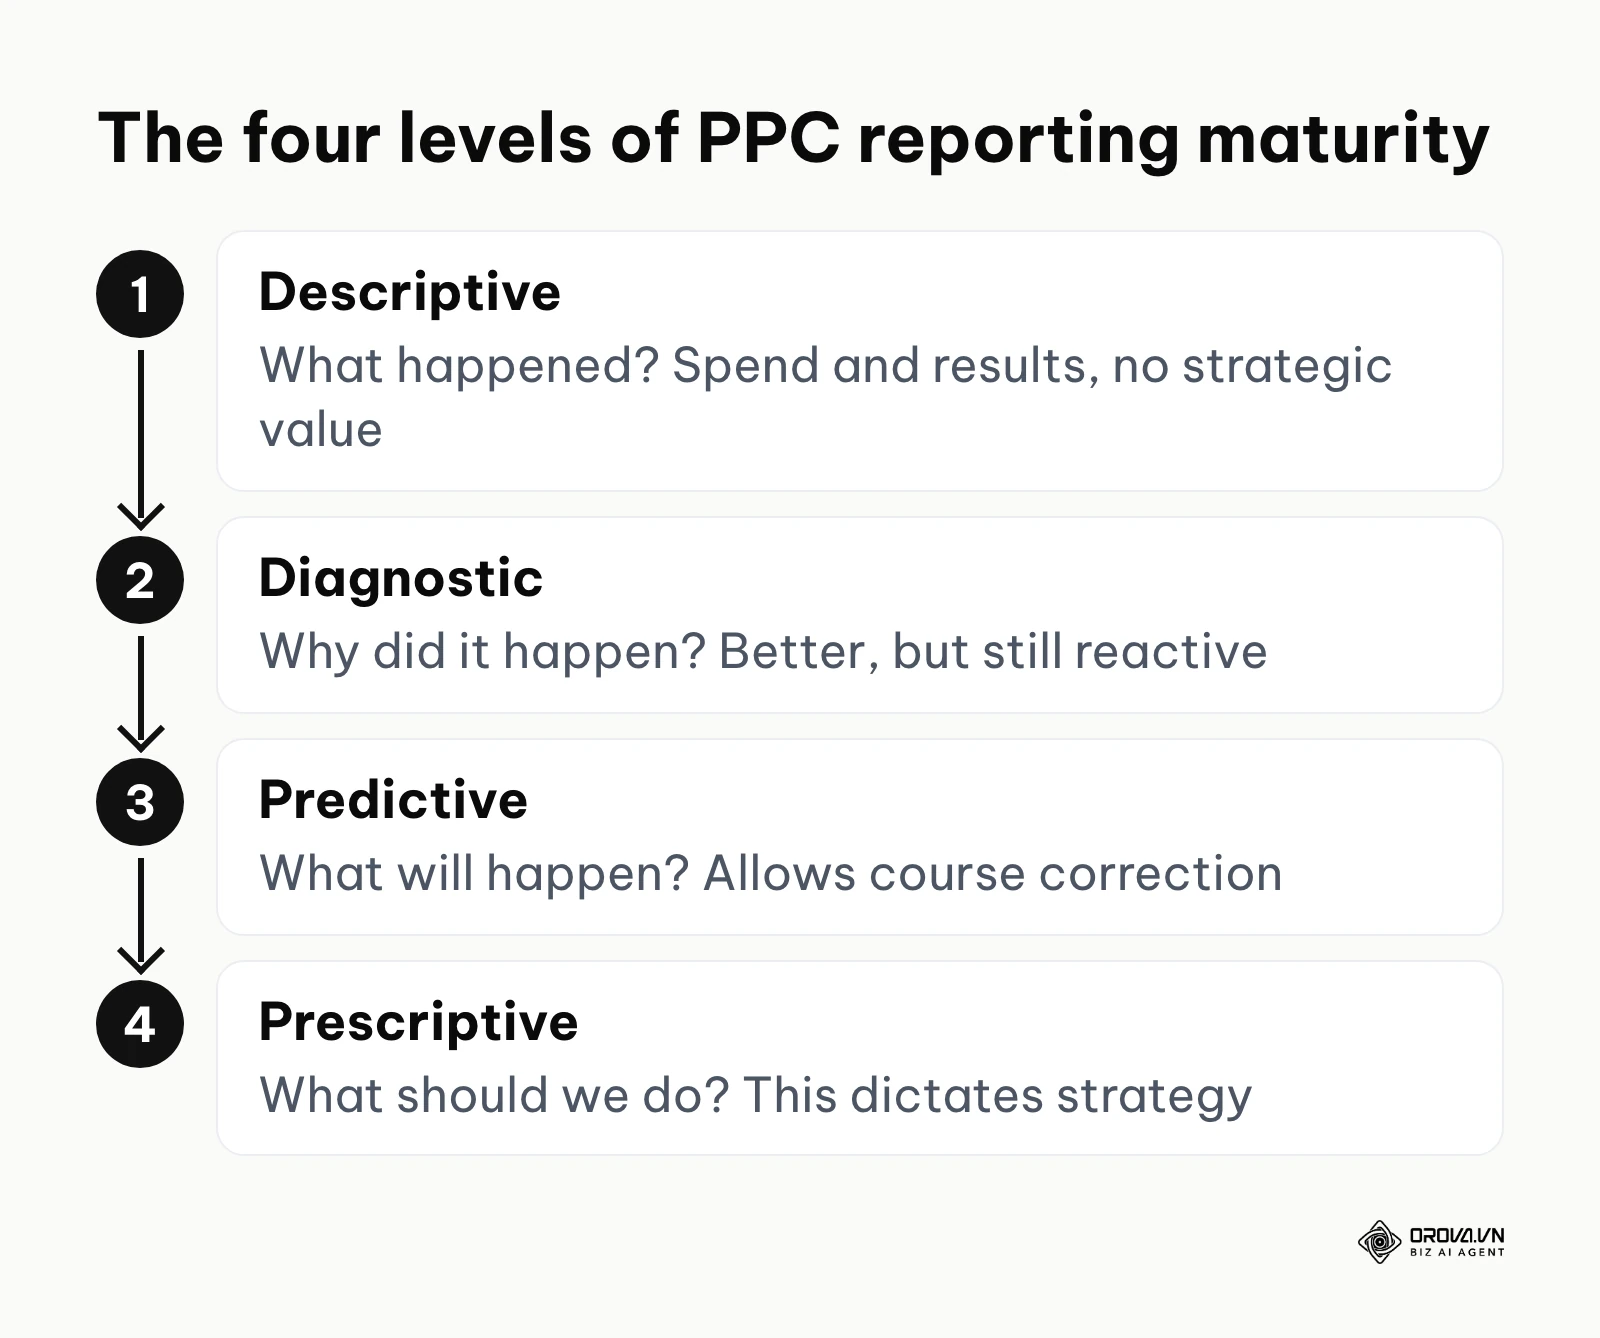
Data maturity in PPC generally follows four distinct phases (the figures quoted below are illustrative):
- Descriptive Reporting (What happened?): The most basic level. "We spent the monthly budget and got 50 leads." This offers zero strategic value.
- Diagnostic Reporting (Why did it happen?): "We spent the monthly budget and got 50 leads. Lead volume dropped 20% because our Impression Share fell due to increased competitor bids." This is better, but still reactive.
- Predictive Reporting (What will happen?): "Based on current auction pressure and historical conversion rates, if we maintain this budget, we will fall short of our monthly lead target by 15%." This allows for course correction.
- Prescriptive Reporting (What should we do?): "To hit our pipeline target, we need to shift 20% of spend from the top-of-funnel display campaigns into our high-intent search campaigns, and launch a new landing page offer to improve conversion rates." This dictates strategy.
You should build rigorous reports if you are spending significant budget across multiple channels and need to justify Return on Investment (ROI) to leadership or clients. A strong report does not just justify past spend; it unlocks future budget. When you can definitively prove that putting one dollar into the machine yields four dollars out, you shift the conversation from "marketing is an expense" to "marketing is a revenue engine."
Conversely, you should not rely on complex, multi-page reporting if you are running a temporary, low-budget experiment where platform-native dashboards are perfectly sufficient.
Furthermore, PPC data is often the "canary in the coal mine" for the broader business. Because paid search captures direct intent, a sudden drop in search volume for your core product might indicate a macro-economic shift, a change in consumer trends, or a brand reputation issue long before it shows up in quarterly financial statements. Your report is the early warning system.
Preparation: The foundation of a reliable data ecosystem
Before you can extract any meaningful insights, you must ensure the data you are looking at is actually true. A beautifully designed dashboard built on broken tracking is a dangerous liability. Decisions made on bad data are exponentially worse than decisions made on no data at all.
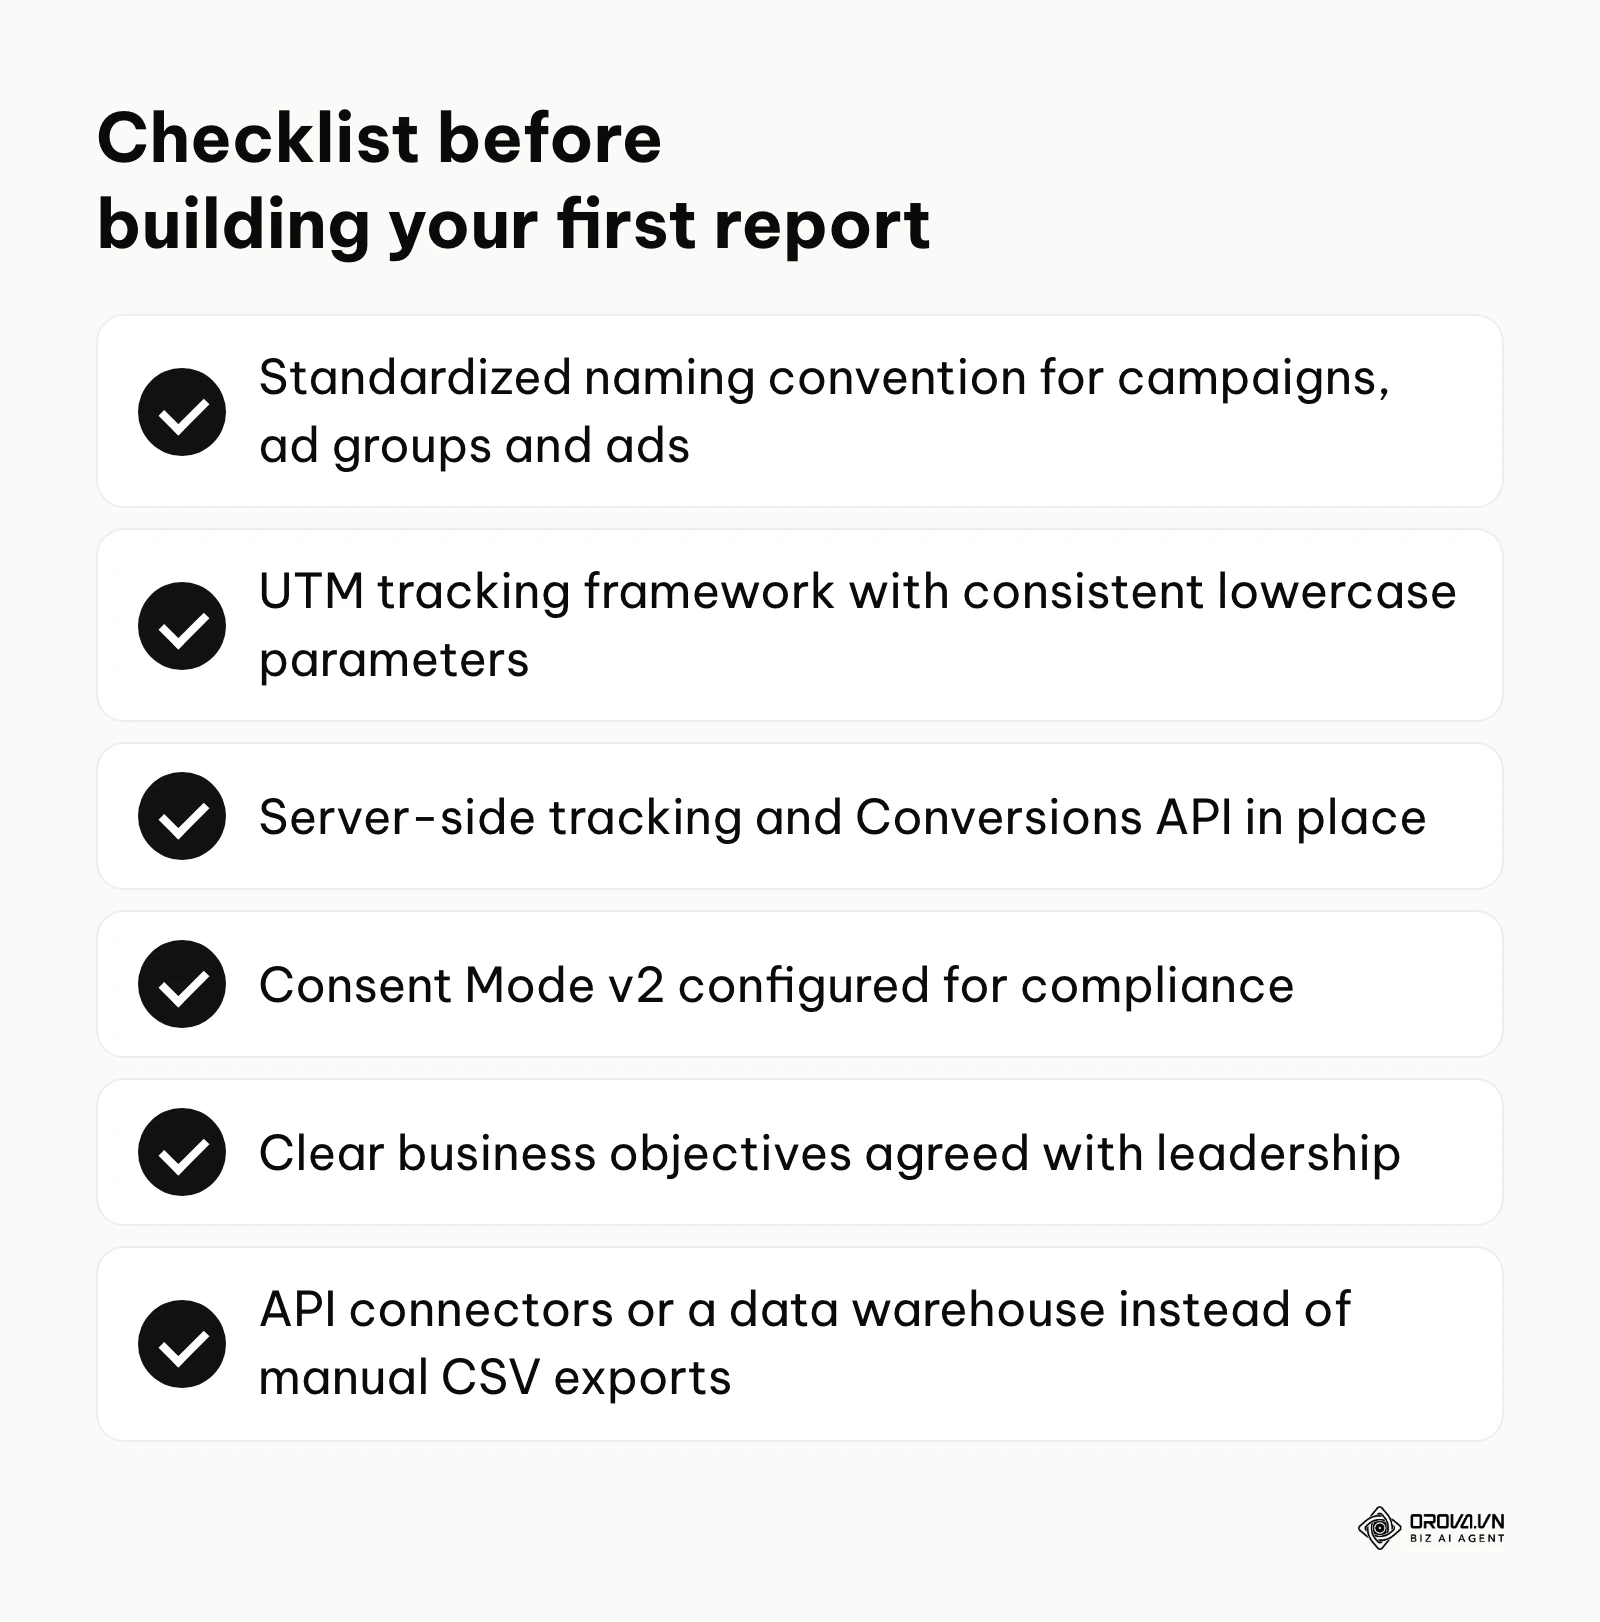
You must establish a single source of truth. This means standardizing how you name your campaigns, how you track your links, and where the final conversion is counted. If your Google Ads dashboard says you drove 50 sales, but your CRM only registers 10, your report will instantly lose all credibility with your stakeholders. Once trust in the data is lost, it takes months to regain.
The pillars of Data Governance
To build a reporting infrastructure that can scale, you need to implement strict data governance. This is not optional; it is the prerequisite for analysis.
| Asset / Prerequisite | Description & Best Practice | Estimated time to set up |
|---|---|---|
| Standardized Naming Convention | A strict, standardized formula for every campaign, ad group, and ad. Example: [Platform]_[Region]_[Funnel Stage]_[Product/Theme]_[Match Type]. E.g., GAds_US_BOFU_CRM-Software_Exact. This allows you to filter and group data effortlessly in your reporting tools. | 2–4 hours to define, ongoing to enforce. |
| UTM Tracking Framework | A standardized spreadsheet generating consistent parameters. utm_source must always be lowercase (e.g., google, not Google or google_ads). utm_medium must be consistent (cpc, not cpc sometimes and paid others). | 1–2 hours to build the logic. |
| Server-Side Tracking & CAPI | As browser restrictions on cookies tighten, you should send data directly from your server to the ad platforms (like Meta Conversions API). This helps recover conversions that ad blockers and browser privacy restrictions would otherwise hide. | 1-2 weeks (requires developer/engineer support). |
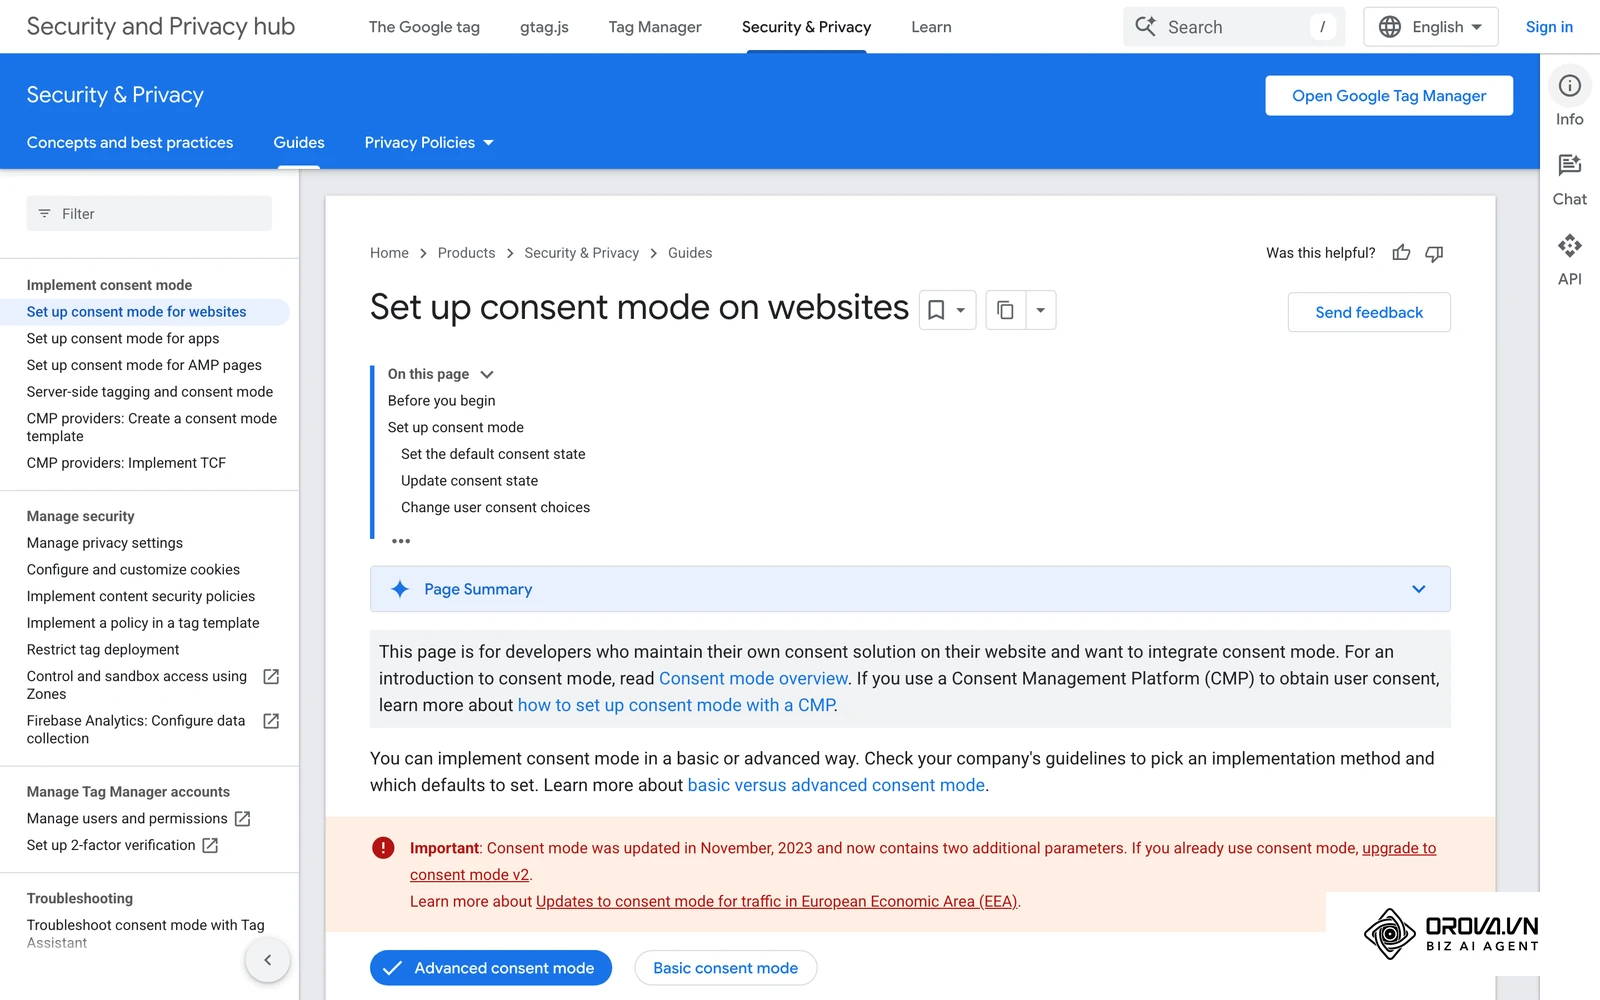
| Consent Mode v2 | Crucial for compliance (GDPR, CCPA). Ensures tracking adjusts based on user cookie consent while still allowing platforms to use behavioral modeling for unconsented users. | 3-5 days. |
| Clear Business Objectives | Direct conversations with C-level executives to define the North Star metric. Is it Target CPA? ROAS? LTV? Payback period? You cannot report success if success is not defined. | 1 week of alignment meetings. |
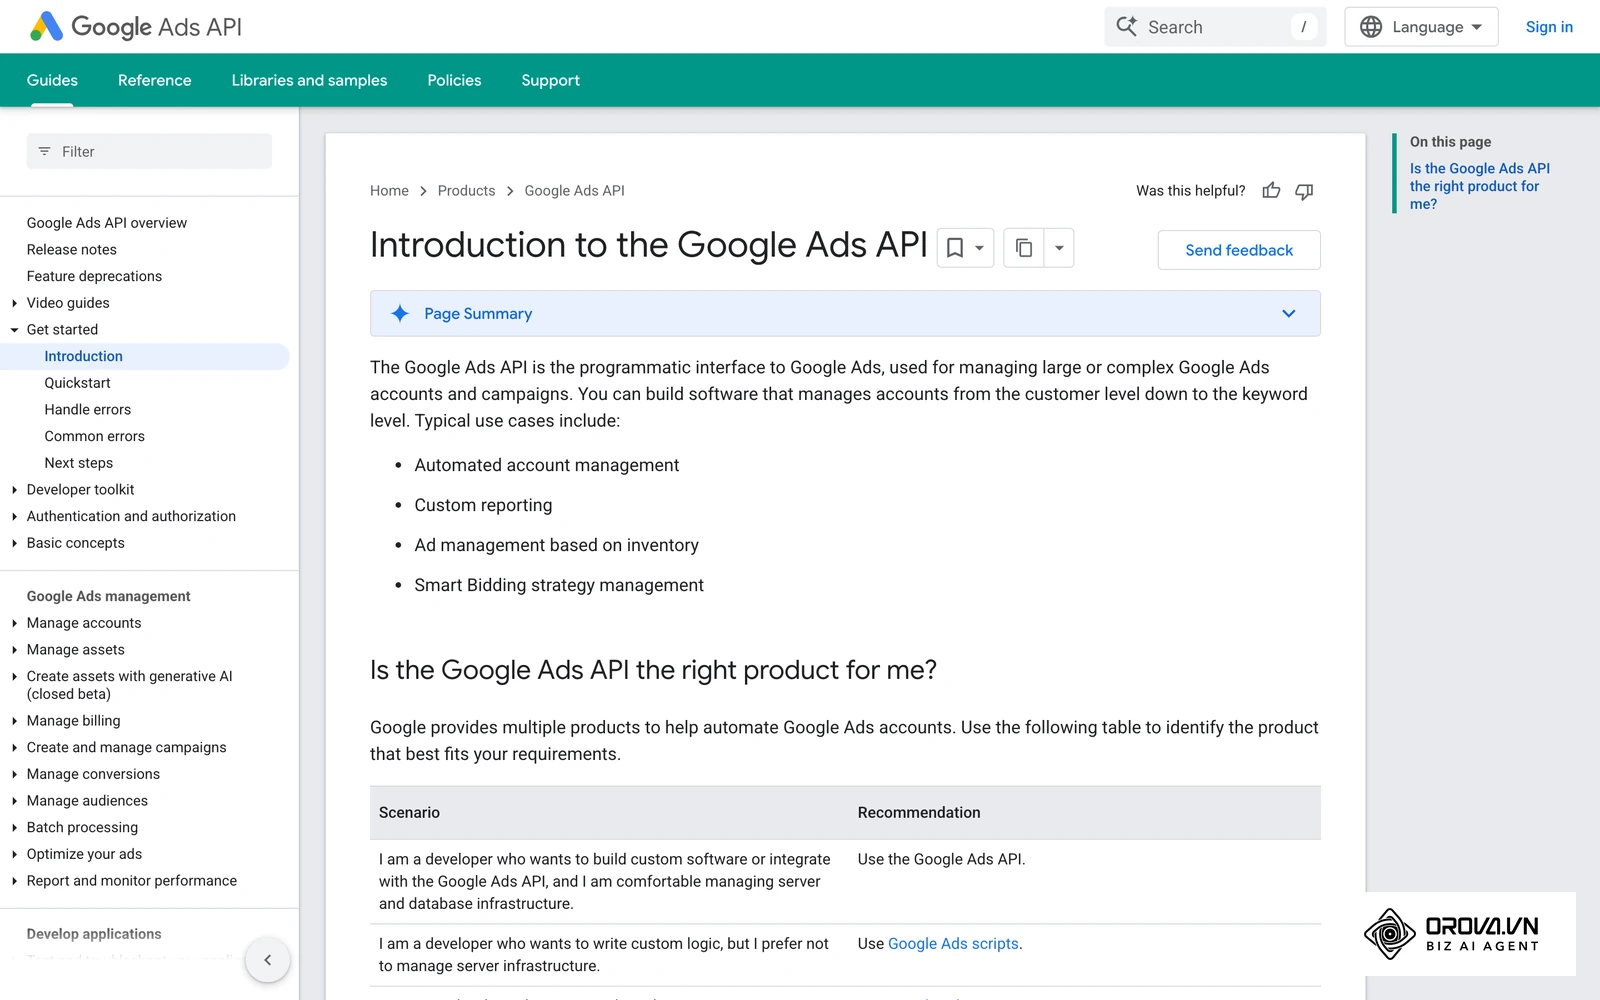
| API Connectors / Data Warehousing | Moving beyond manual CSV exports. Tools like Supermetrics or Funnel.io for direct dashboard connections, or moving data into BigQuery for advanced modeling and ownership of your historical data. | 2–5 days for initial setup. |
Without these pillars, you are building a house on sand. If a stakeholder asks, "How did our non-brand campaigns perform in Europe compared to North America?" and you have to spend three hours manually tagging Excel rows because your naming conventions are messy, your infrastructure has failed you.
The 6-step framework to build a PPC report that drives action
Building a report that commands attention requires moving from a mindset of "displaying data" to "crafting a narrative." Your report should read like a strategic memo, not a phone book. This execution guide breaks down the professional workflow that separates junior media buyers from strategic consultants.
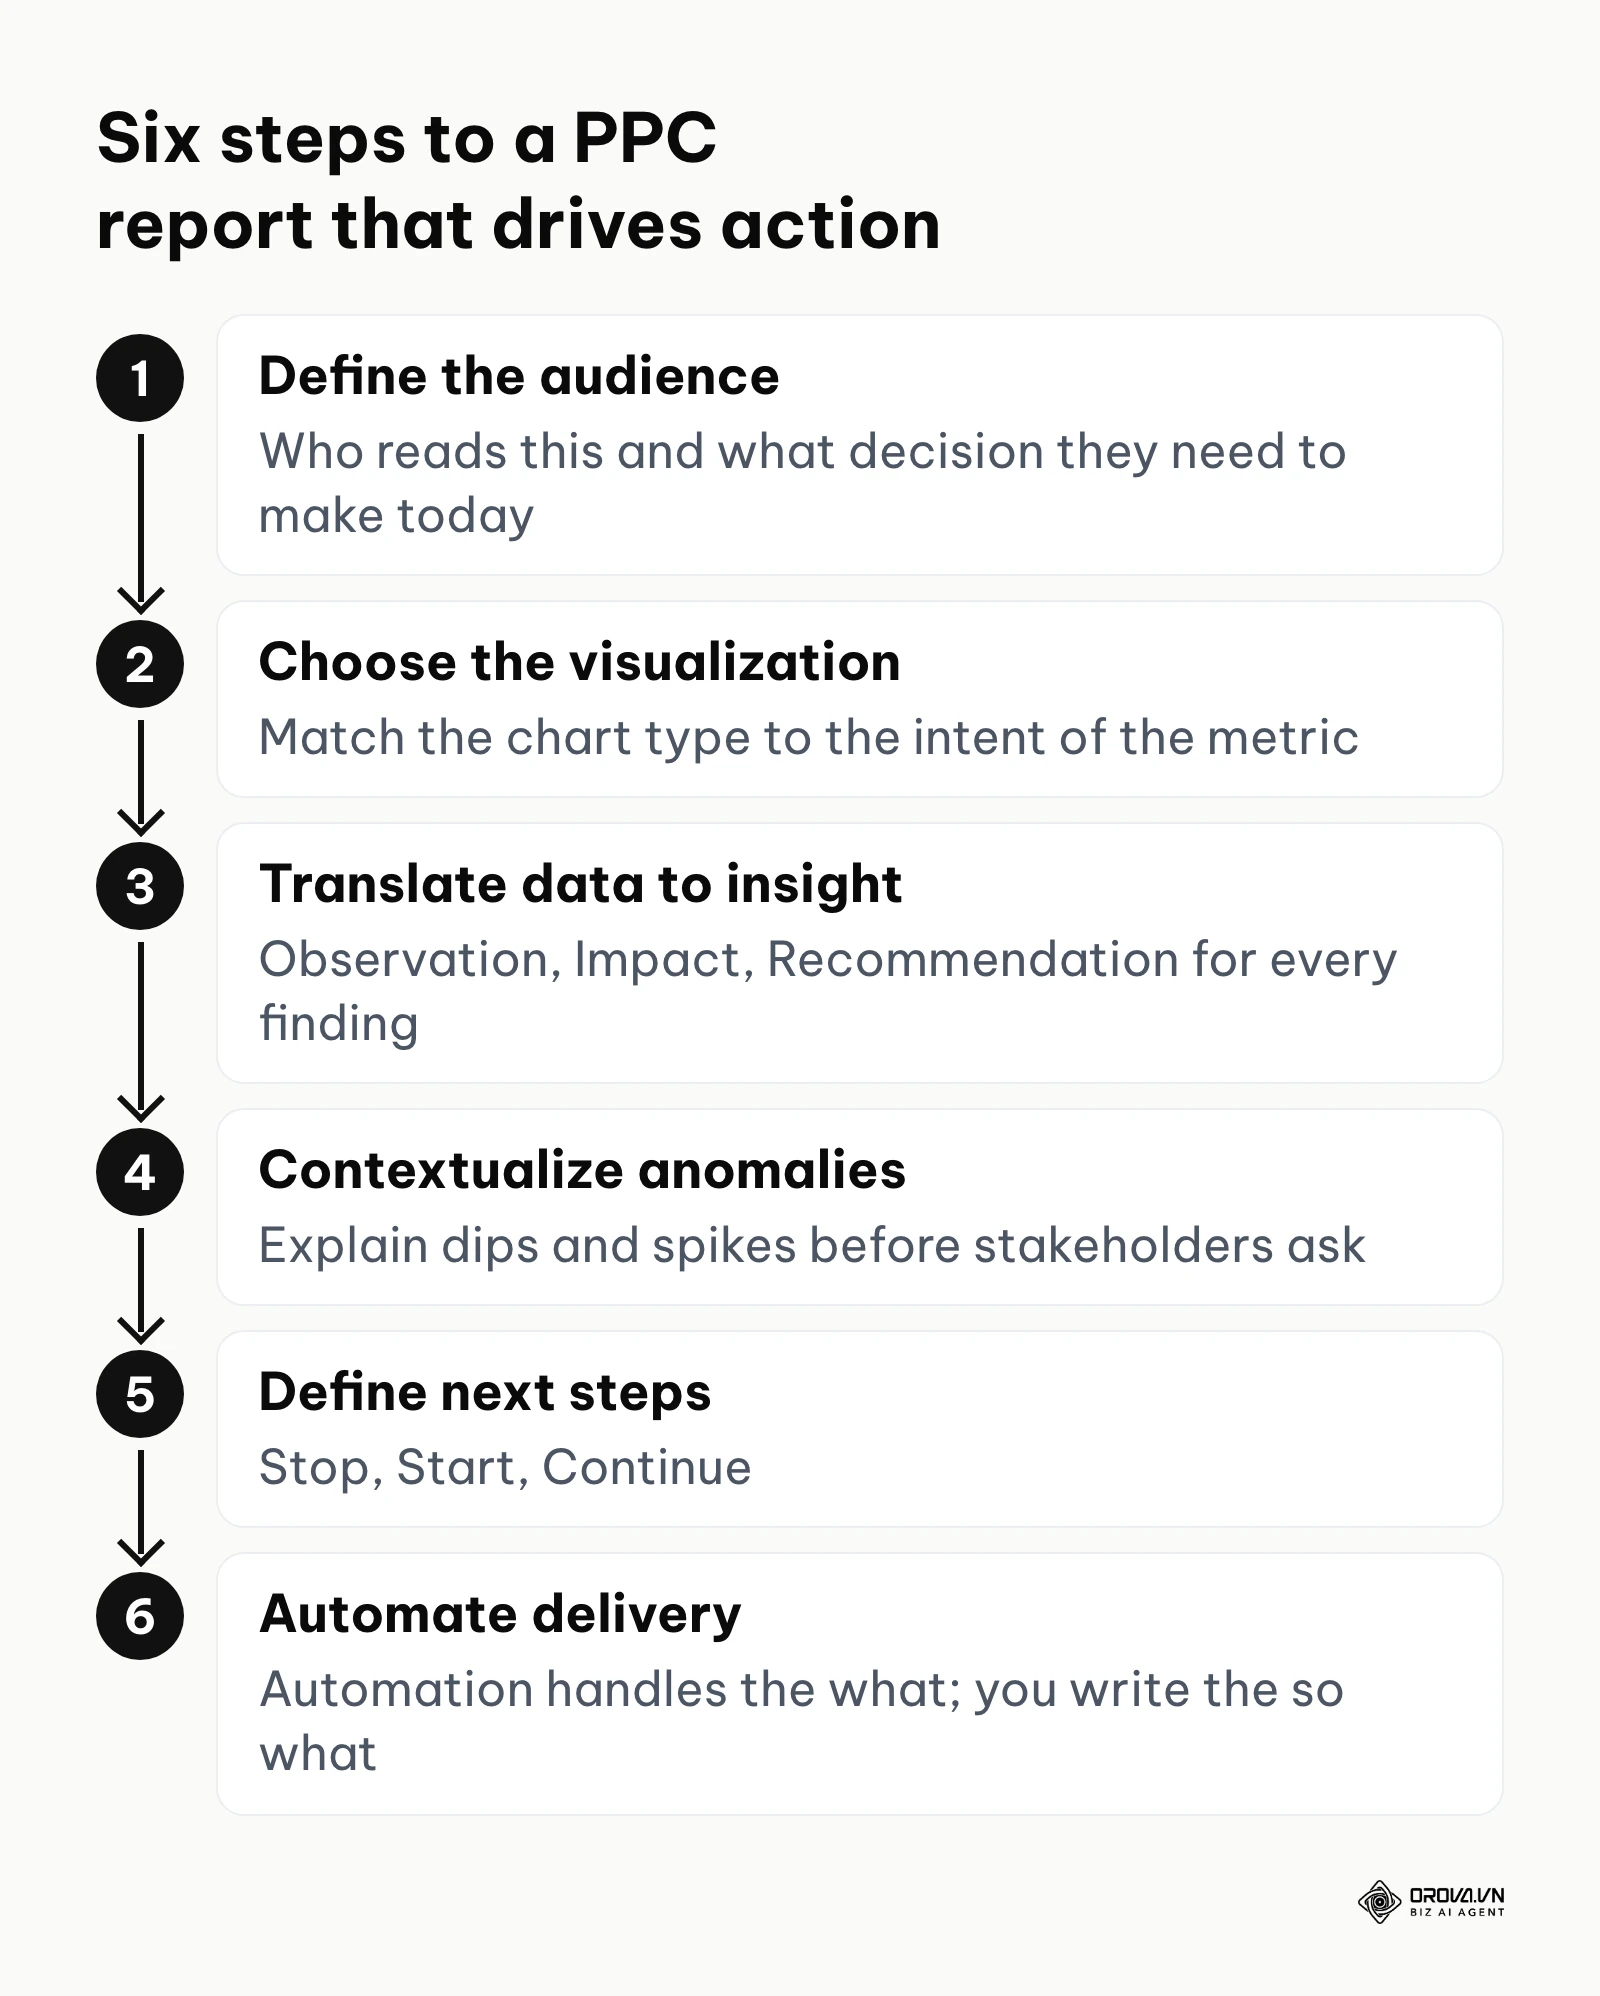
Step 1: Define the audience and their pain points
The biggest mistake you can make is sending the identical document to your CEO and your PPC specialist. You must tailor the depth of information to the reader's role and their specific anxieties. Identify exactly who will open the file and ask yourself: "What business decision does this person need to make today based on this data?"
- The Executive (CEO/President): They care about bottom-line impact. They want to see Total Spend, Total Revenue/Pipeline generated, Overall Efficiency (MER/ROAS), and high-level strategic pivots. Do not show them keyword quality scores.
- The Financial Leader (CFO): They care about risk and unit economics. They want to see Customer Acquisition Cost (CAC) vs. Lifetime Value (LTV), payback periods, and budget pacing (are we over or under spend?).
- The Marketing Leader (CMO/VP Marketing): They care about channel mix and messaging. They want to see which channels are driving the most efficient growth, which creative angles are winning, and how paid efforts are lifting organic traffic.
- The Operator (Marketing Manager/Specialist): They need granular data to optimize. They look at Impression Share, CTR, CPC, Quality Score, and granular A/B test results.
Step 2: Choose the right visualization for the narrative
Cognitive load theory states that human memory has limits. If your dashboard looks like a pilot's cockpit, the stakeholder will simply close the tab. Do not use a pie chart to show trends over time. Do not use a dense data table when a simple line graph tells the story instantly. The visual format must match the intent of the metric.
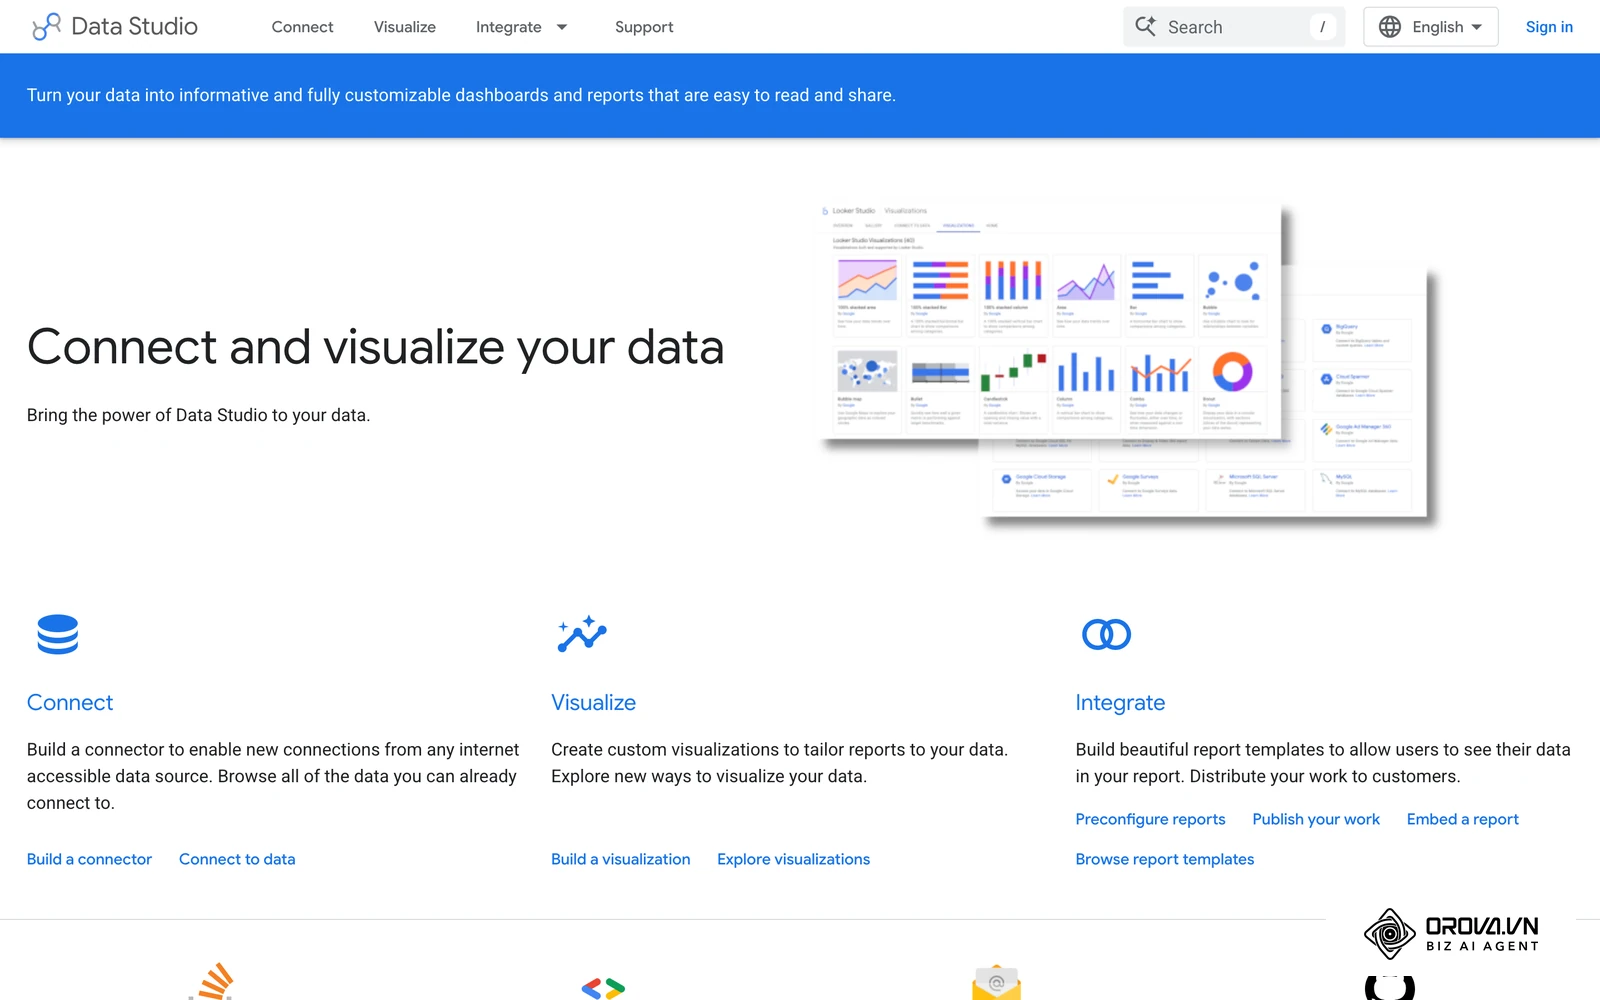
- Use Line charts for pacing and historical trends over time (e.g., Spend and CPA over the last 30 days). Always include a baseline or target line for context.
- Use Bar charts for comparing discrete categories (e.g., Performance by campaign type, or Meta vs. Google).
- Use Scatter plots to find outliers and correlations (e.g., plotting campaigns with Cost on the X-axis and Conversions on the Y-axis to instantly spot high-spend/low-return campaigns).
- Use Scorecards for absolute top-level KPIs (e.g., Total Revenue, Total Spend). Always include a comparison metric (e.g., "+15% vs previous period") with color coding (Green for good, Red for bad).
A strong report minimizes cognitive load. If it takes longer than five seconds to understand what a chart is saying, the visualization is wrong.
Step 3: The Data-to-Insight translation framework
This is the core of your PPC ad management reporting strategy. Raw numbers mean absolutely nothing without interpretation. A dashboard is not a report; a dashboard is a tool used to write a report. You must use the "Observation -> Impact -> Recommendation" (OIR) framework.
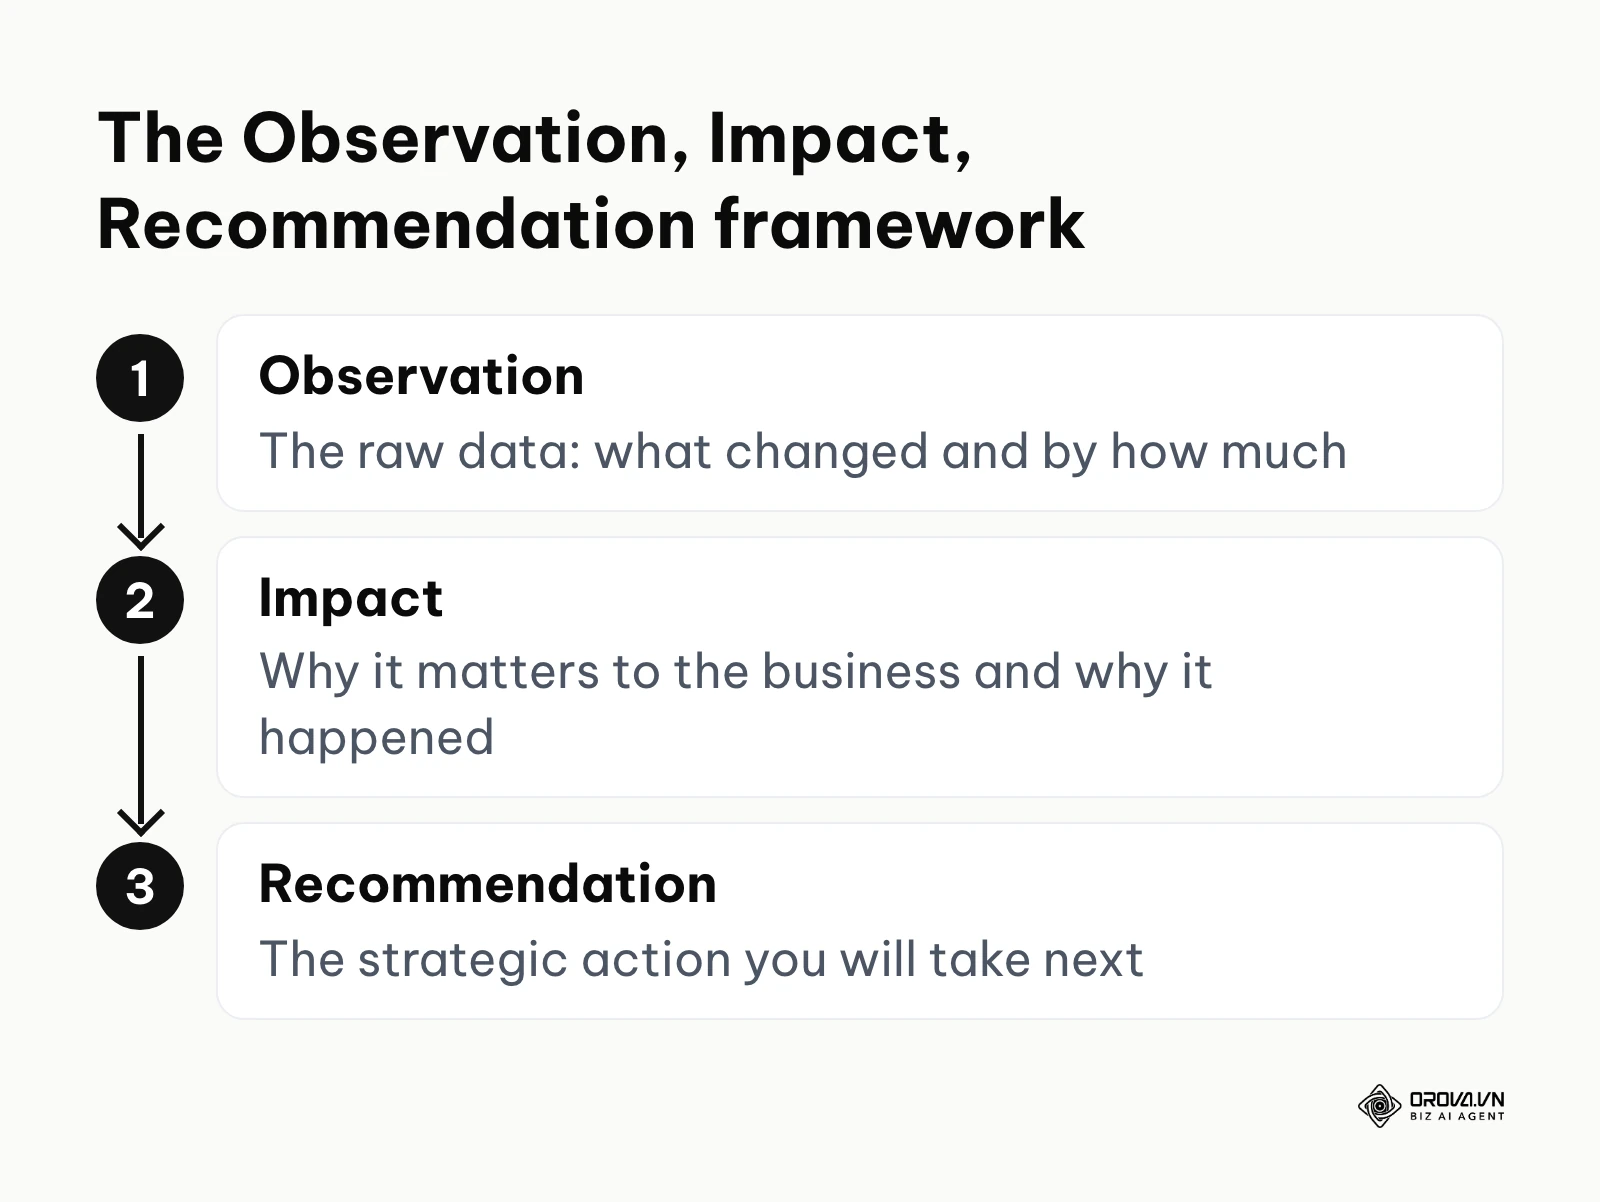
Illustrative example (B2B SaaS):
- Context: You are a senior media buyer managing a five-figure monthly Google Ads budget for a B2B SaaS company.
- Observation: "Over the last 14 days, the Cost Per Lead (CPL) on our core campaign increased by 40%." (This is the raw data).
- Impact: "Because our budget is fixed, this spike resulted in a 28% drop in total pipeline generated for the sales team this month. Analysis shows a specific high-volume keyword's CPC doubled due to a new competitor entering the auction." (This explains why it matters and why it happened).
- Recommendation: "Shift 20% of the budget from these highly contested terms to long-tail, lower-intent keywords where auction pressure is lower. Additionally, we will launch a competitor comparison landing page to improve conversion rates on the traffic we do capture." (This is the strategic action).
- Hurdle and resolution: The CEO initially panics at the CPL spike. Because you provided the exact reason (competitor action) and an immediate solution (budget shift), the conversation moves from blame to strategy.
- Result: The narrative shifts from "Performance is bad" to "The market changed, and here is exactly how we are adapting," preserving your authority.
Step 4: Contextualize the anomalies
Algorithms fluctuate. Weekends perform differently than weekdays. Macro events change consumer behavior. Holidays often depress conversion rates for B2B software but lift them for e-commerce. You must proactively explain these anomalies before the stakeholder asks about them.
If there is a massive dip in traffic on a Tuesday, your report should explicitly state: "Traffic down 15% due to a 4-hour AWS outage affecting our landing pages. Ads were paused to prevent wasted spend." Provide the external context that platform metrics cannot see.
To spot anomalies effectively, do not just look at day-over-day changes, which can be noisy. Look at rolling 7-day averages, or compare Monday to the previous three Mondays.
Step 5: Define the explicit next steps using "Stop, Start, Continue"
Never end a section of analysis without a definitive "Next Steps" action plan. A report that just says "Things look good" is useless. Use the "Stop, Start, Continue" framework to prove you are actively managing the account, not just observing it.
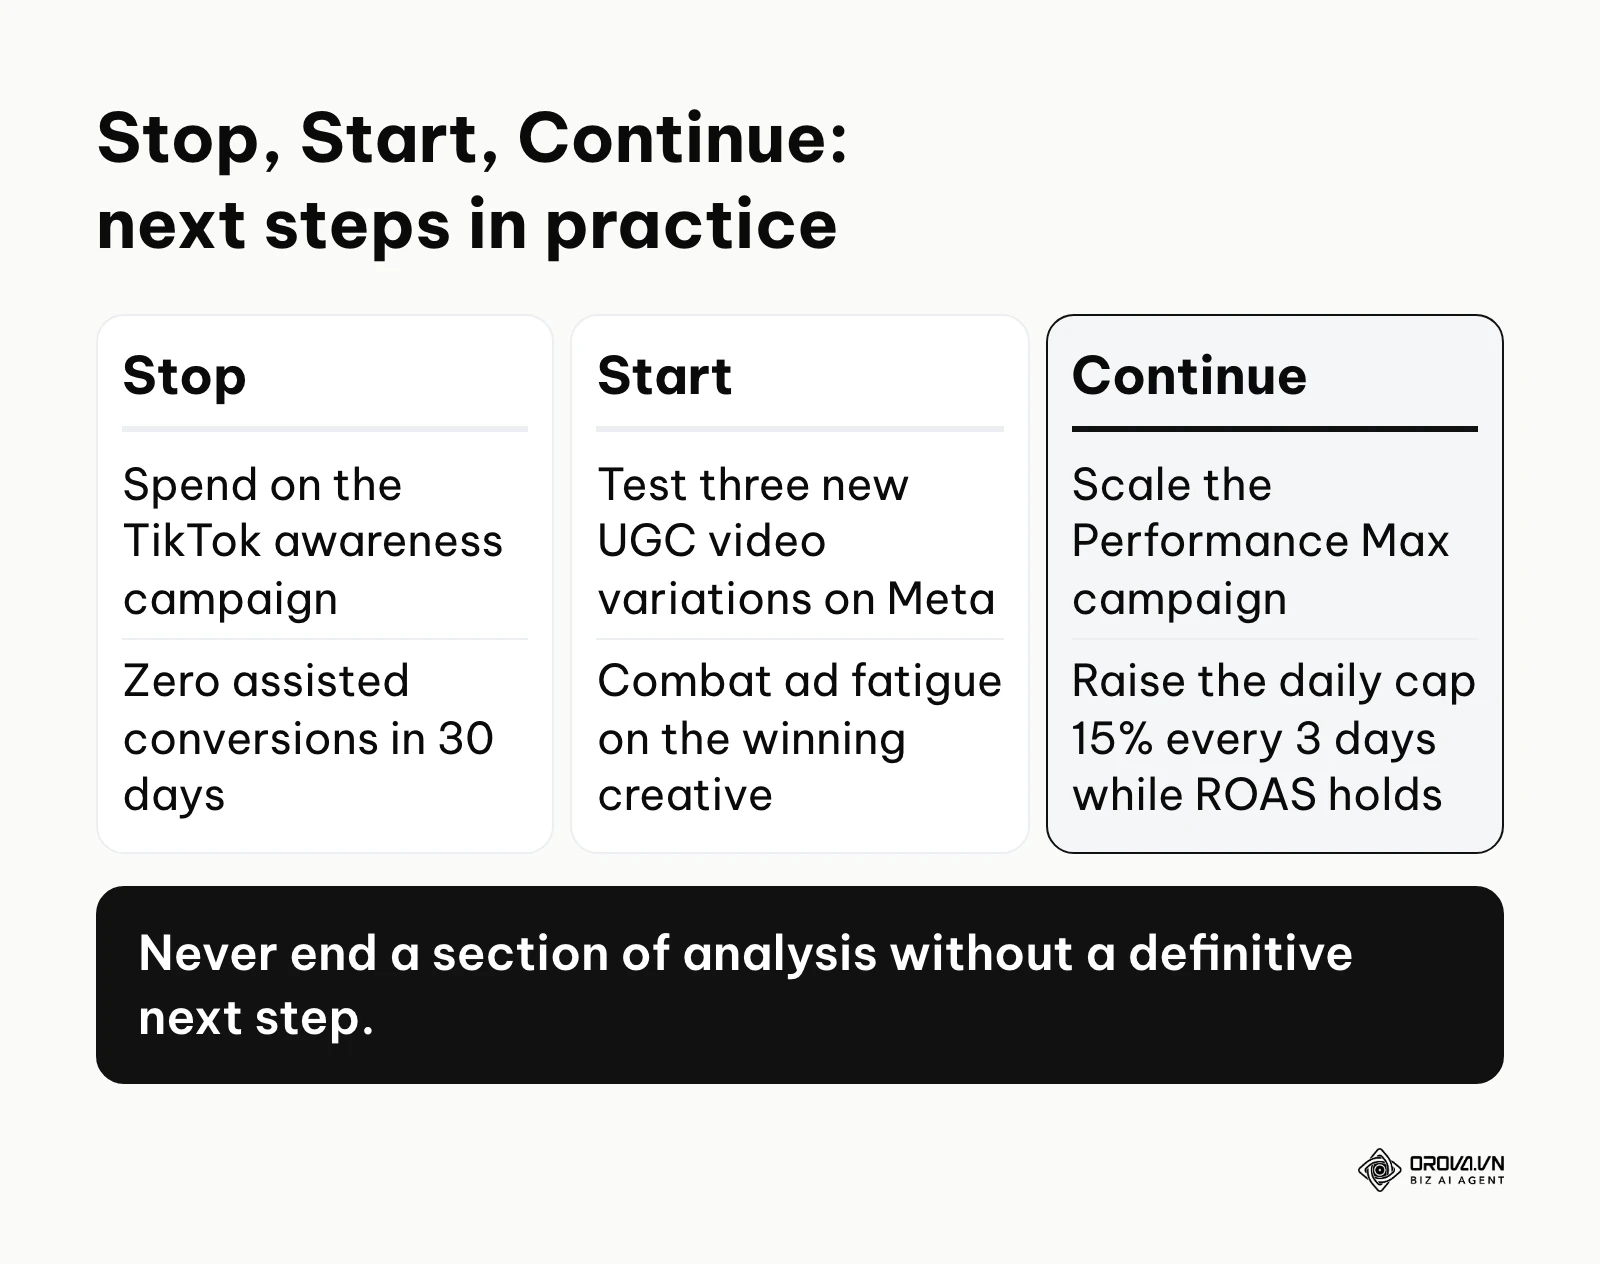
- Stop: "We are stopping all spend on the TikTok awareness campaign, as it has generated zero assisted conversions in 30 days."
- Start: "We will start testing three new UGC (User Generated Content) video variations on Meta by Thursday to combat ad fatigue on our winning creative."
- Continue: "We will continue scaling the Google Performance Max campaign, increasing the daily budget cap by 15% every 3 days as long as ROAS stays above 300%."
Step 6: Automate the delivery and format
Manual reporting introduces human error, causes delays, and wastes valuable optimization time. If you are spending 5 hours a week building a report, that is 5 hours you are not spending improving the campaigns.
Connect your data sources via API to a visualization tool (like Looker Studio, Tableau, or PowerBI) and schedule an automated PDF export or email link. Your job is not to build the charts every week; your job is to log in, review the automatically generated charts, and write the strategic commentary (using the OIR framework) that accompanies them. Automation handles the what; you handle the so what.
OROVA ADS applies AI Agent to automate and optimize ad performance on Google, Meta and TikTok. Scale your budget safely, monitor 24/7 and expand your business quickly.
Experience the solution at orova.vn/ads
Deep dive: The fundamental differences between In-house and Agency reporting
A report designed to secure a retainer renewal for an external agency looks vastly different from a report designed to secure internal budget approval from a board of directors. Failing to understand these nuances leads to severe miscommunication and misaligned expectations.
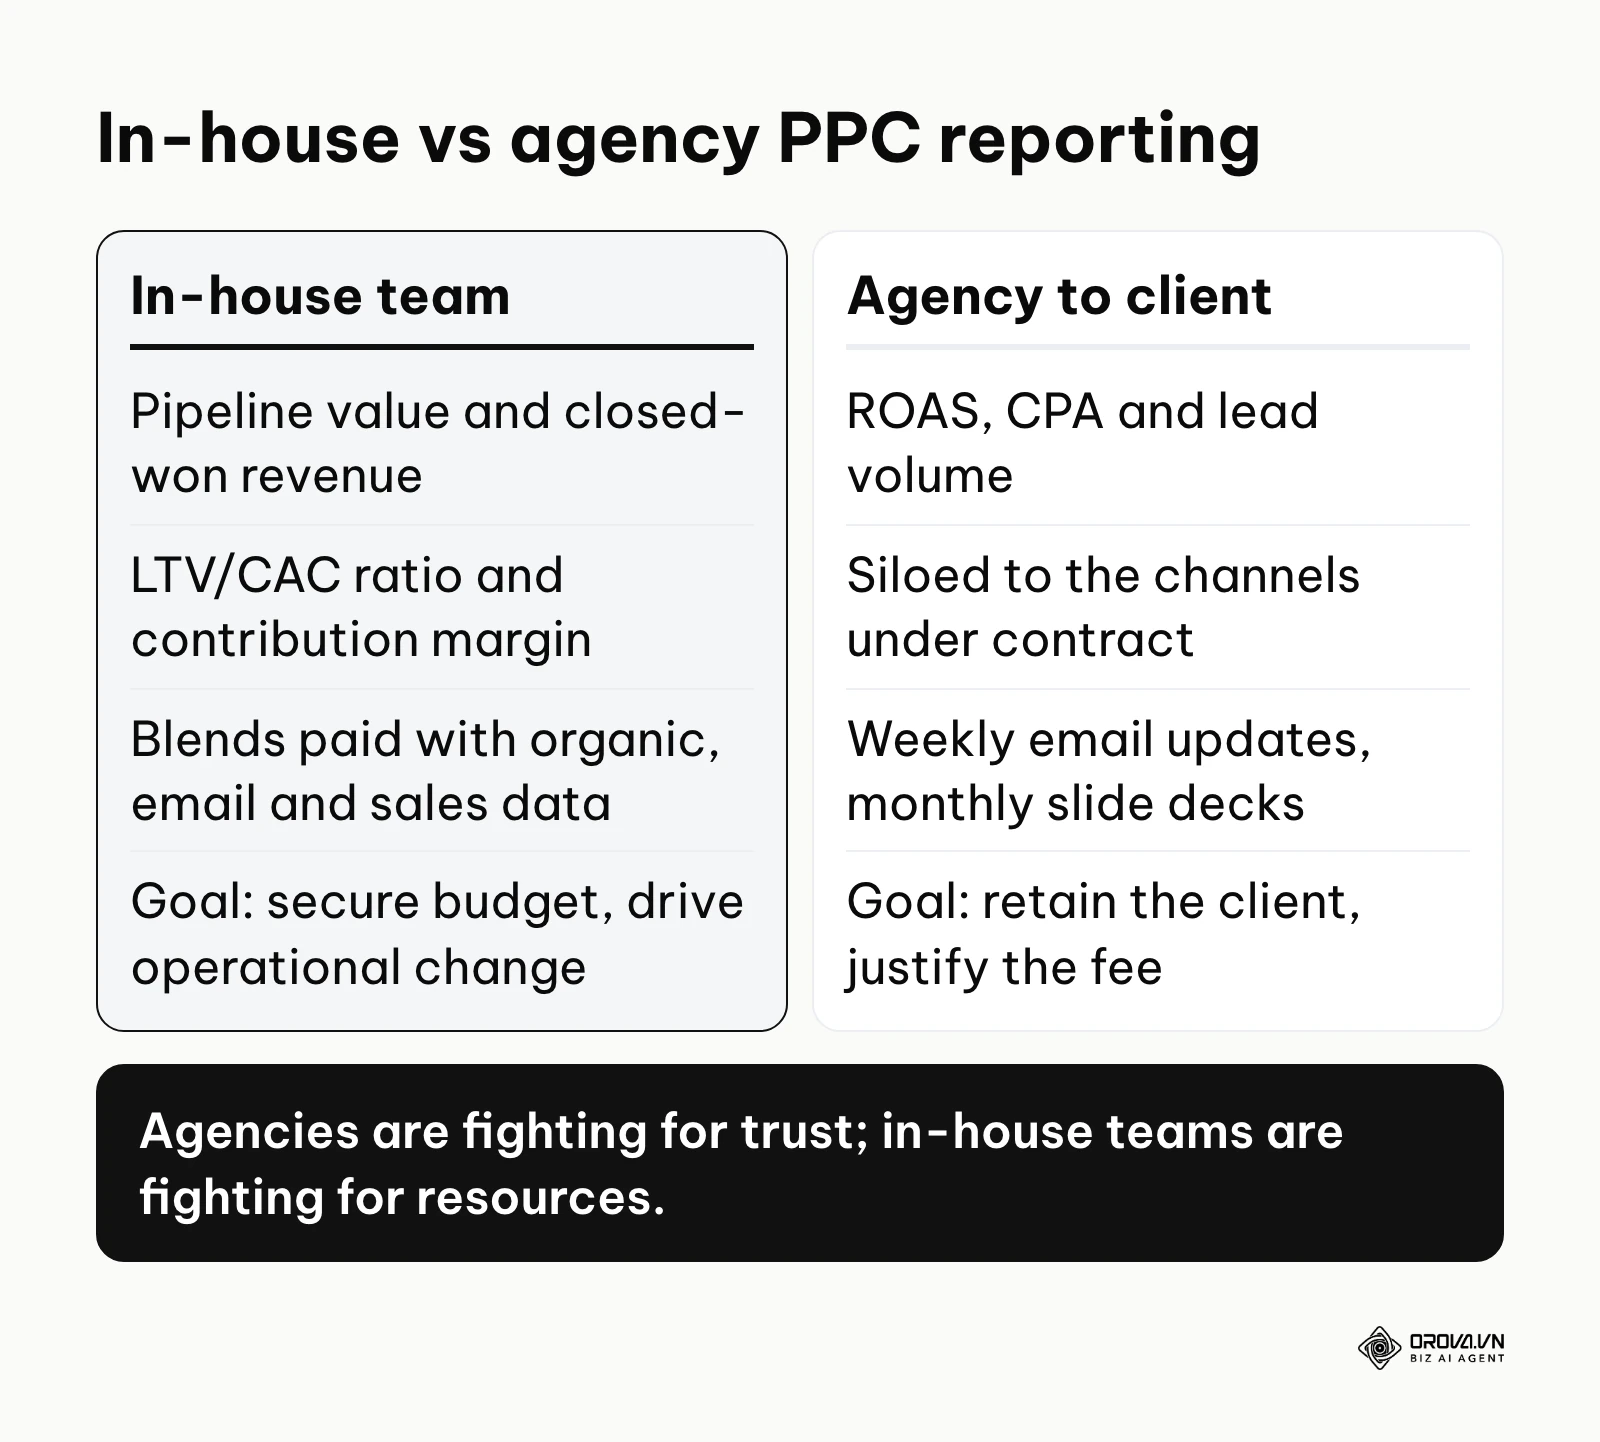
The way you present data has to match how your organization is structured. Agencies are fighting for trust; in-house teams are fighting for resources.
| Feature / Consideration | In-house Team Approach | Agency to Client Approach | Weakness / Trade-off |
|---|---|---|---|
| Primary Metric Focus | Deep funnel metrics: Pipeline value, Closed-won revenue, LTV/CAC ratio, Contribution Margin. | Platform metrics: Return on Ad Spend (ROAS), Cost Per Action (CPA), Volume, Lead Quantity. | Agencies often lack deep CRM visibility or offline conversion data; In-house teams can get bogged down in endless attribution arguments. |
| Narrative Tone | Highly critical, internally focused on operational bottlenecks, unit economics, and cross-department dependencies. | Professional, educational, heavily focused on justifying the strategy, demonstrating value, and highlighting "wins." | Agencies may unintentionally sugarcoat bad news to save the retainer; In-house reports can become too granular and pessimistic for executives. |
| Frequency of Delivery | Often real-time dashboards combined with strict monthly strategic reviews and daily Slack updates. | Usually rigid weekly status updates via email and formal monthly slide decks via Zoom. | Real-time data can cause panic in-house among non-marketers; weekly agency reports often lack enough statistical significance to act on. |
| Integration Level | Blends paid data seamlessly with organic, email, and sales team performance (holistic view). | Strictly siloed to the specific channels the agency is contracted to manage. | In-house models are much harder to build technically; agency models provide a narrow, fragmented view of the business. |
| Goal of the Report | Secure more budget, prove departmental value, drive operational changes. | Retain the client, justify the management fee, upsell new services or channels. | In-house can become territorial; Agencies can become overly defensive. |
Navigating the In-House Battlefield
If you are working in-house, your goal is to speak the language of finance. You must connect marketing metrics to the P&L (Profit and Loss statement). When requesting more budget, you cannot say, "We need ten thousand dollars more because CPCs are low." You must say something like (illustrative figures): "Based on our current LTV to CAC ratio of 4:1, an additional ten thousand dollars should yield around forty thousand dollars in customer lifetime value, with a 60-day payback period."
If the same leadership team also receives an organic search report, keep both documents on one structure so paid and organic results can be read side by side. For the organic side, see this SEO report framework.
Navigating the Agency-Client Relationship
If you are at an agency, your primary goal is to build trust through radical transparency and demonstrate that you are a responsible, strategic steward of the client's money. You must bridge the gap between their business goals and platform reality. To streamline this, you should rely on a robust marketing report guide to structure your client-facing decks, ensuring every slide serves a purpose in building the narrative of value.
The masterclass on communicating bad PPC performance
This is the single hardest skill to master in digital marketing. Performance will inevitably drop. Ad accounts get unexpectedly suspended, algorithms undergo massive unannounced updates, tracking breaks, and competitors launch highly aggressive sales. How you report these "bad numbers" dictates whether you keep your job or lose the client.
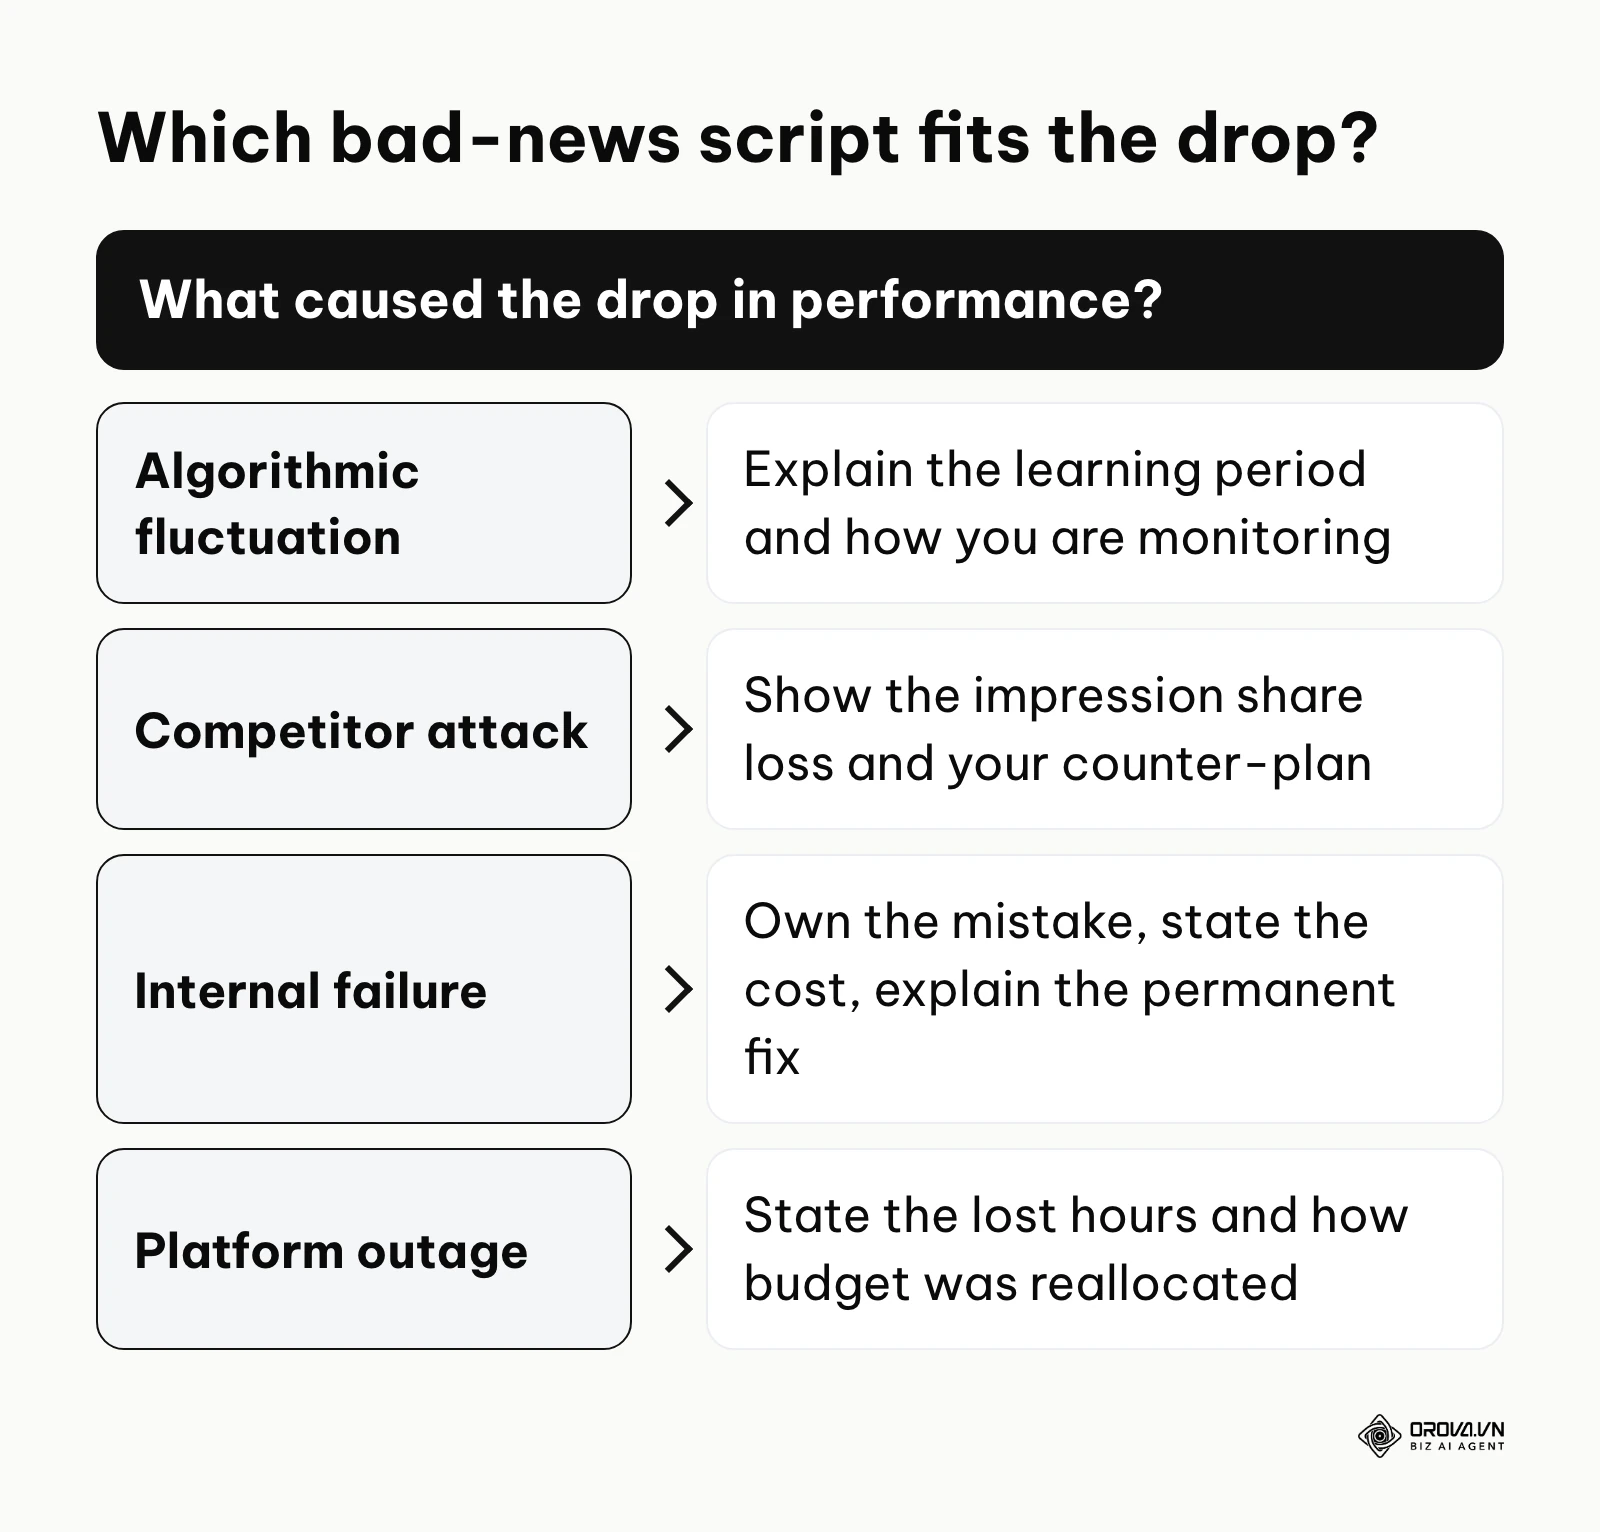
The fundamental, unbreakable rule is: Never let the stakeholder find the bad news themselves. If they discover a massive drop in ROAS by casually checking the dashboard on a Sunday night, you have lost their trust. By the time they ask you about it, they have already formulated a negative opinion. You must lead the conversation.
The "Bad News" Scripting Framework (illustrative scripts):
- The Algorithmic Fluctuation (The "Wait and See"):
- Situation: Google transitions your campaigns to a new Value-Based Bidding model, causing CPA to spike temporarily as the machine learning calibrates.
- Script: "In this week's data, you will notice our CPA increased by 25%. I want to address this upfront. This was an expected outcome of upgrading our bidding strategy to target higher-LTV users, which we discussed last week. Smart bidding needs a learning period to calibrate to these new signals. We are monitoring the search terms daily to prevent extreme waste, and we project CPA to normalize below our original baseline by week three. No immediate action is required on your end, we are actively managing the transition."
- The External Threat (The "Competitor Attack"):
- Situation: A massive new competitor, heavily funded, enters the market and bids aggressively on your core brand terms.
- Script: "Our impression share on core brand terms dropped from 90% to 65% this month, leading to a 15% drop in overall lead volume. A new competitor (Company X) has entered the auction with highly aggressive bids, driving up the floor price. To protect our baseline volume, I recommend temporarily increasing our Target CPA constraints by 15% to maintain visibility. Simultaneously, I have drafted a brief for the creative team to launch a counter-campaign highlighting our superior feature set and faster onboarding."
- The Internal Failure (The "We Messed Up"):
- Situation: An ad was left running to a broken 404 page over the weekend due to a URL typo, wasting budget.
- Script: "I need to flag an error on our end. Between Friday evening and Monday morning, Campaign Y directed traffic to a broken landing page, resulting in wasted spend, which I have itemized in the appendix. I have paused the campaign and requested a refund credit from the platform (though this is not guaranteed). More importantly, to ensure this never happens again, I have implemented an automated script that will pause all ads globally if our server returns a 404 error. The issue is resolved, and we have instituted new QA protocols." (Own the mistake, state the cost, explain the permanent fix).
- The Platform Outage (The "Act of God"):
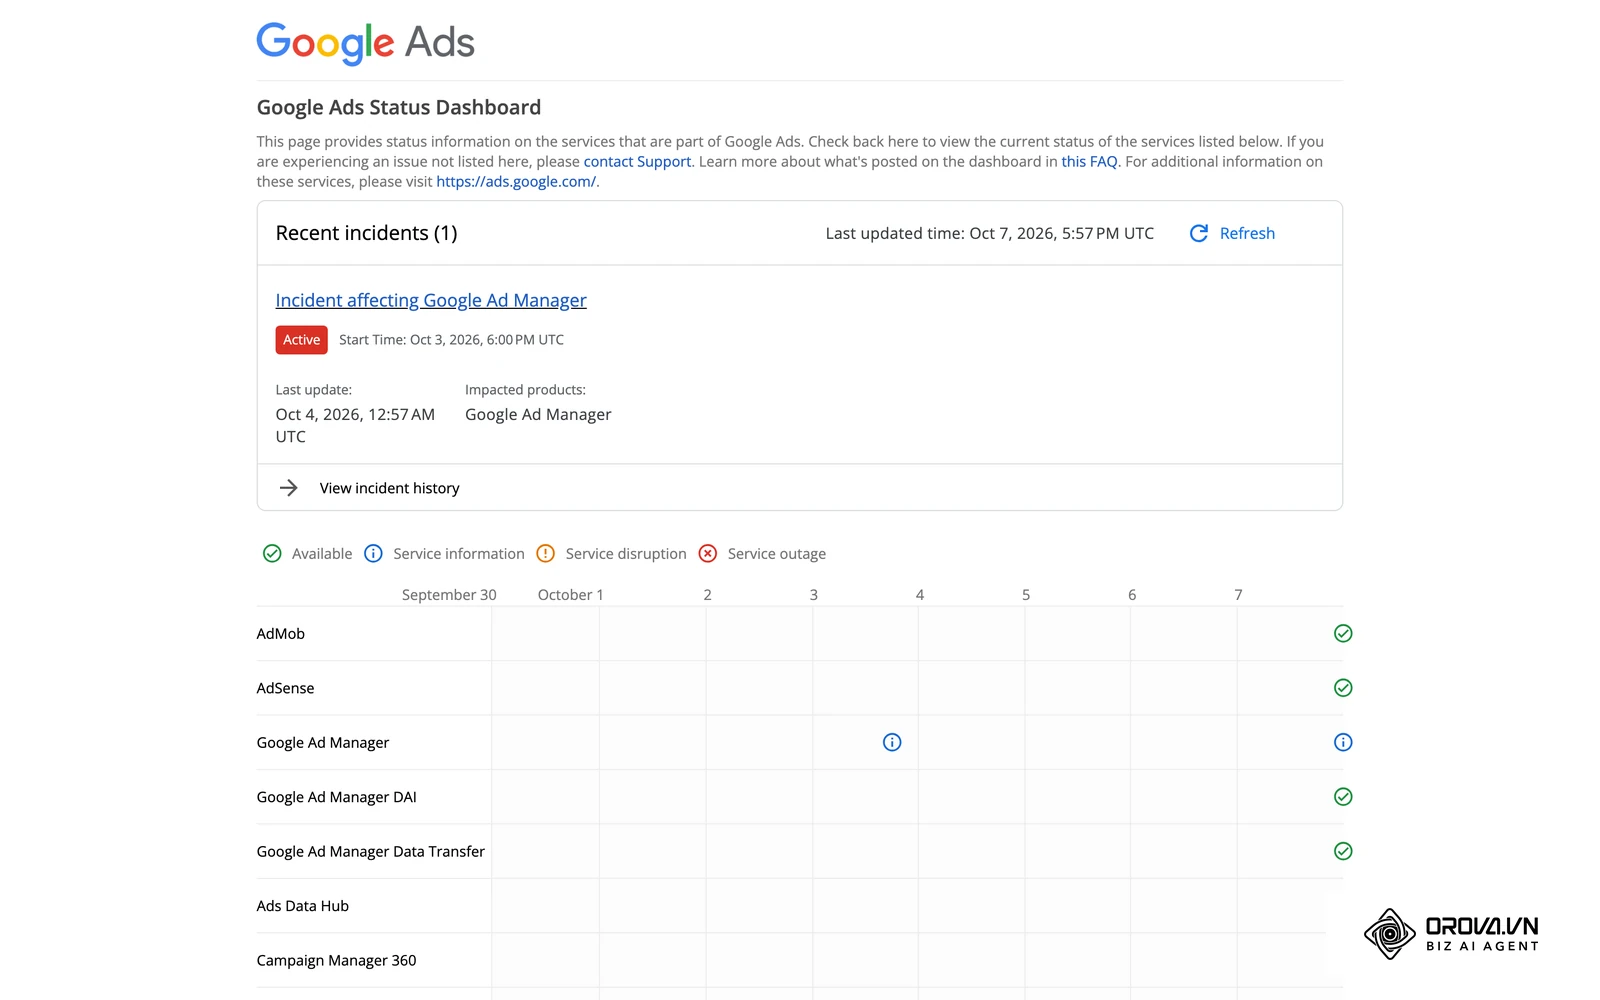
- Situation (hypothetical): Meta ad delivery is disrupted for 6 hours on Black Friday.
- Script: "Meta ad delivery was disrupted from 10 AM to 4 PM today, and our campaigns stopped spending during that window. Because we lost 6 hours of prime conversion time, our daily ROAS is currently at 1.5x instead of our 3x target. We have reallocated 30% of today's remaining Meta budget into Google Search to capture high-intent users looking for our Black Friday deals to mitigate the shortfall."
Illustrative example:
- Context: An agency account manager is reporting to a high-stress e-commerce client after a terrible Black Friday performance where ROAS fell far below the profitable threshold.
- Steps taken: The manager avoids sending a generic automated email hoping the client doesn't notice. Instead, they schedule a 15-minute emergency call. They present the data, immediately acknowledge the ROAS failure, and then present a cohort analysis showing that while initial acquisition cost was high, the historical data suggests these specific holiday buyers have a 40% higher repeat purchase rate over the next 6 months.
- Hurdle and resolution: The client is furious about the upfront cash loss. The manager uses click tracking data to prove the users were highly engaged (adding to cart) but deterred by a sudden competitor offering a larger discount. They pivot the conversation from "failed ads" to "optimizing the lifetime value of acquired customers and improving the checkout experience."
- Result: The client calms down, agrees to implement a robust email sequence to drive repeat purchases, and retains the agency because they provided a holistic business solution, not just a defensive ad apology.
Measuring success: Core KPIs that actually drive business value
Stop reporting on metrics that cannot pay the bills. Impressions, clicks, and CTR are diagnostic metrics; they are useful for you, the media buyer, to optimize the account, but they are not success metrics. You must relentlessly train your stakeholders to focus on the overarching numbers that impact the bottom line. For definitions of the diagnostic layer itself, see this guide to ad performance metrics.
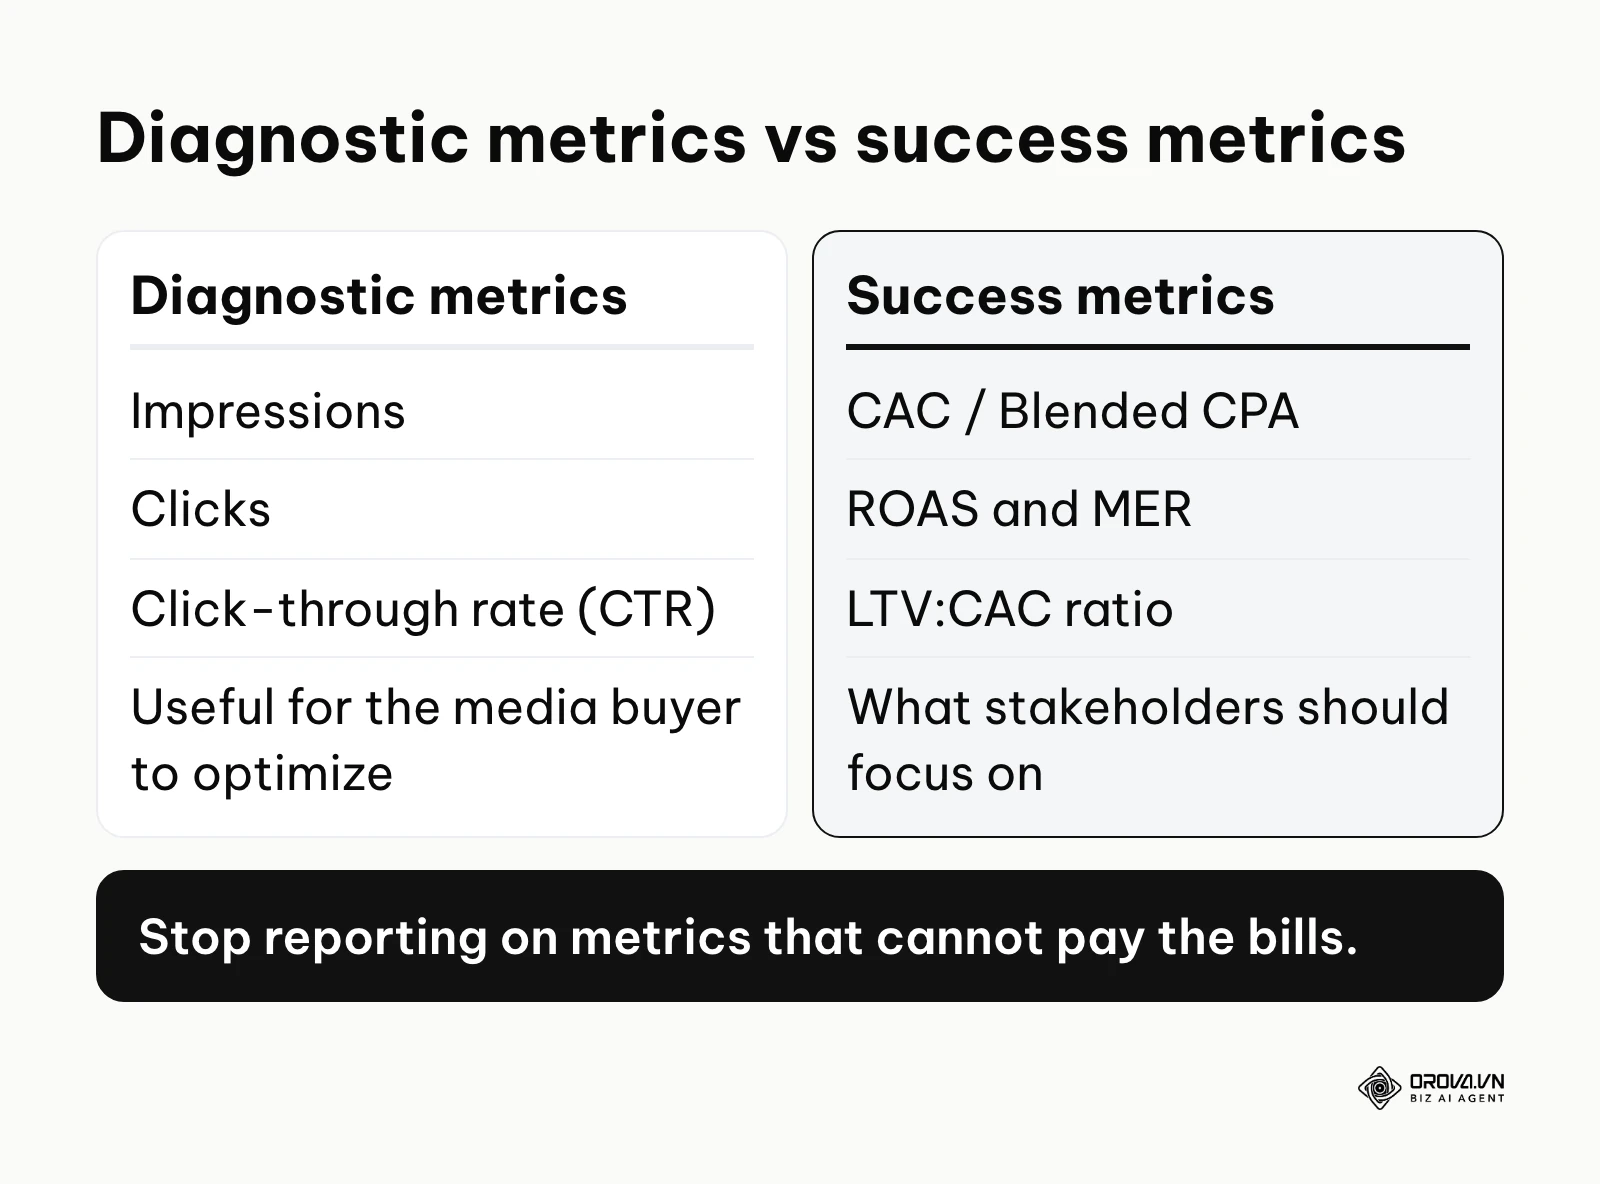
The Hierarchy of PPC Metrics
| Key Performance Indicator (KPI) | True Business Meaning | Warning Threshold / When to act |
|---|---|---|
| Customer Acquisition Cost (CAC) / Blended CPA | Exactly how much it costs the business to acquire a paying user across all touchpoints. | When CAC exceeds the gross margin of the product for more than 14 consecutive days. Immediate budget pullback required. |
| Return on Ad Spend (ROAS) | For every dollar spent on ads, how many dollars of revenue are generated directly from the platform's attribution view. | When ROAS falls below the specific break-even point determined by your finance department. |
| Marketing Efficiency Ratio (MER) | Total business revenue divided by total ad spend (blended across all channels). This ignores attribution arguments. | When overall ad spend increases but MER decreases significantly, indicating you are hitting diminishing returns on scaling. |
| LTV:CAC Ratio | The lifetime value of a customer compared to what you paid to get them. The gold standard of growth. | A ratio below the target your finance team sets means you are acquiring customers too expensively or they are churning too fast. |
| Conversion Rate (CVR) | The percentage of people who clicked an ad and actually took the desired action. | A sudden, sharp week-over-week drop often indicates a broken tracking pixel, a site speed issue, or a broken landing page. |
| Search Impression Share (IS) | Out of all the times your ad could have shown in the auction, how often did it actually show. | When brand IS falls well below its usual level, which can mean competitors are bidding on your most loyal searchers. |
Always present these metrics with a historical comparison (e.g., Week-over-Week or Year-over-Year) to provide context. Saying "Our CPA is 50 dollars" is a meaningless statement unless we know it was 75 dollars last month (a huge win) or 20 dollars last month (a massive crisis).
Want to scale your budget but afraid of breaking performance? 📉
Integrate OROVA ADS now - an AI Agent that automatically monitors and optimizes Google, Meta, TikTok ads 24/7. Now, expanding and replicating your Performance Ads team is just one click away.
🚀 Try it now at: orova.vn/ads
Common mistakes that ruin your analytical credibility
Even highly experienced marketers fall into traps that dilute the impact of their reporting. Avoid these specific pitfalls to maintain your position as a trusted advisor rather than a simple data exporter.
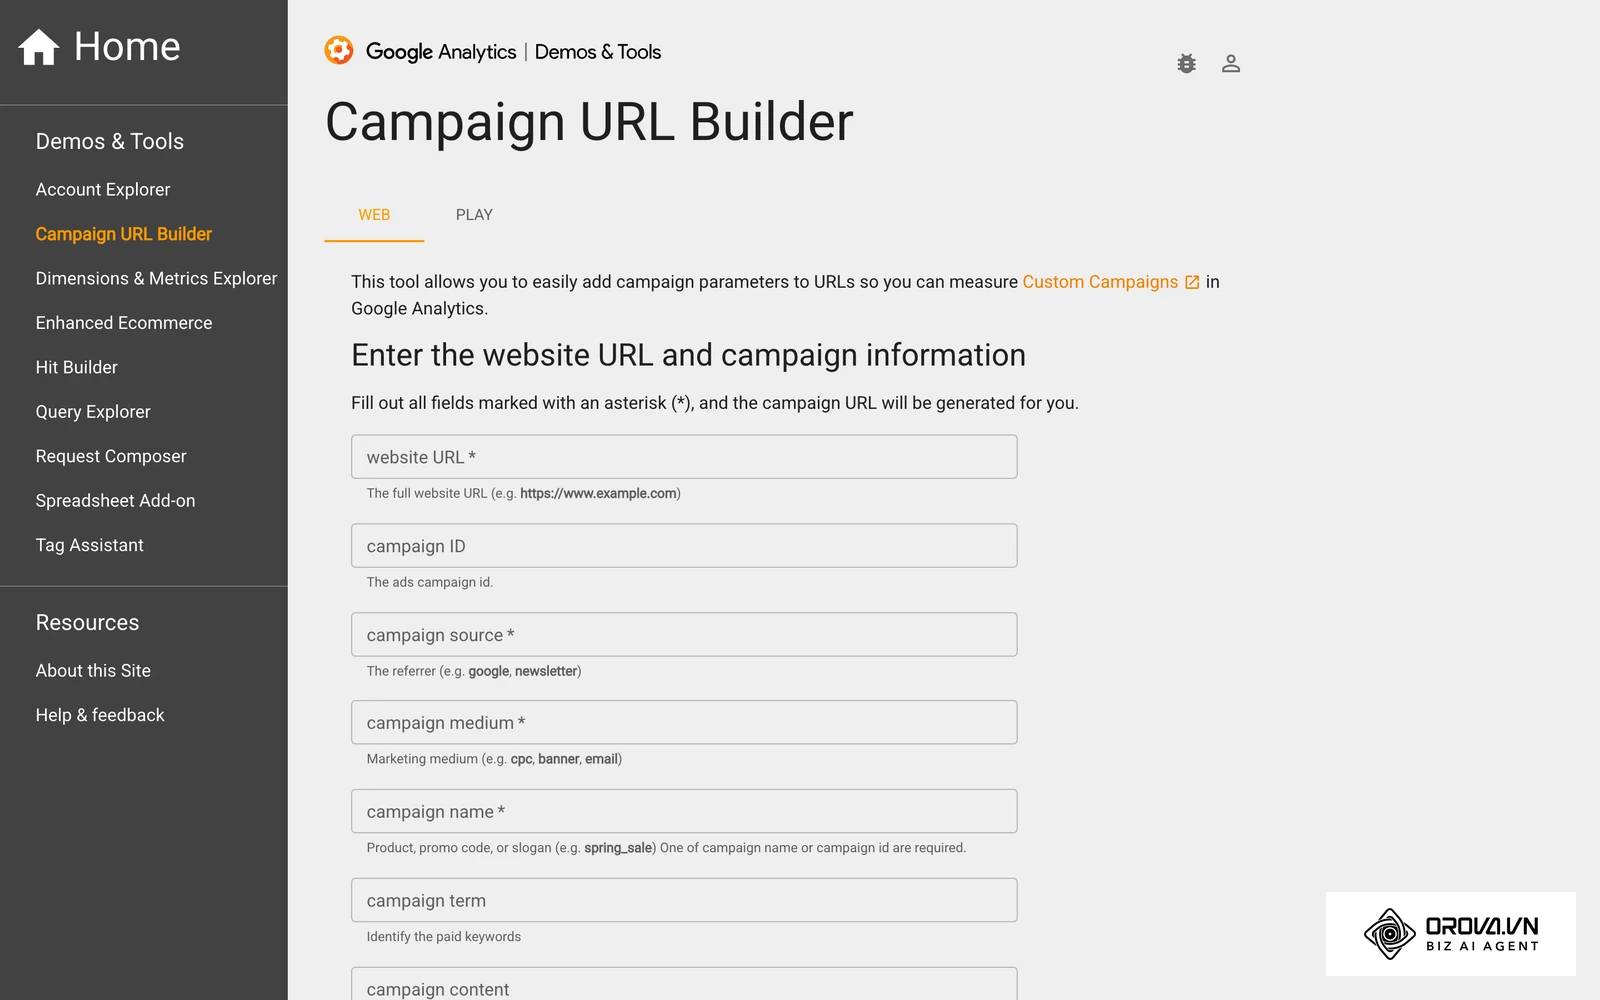
- The "Data Puke" Dashboard: Cramming 25 different charts, 10 scorecards, and a massive pivot table onto a single screen does not make you look smart; it makes the reader overwhelmed. If everything is important, nothing is important.
- Consequence: Stakeholders suffer cognitive overload and stop looking at the report entirely.
- Fix: Restrict the top executive page of your report to a maximum of 5 core business KPIs. Put the granular platform data on subsequent, clearly labeled optional pages.
- Reporting on "Assisted Conversions" Without Strict Rules: Claiming credit for a massive enterprise software sale just because someone saw a Facebook retargeting ad three weeks before buying via an organic search is dangerous.
- Consequence: Your reported marketing revenue far exceeds the actual cash in the bank, leading to an immediate loss of trust from the finance team and CEO.
- Fix: Agree on a strict attribution model upfront (e.g., Data-Driven Attribution in GA4) and stick to it consistently. Never double-count revenue across platforms.
- Ignoring the Post-Click Experience (Landing Pages): Your account structure might be perfect, but if the landing page converts at 0.5%, the campaign fails. Reporting only on CPC and CTR ignores half the equation.
- Consequence: You spend hours tweaking ad copy and bids when the real issue is a slow website or a confusing checkout process.
- Fix: Always include landing page conversion rates and bounce rates alongside ad metrics.
- Failing to Document the Changes (The Missing Changelog): When performance spikes, the first question is always "What did you do?" If you cannot remember the specific bid adjustment or ad launch you made two weeks ago, you look incompetent.
- Consequence: Inability to replicate success or systematically diagnose sudden failures.
- Fix: Maintain a strict "Changelog" document alongside your report detailing exactly what optimizations were made, when they were made, and why.
- Letting Platforms Grade Their Own Homework: Relying solely on Meta's reported conversions or Google's reported conversions without cross-referencing a third-party source (like Google Analytics 4, HubSpot, or Salesforce).
- Consequence: Over-reporting success due to platforms claiming generous view-through attribution windows that the business doesn't recognize.
- Fix: Use backend CRM data as the final source of truth for all financial reporting and true ROI calculations.
- Ignoring Statistical Significance: Pausing an ad or declaring a winner in an A/B test after 3 conversions.
- Consequence: You optimize based on random chance rather than true data, leading to unstable long-term performance.
- Fix: Use a statistical significance calculator. Do not make major decisions until a test reaches 90-95% confidence.
Illustrative example:
- Context: An eager junior marketer builds a 30-slide weekly deck for a small local service business, detailing exact device breakdowns (Mobile vs Desktop), demographic age shifts, and hourly bid adjustment analysis.
- Steps taken: The client ignores the report for three consecutive weeks and complains they don't know what marketing is doing. The marketer realizes the mistake, deletes 27 slides, and sends a single page containing: Total Spend, Total Leads, Cost Per Lead, and a single bullet point suggesting a new promotional offer.
- Hurdle and resolution: The client immediately replies, approving the new offer. The complex, granular data was creating immense friction; radical simplicity drove action.
- Result: The reporting process takes 90% less time to produce and actually generates tangible business decisions.
PPC reporting trends in the next few years: an author's perspective
Based on the rapid evolution of ad tech, machine learning, and global privacy regulations, the way we report on performance is likely to keep changing over the next few years. Here is how I see the landscape shifting, and how you must adapt to stay relevant.
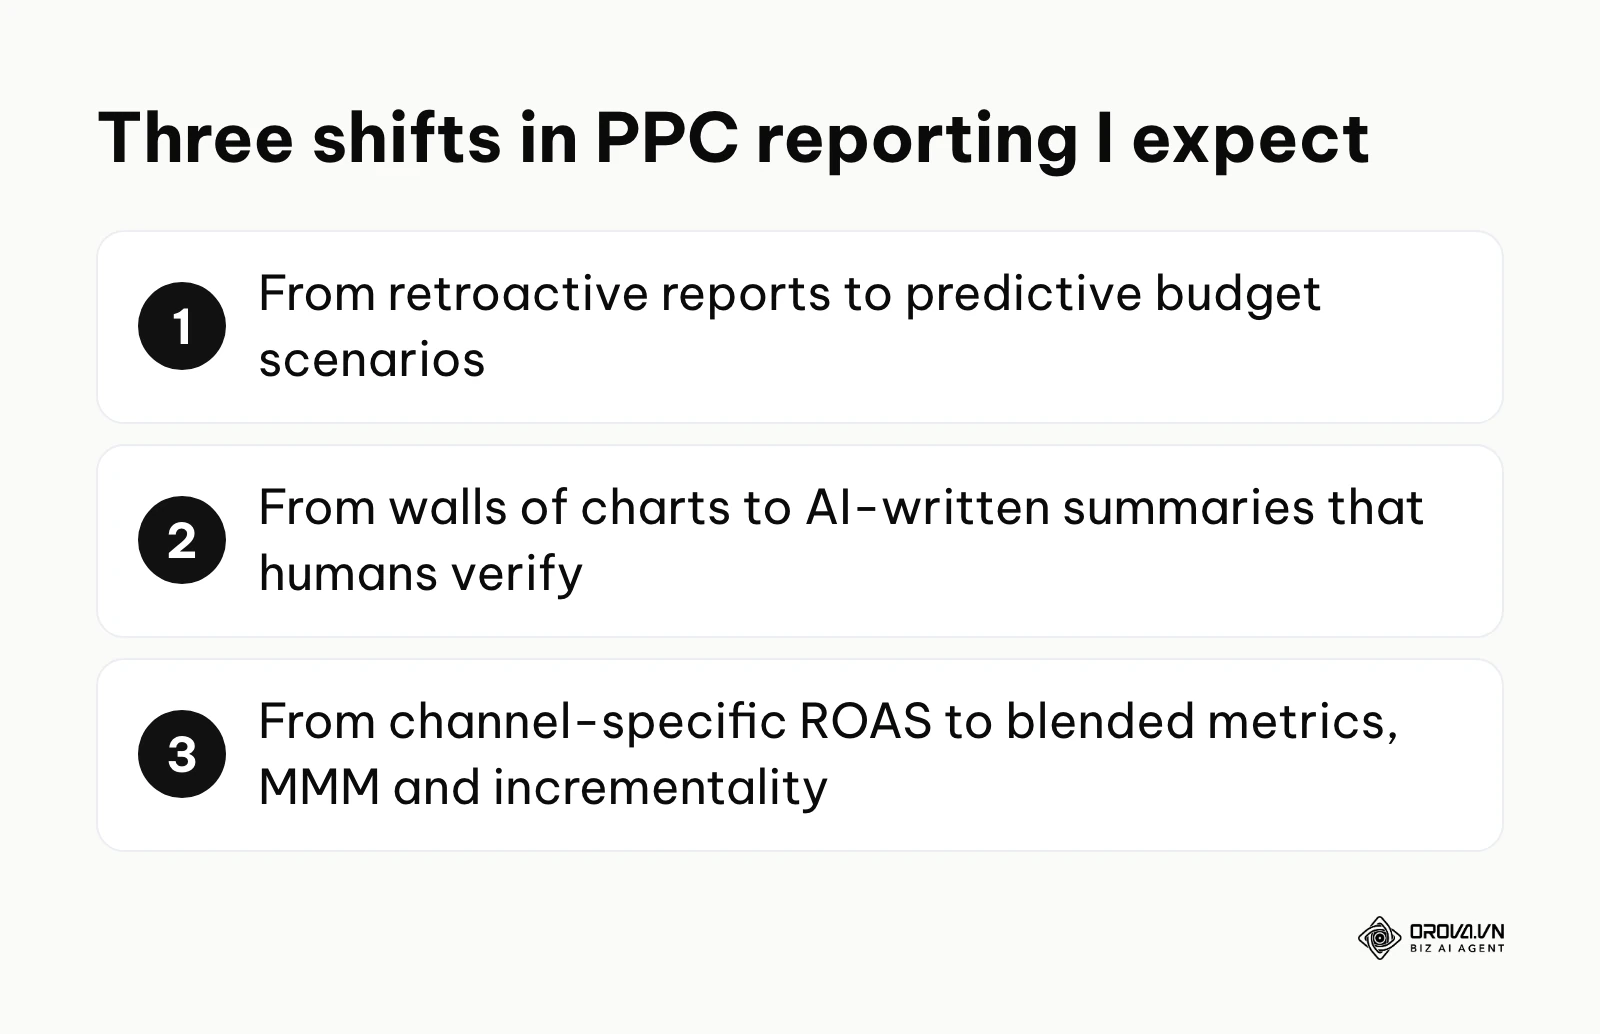
Predictive analytics will replace retroactive reporting
Currently, we spend hours looking at last week's data to decide what to do next week. I believe this habit will look increasingly outdated. Reports will shift from "Here is what happened" to "Here is what the model predicts will happen if we increase the budget by 20% or launch in a new market." Why it matters: You need to start familiarizing yourself with statistical forecasting and budget scenario planning. If your only skill is reading historical charts, a machine will replace you. Your value is in steering the ship, not just reading the compass.
AI-generated narrative summaries and Agentic Workflows
We are already seeing the integration of Large Language Models (LLMs) into data visualization tools. I expect many stakeholders will prefer a customized, AI-generated paragraph summarizing the exact insights relevant to their role, delivered via Slack, over a wall of charts. An AI Google Ads agent can pull the data and flag anomalies, and an LLM can draft the executive summary. Some AI agents will also act on the data within rules that humans set. Why it matters: Your value will shift from "finding the data" to "verifying the AI's logic," setting the macro-constraints for the AI, and managing the higher-level business strategy that algorithms cannot comprehend (like brand positioning and offline supply chain issues).
Privacy regulations will force a return to "Blended metrics" and MMM
With third-party cookies restricted in several browsers, tracking prevention such as Safari's ITP, and signal loss from mobile privacy changes, precise multi-touch, platform-specific attribution is getting harder to trust. I suspect more mature marketing teams will stop treating channel-specific ROAS as the absolute truth.
Instead, they will rely heavily on Marketing Efficiency Ratio (MER) and Media Mix Modeling (MMM)—a statistical analysis that looks at historical aggregate data to determine the impact of marketing channels without needing individual user tracking. Why it matters: Stop promising stakeholders that you can track every single click to a purchase. You must start educating them now on probabilistic modeling, incrementality testing (holdout groups), and holistic business metrics. This is my reading of the trend, not a certainty; the large ad platforms could still push their own proprietary measurement solutions.
Frequently asked questions about PPC reporting
How often should I send a PPC report?
This depends entirely on the audience. For tactical execution (the marketing team), dashboards should be checked daily, with a formal review weekly to adjust bids and creatives. For strategic alignment (C-level executives or clients), a comprehensive report should only be delivered monthly. Sending executive reports too frequently causes unnecessary panic over normal algorithmic volatility.
What is a good ROAS to aim for?
There is no universal benchmark, and chasing competitor ROAS is a trap. A "good" ROAS depends entirely on your specific profit margins. For illustration: if you sell digital software with a 90% margin, a 200% ROAS is incredibly profitable. If you sell physical hardware with a 10% margin, a 500% ROAS might still mean you are losing money on every single sale after shipping and operational costs. Always calculate your unique break-even ROAS before launching a campaign.
Why do the numbers in Google Ads not match my CRM?
Discrepancies are completely unavoidable due to different attribution models, ad blockers, cookie expiration, and cross-device tracking issues. Google Ads claims credit based on interactions (clicks/views) and often uses data-driven attribution. Your CRM claims credit based on the final transaction, often relying on first-click or last-click UTMs. Expect some variance, and document the typical gap for your own account. Always use the CRM as the final source of financial truth.
How will AI change how we build these reports?
AI will eliminate the manual labor of aggregating data, building charts, and formatting slides. AI tools can instantly map data sources, highlight statistical anomalies in seconds, and draft initial commentary. However, AI lacks the organizational context (e.g., "The CEO is worried about cash flow this month because of a new warehouse lease") required to make the final, nuanced strategic recommendation.
Should I include competitor data in my PPC reports?
Yes, but only if it is actionable. Showing that a competitor is outspending you is only useful if you can tie it to your own performance drops (e.g., "Impression share dropped due to Competitor X"). Use tools like Auction Insights in Google Ads to monitor overlap rate and outranking share to provide context to your CPC fluctuations.
Where to begin your reporting overhaul?
You cannot change your entire reporting infrastructure overnight. If you try, you will break your current workflow, lose historical data, and frustrate your stakeholders who are used to the old format. Start small based on your most urgent pain point today. Follow this 30-day roadmap:
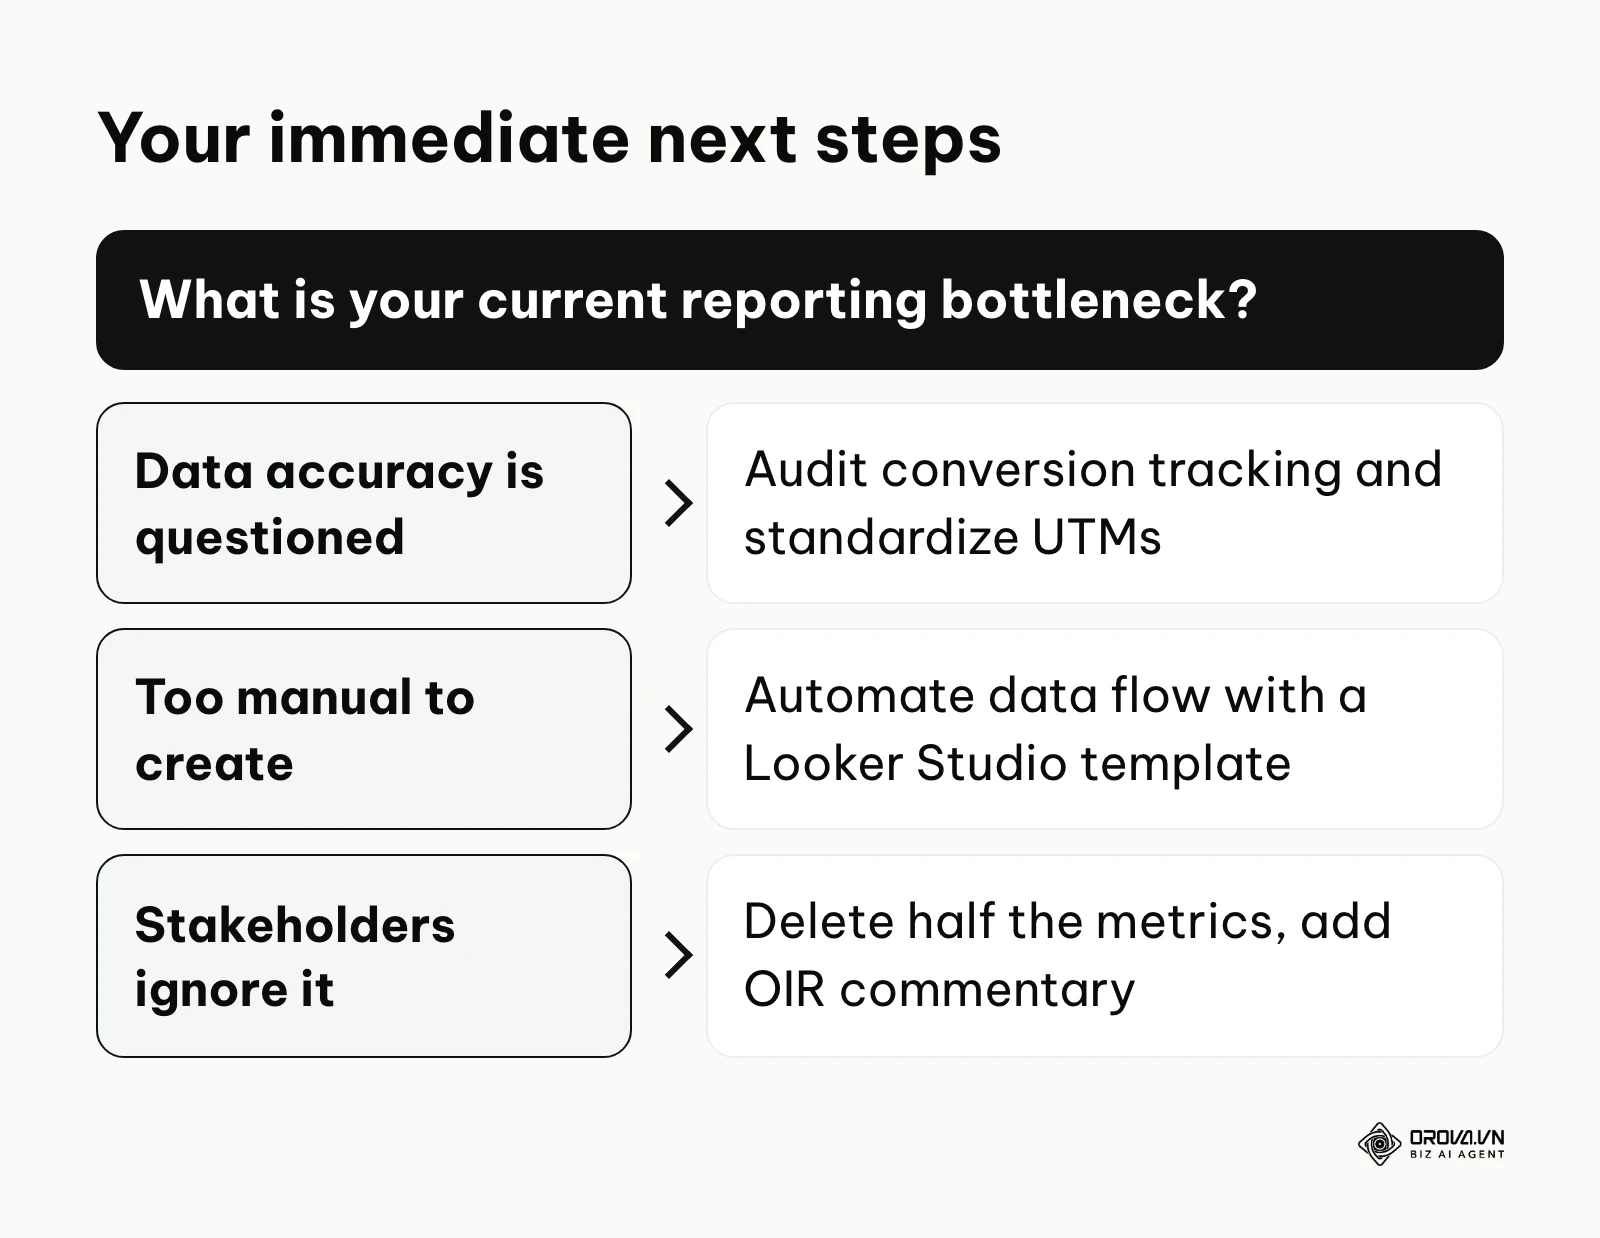
If your data is constantly questioned for accuracy (Week 1): Stop building reports immediately. Spend your next working session auditing your conversion tracking. Check your tag firing rules in Google Tag Manager, standardize your UTM spreadsheet, ensure your CRM is capturing the right parameters, and ensure you have a single source of truth defined. No visualizations matter if the foundation is rotten.
If you spend more than 4 hours a week manually pulling numbers (Week 2): Your first step is to adopt a template and automate data flow. Open Google Looker Studio, connect your primary Google Ads account to a free, pre-built template (Meta data needs a partner connector or an export), and ensure the basic metrics flow through correctly. Eliminate the repetitive copy-pasting of CSV files before you try to invent complex new metrics. Buy your time back first.
If your stakeholders are ignoring your current reports (Week 3 & 4): For your very next update, delete half of the metrics you usually present. Force yourself to only show the top three business KPIs and write two sentences of explicit, actionable commentary underneath them using the Observation -> Impact -> Recommendation framework. Train your stakeholders to expect strategic insights from your PPC reporting, not a data dump. Present the new, simplified format, ask for feedback, and iterate. ---BAI---
About the author

Builder of Orova
Nguyễn Đỗ Trọng Ân has 8 years of experience in marketing, including 6 years managing market development across Asia. He builds Orova, a Biz AI Agent that never sleeps: it plans, runs and optimizes work for businesses.
Run your business with AI Agents
Orova is the always-on Biz AI Agent — it plans, runs, and optimizes the work for you.
Save time, unlock productivity.