
What are ad performance metrics? A data-driven diagnostic guide

Every day, thousands of businesses pour money into digital advertising, hoping for a profitable return. However, a significant portion of this budget is wasted because marketers frequently rely on gut feelings rather than hard data. If you are struggling to understand why your campaigns are not generating sales, you need a systemic approach to evaluation. By mastering ad performance metrics, you transition from guessing to making highly calculated financial decisions. This guide will explore the exact framework needed to diagnose failing campaigns, distinguish useful data from misleading numbers, and read industry benchmarks without being misled by them.
What are ad performance metrics?
Ad performance metrics are quantifiable data points used to track, measure, and evaluate the effectiveness of advertising campaigns. They are used to determine if marketing budgets generate profitable returns, differing from basic web analytics by focusing specifically on paid traffic costs, conversions, and direct revenue attribution.
Historically, before the digital era, measuring the impact of a billboard or a television commercial was highly subjective. Marketers relied on broad estimates of foot traffic or generic sales bumps. The term itself originated as digital platforms began offering granular, click-by-click tracking capabilities, allowing advertisers to see exactly where their money was going. Today, these numbers form the absolute core of any digital marketing strategy, transforming a creative endeavor into a rigorous mathematical discipline.
However, beginners often confuse these specific advertising indicators with other types of digital measurement. To clarify the boundaries, here is how they differ from related concepts:
| Concept | How it differs | Practical Example |
|---|---|---|
| Web Analytics | Focuses on general website traffic, user behavior, and site speed regardless of the source. | Tracking how long a user spends reading a blog post. |
| Ad Performance Metrics | Focuses strictly on paid traffic, financial costs, and direct revenue returns from specific platforms. | Measuring the cost to acquire a customer via Facebook Ads. |
| SEO Metrics | Focuses on organic, unpaid search engine visibility and keyword rankings over a long period. | Monitoring keyword ranking positions on Google Search results. |
Consider a real-world application. If you open a physical retail store and hand out flyers on the street, you might count how many people walk through the door with a flyer in hand. In the digital world, these metrics act as an automatic counter that not only records who walked in, but exactly how much it cost you to print the flyer they held, and exactly how much money they spent at the register.
The Meaning and Purpose of Ad Performance Metrics
The purpose of these metrics is to provide empirical evidence of marketing effectiveness. They exist to help businesses allocate financial resources to the most profitable channels while eliminating wasted spend. Without them, you are effectively flying blind, making financial decisions based entirely on hope rather than evidence.
These indicators exist to solve a massive problem for business owners and marketing executives: the lack of financial accountability in marketing. For decades, the advertising industry operated on the famous adage that half the money spent on advertising is wasted, but nobody knows which half. These numbers exist specifically to identify the wasted half. They sit squarely in the middle of the broader business picture, acting as the critical bridge between creative campaign execution and executive financial reporting. The creative team produces the assets, the media buyers launch the campaigns, and the metrics determine whether the entire operation was a financial success or a failure.
If you choose to ignore these numbers, you lose the ability to forecast revenue. You will inevitably scale unprofitable campaigns, burning through your cash reserves while wondering why your bank account is shrinking despite generating high traffic. You lose the ability to defend your marketing budget to stakeholders, because you cannot prove that the money spent is returning a profit. Mastering these numbers is the foundational skill required for advanced PPC ad management.
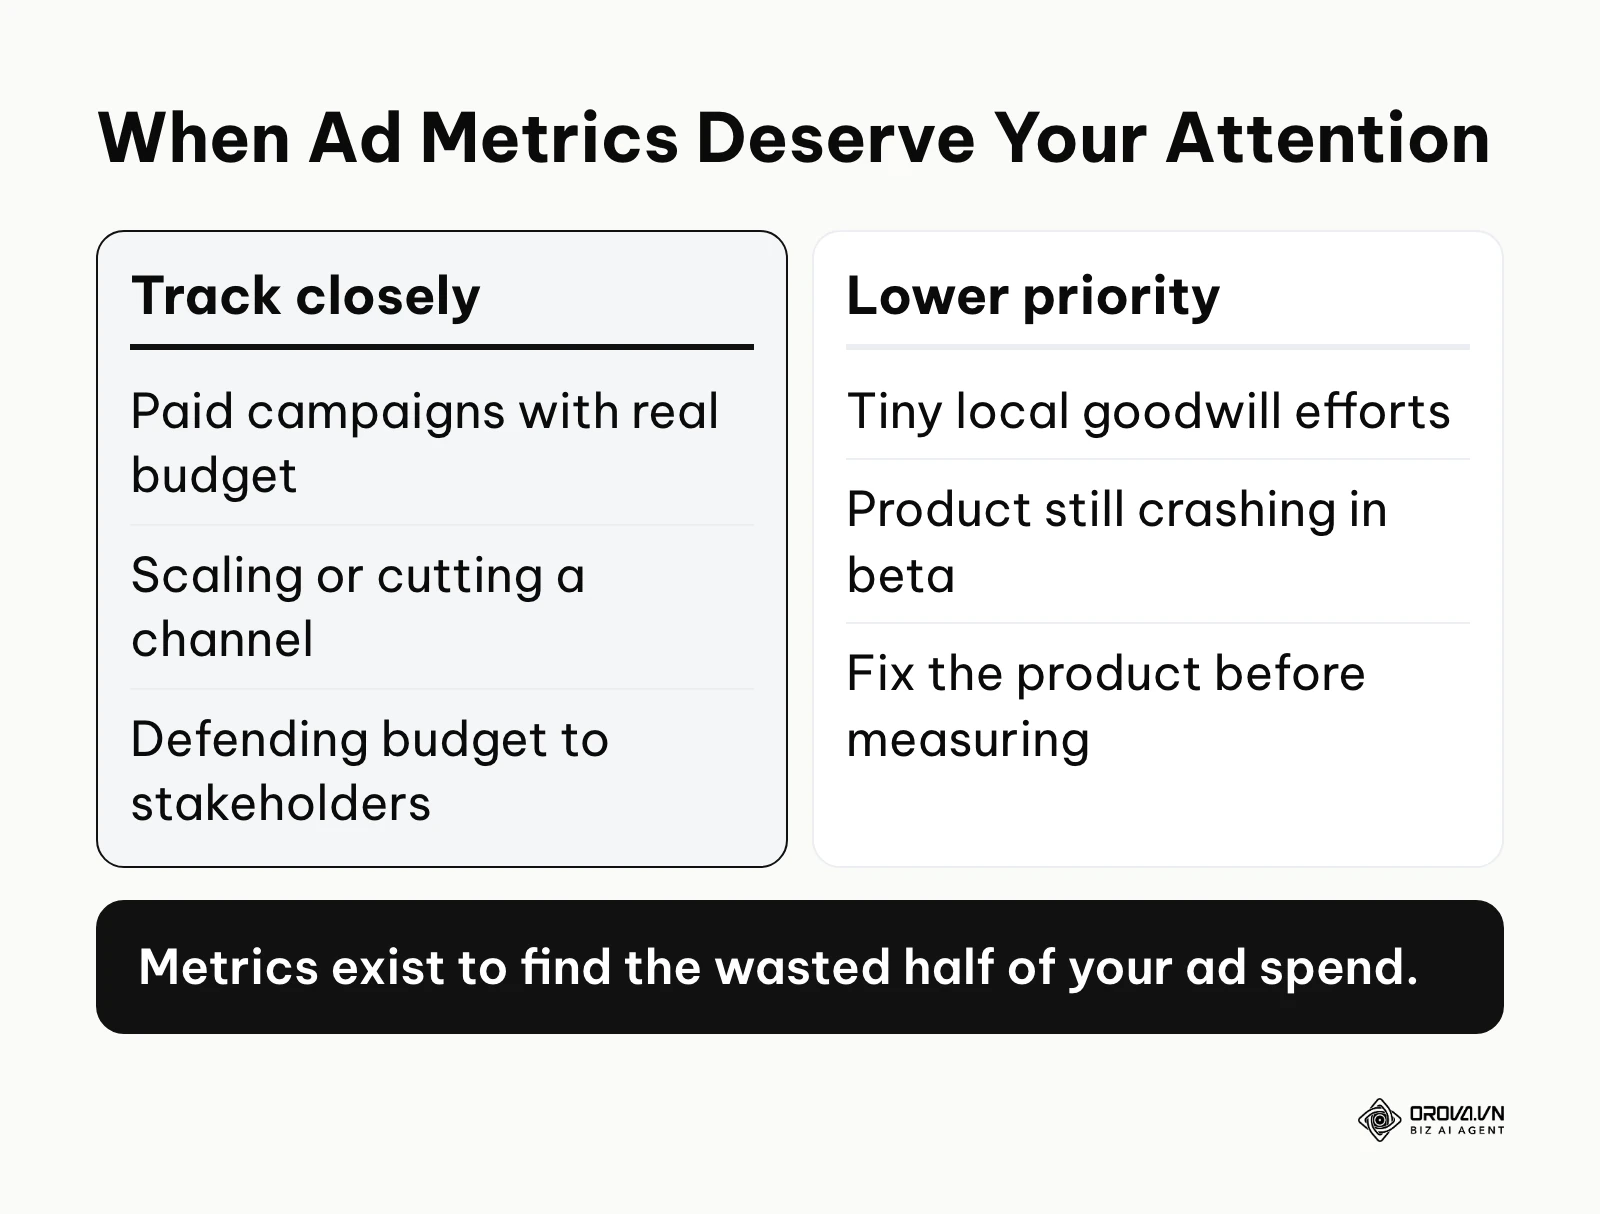
When should you not prioritize these numbers? If you are running a purely localized brand awareness effort with a tiny budget—like sponsoring a neighborhood bake sale—obsessing over digital ad performance metrics is overkill and a waste of resources. In these specific scenarios, community goodwill and physical foot traffic are your real indicators. Furthermore, if your product is in an extreme beta testing phase and the website frequently crashes, tracking advertising conversion rates is useless; you must fix the core product infrastructure before spending any money to measure paid traffic.
The Value and Benefits of Tracking Metrics
Tracking these numbers provides the direct value of protecting your financial runway and proving marketing ROI. It eliminates subjective debates by providing a clear, data-driven truth about what resonates with the market. The benefits can be divided into distinct advantages for the business as a whole, and specific advantages for the practitioner managing the campaigns.
Business Value: Mitigating Financial Risk
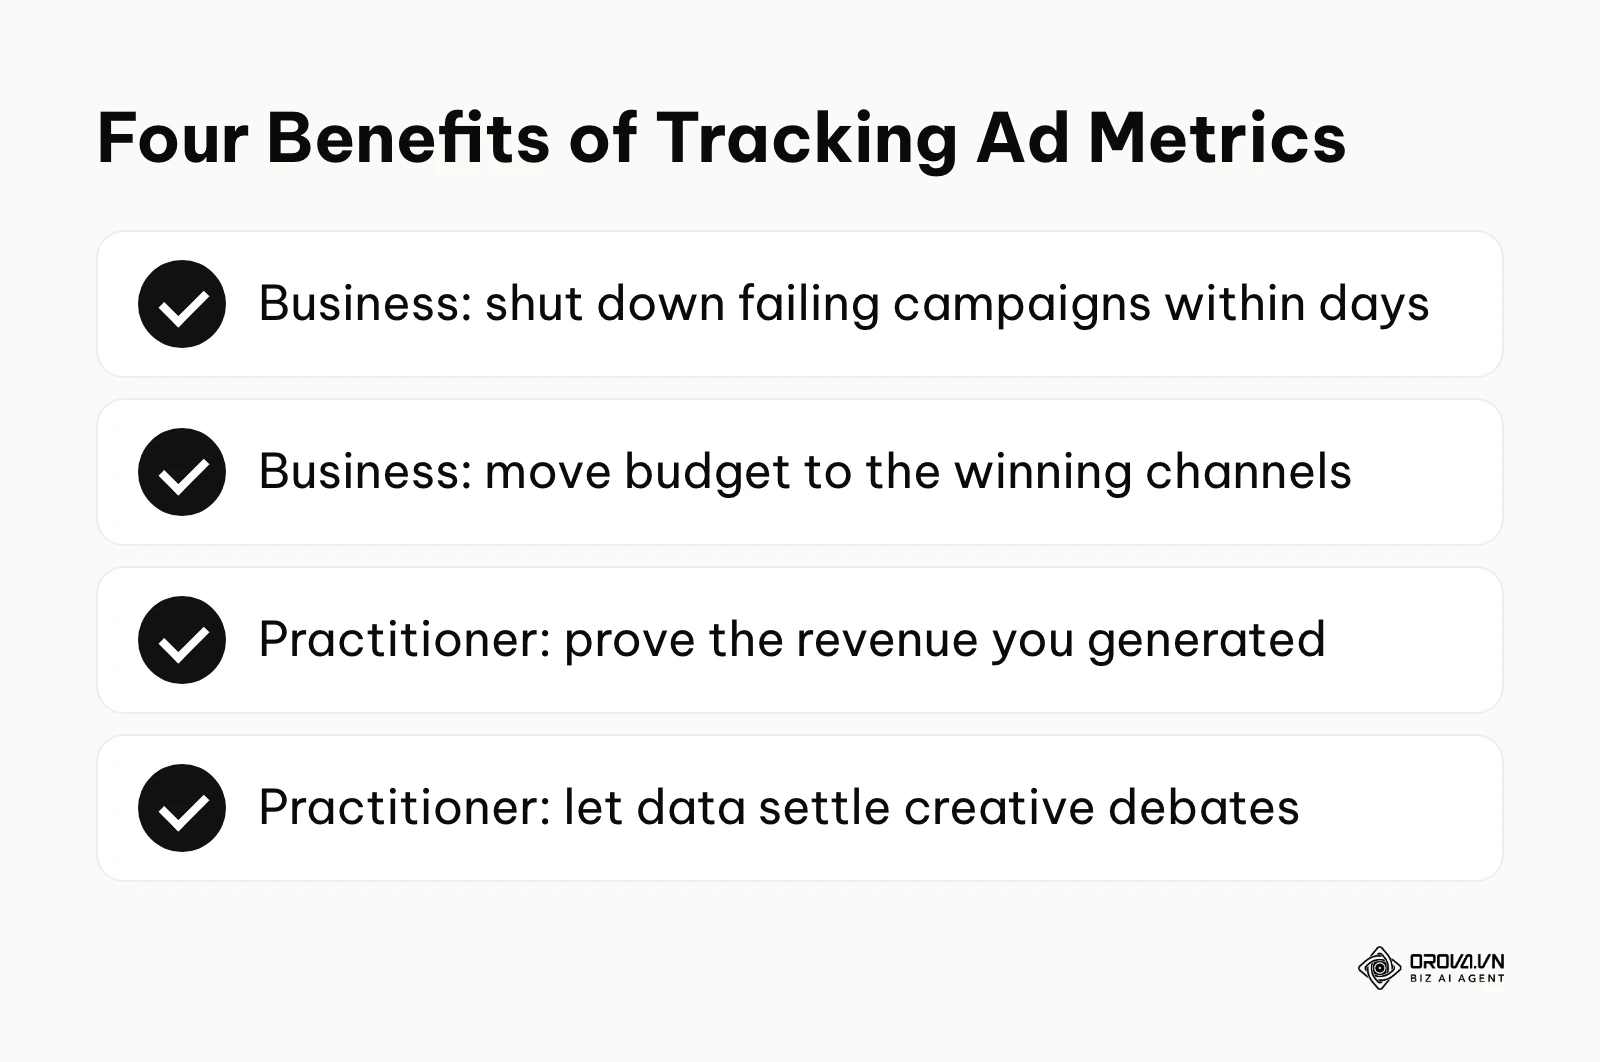
For the business entity, the primary value is risk reduction. By constantly monitoring performance, a company can quickly identify when a campaign is failing and shut it down before significant money is lost. Instead of waiting until the end of the quarter to realize a strategy failed, executives can pivot within days.
Illustrative example: A mid-sized B2B software company's marketing director was launching a new product. They set up LinkedIn campaigns targeting senior executives, adjusted bidding daily based on clicks, and increased the daily budget by 20% every Friday. They noticed high clicks but zero qualified leads, realizing their landing page form was broken on mobile devices. After implementing mobile-responsive forms and shifting focus from CPC to tracking Cost Per Lead, the sales dashboard began displaying a steady stream of verifiable corporate email sign-ups instead of anonymous click data.
Business Value: Strategic Budget Allocation
The data allows companies to divert funds away from underperforming channels and double down on winners. If the numbers clearly show that Google Search yields a better return than Meta, the business can dynamically reallocate its monthly budget to maximize overall profit, rather than sticking to a rigid, arbitrary budget split.
Practitioner Benefit: Proving Professional Value
For the marketer or agency running the ads, these numbers provide undeniable proof of their contribution. When a practitioner can demonstrate exactly how much revenue their campaigns generated, it becomes significantly easier to negotiate higher retainers, secure budget approvals, or demand promotions based on objective success rather than subjective office politics.
Illustrative example: A specialized recruitment agency's lead generation specialist was trying to acquire high-level engineering candidates. They launched Google Search ads, tested three different headline variations, and added negative keywords to filter out entry-level job seekers. The campaign initially stalled because they were optimizing purely for Click-Through Rate, attracting unqualified clicks. By shifting the primary metric to Cost Per Application and adjusting the ad copy to explicitly state the required senior experience level, the recruiters' inboxes were visibly populated with resumes containing the required ten years of technical experience.
Practitioner Benefit: Ending Creative Debates
Creative discussions are notoriously subjective. One manager might prefer a blue background, while another prefers red. Tracking metrics entirely eliminates this friction. By launching both variations and letting the data decide, the practitioner relies on actual market feedback rather than personal opinion to determine the winning creative asset.
| Benefit | Measured by which indicator | Time to see results |
|---|---|---|
| Budget Optimization | Cost Per Acquisition (CPA) dropping | 7 to 14 days |
| Creative Validation | Click-Through Rate (CTR) increasing | 24 to 48 hours |
| Revenue Scaling | Return on Ad Spend (ROAS) stabilizing | 30 to 60 days |
OROVA ADS applies AI Agent to automate and optimize ad performance on Google, Meta and TikTok. Scale your budget safely, monitor 24/7 and expand your business quickly.
Experience the solution at orova.vn/ads
How Ad Performance Metrics Work: The Analytical Breakdown
These metrics work by capturing user interactions at every stage of the customer journey, from the first visual impression to the final financial transaction. They function as a diagnostic tool to highlight exact friction points within your marketing funnel. Understanding how these numbers interact is critical before launching any new ad campaign.
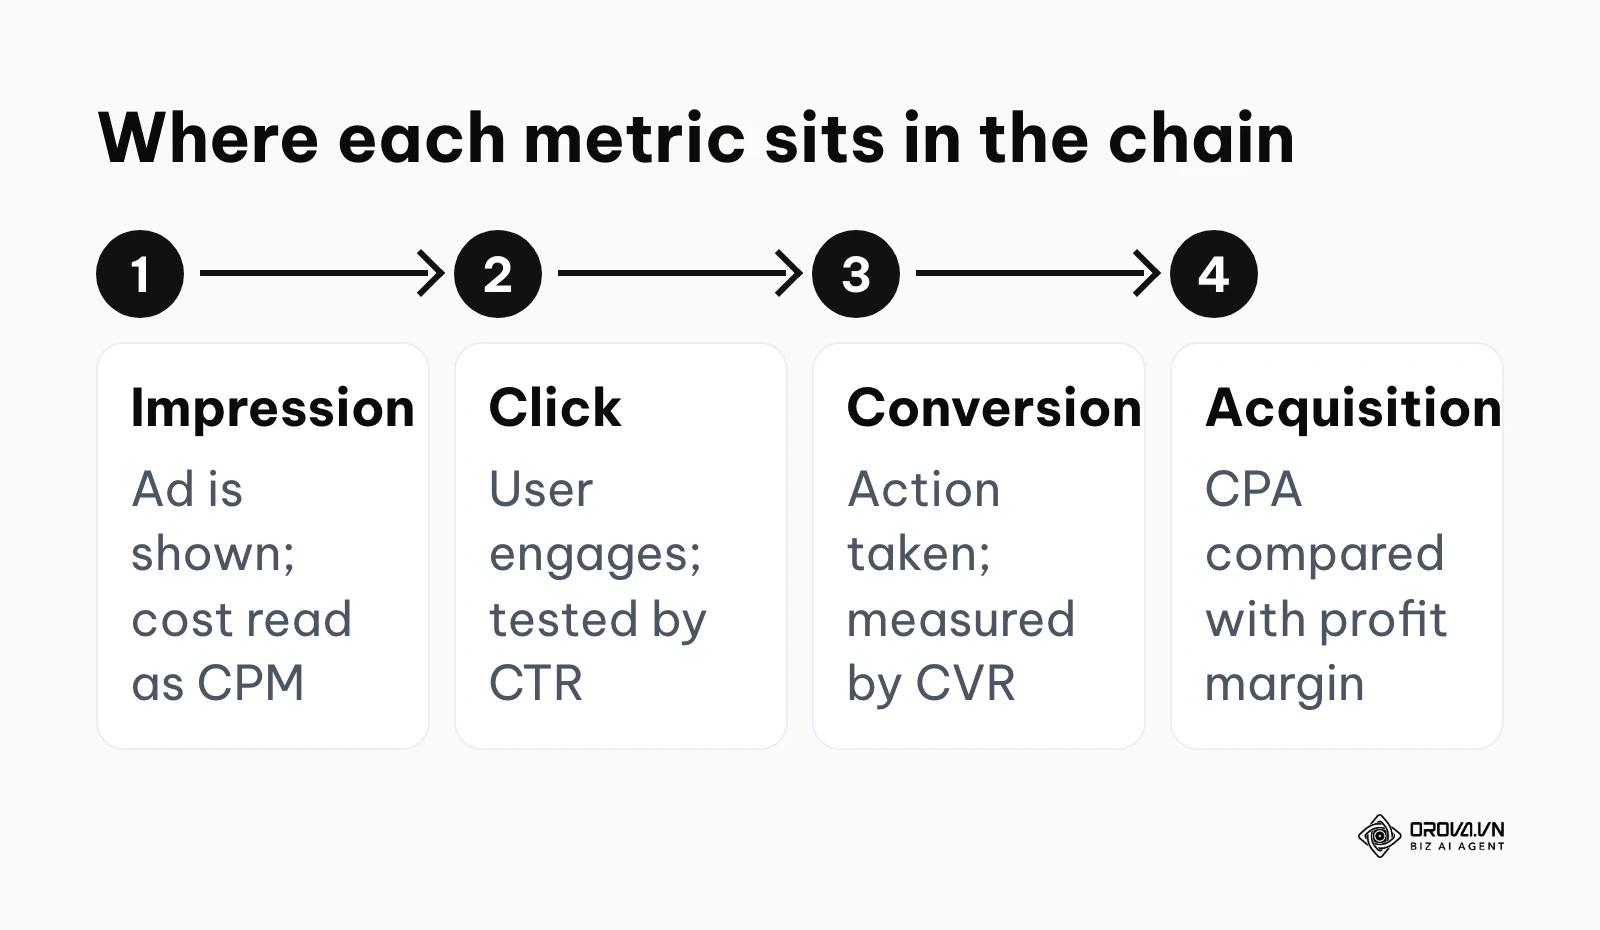
To truly grasp how these indicators function, we must break them down systematically. They do not operate in a vacuum; they form a sequential chain of events. A failure at the top of the chain inevitably ruins the numbers at the bottom.
The Top of the Funnel Metrics
The top of the funnel is all about visibility and initial interest. The process begins with an Impression, which counts every time your ad is displayed on a screen. Advertisers often pay based on CPM (Cost Per Mille), which is the cost for one thousand impressions. If your CPM is unusually high, it often means your targeting is too narrow or the platform considers your ad low quality.
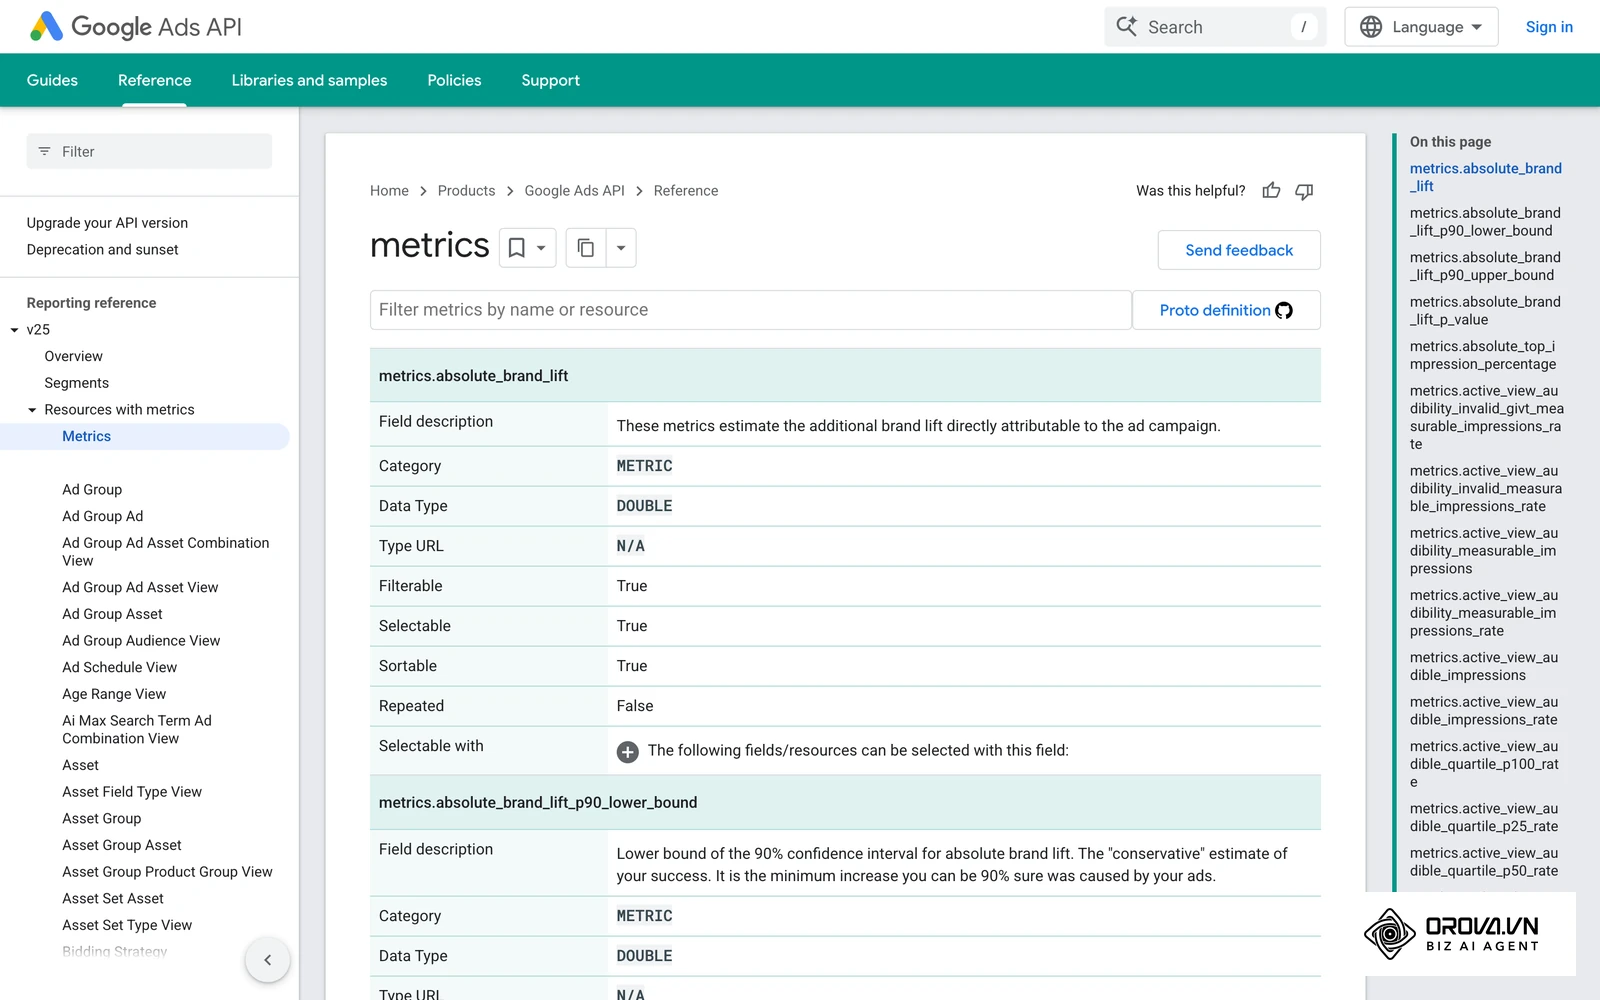
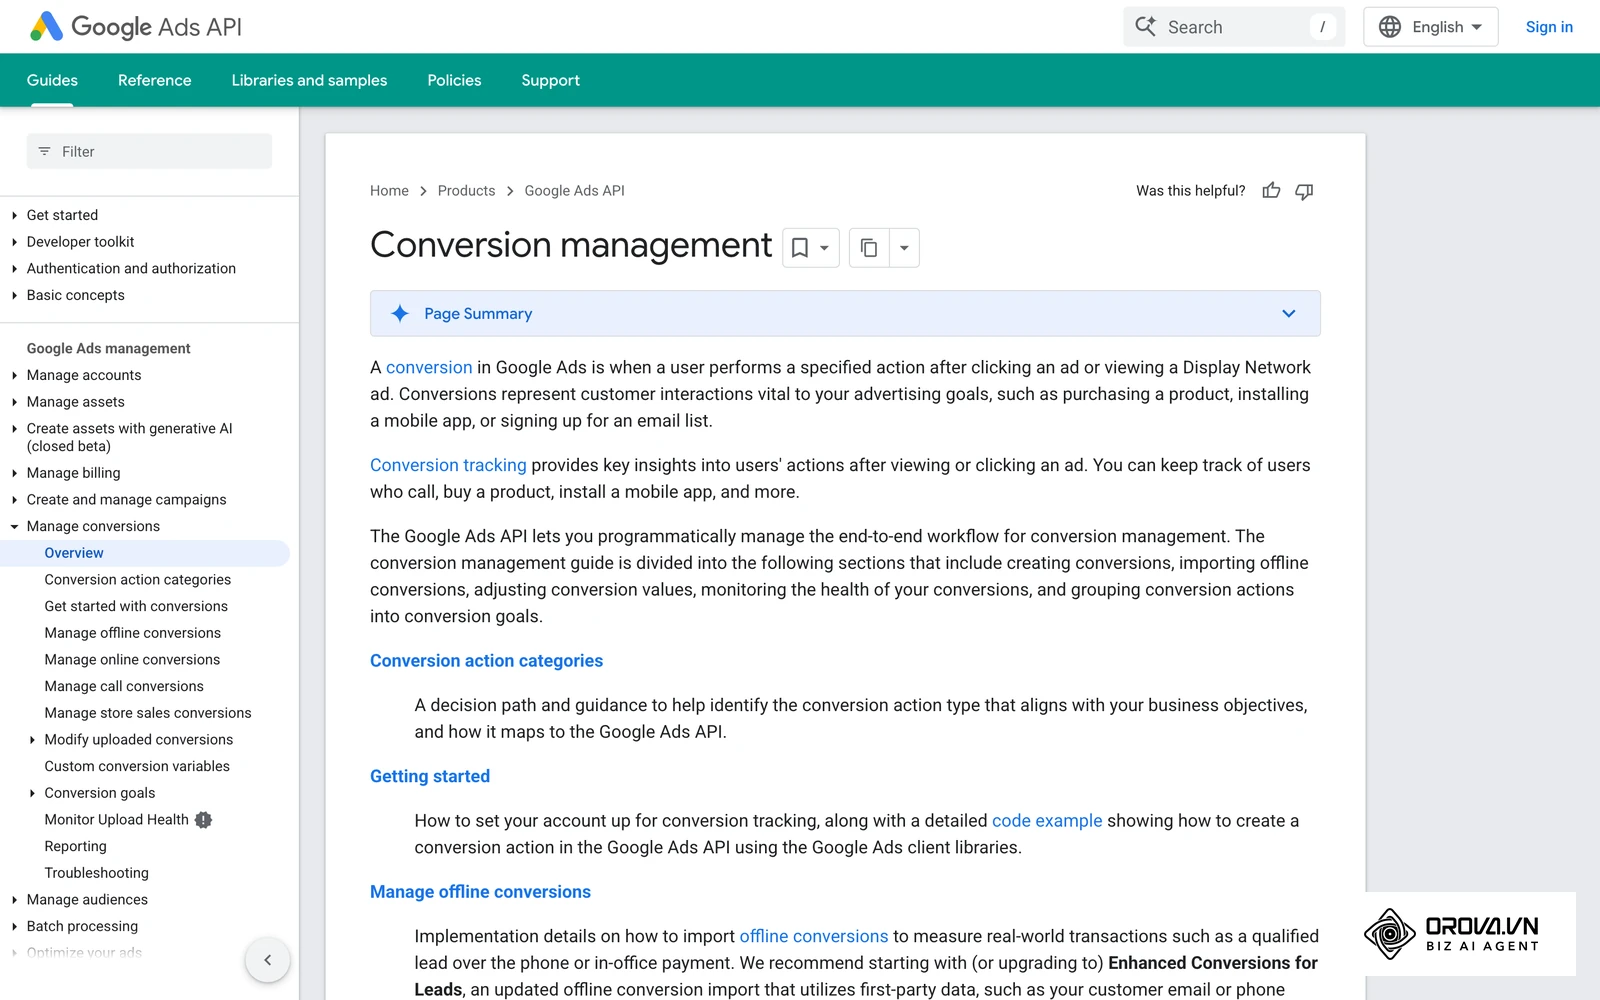
When a user finds the impression compelling, they click. This generates the CTR (Click-Through Rate), calculated by dividing clicks by impressions. CTR is the ultimate test of your creative asset and headline. A low CTR indicates that your ad is boring, irrelevant to the audience, or suffering from visual fatigue. Keep in mind that a click is not a result on its own: as the Google Ads Help Center documentation on conversion tracking explains, conversions are only recorded once a tracking tag or a conversion import is in place.
The Conversion and Financial Metrics
Once the user clicks, the focus shifts to what happens on your website. The Conversion Rate (CVR) measures the percentage of clicks that result in a desired action, such as a purchase or a lead submission. If you have a high CTR but a low CVR, the ad is successfully grabbing attention, but your landing page is failing to close the deal.
The most critical financial metric for most businesses is the CPA (Cost Per Acquisition) or CPL (Cost Per Lead). This is the total ad spend divided by the number of acquisitions. It tells you exactly how much it costs to buy a customer. If your CPA is higher than the profit margin of your product, the campaign is fundamentally broken and actively losing money.
Understanding ROAS vs ROI in Advertising
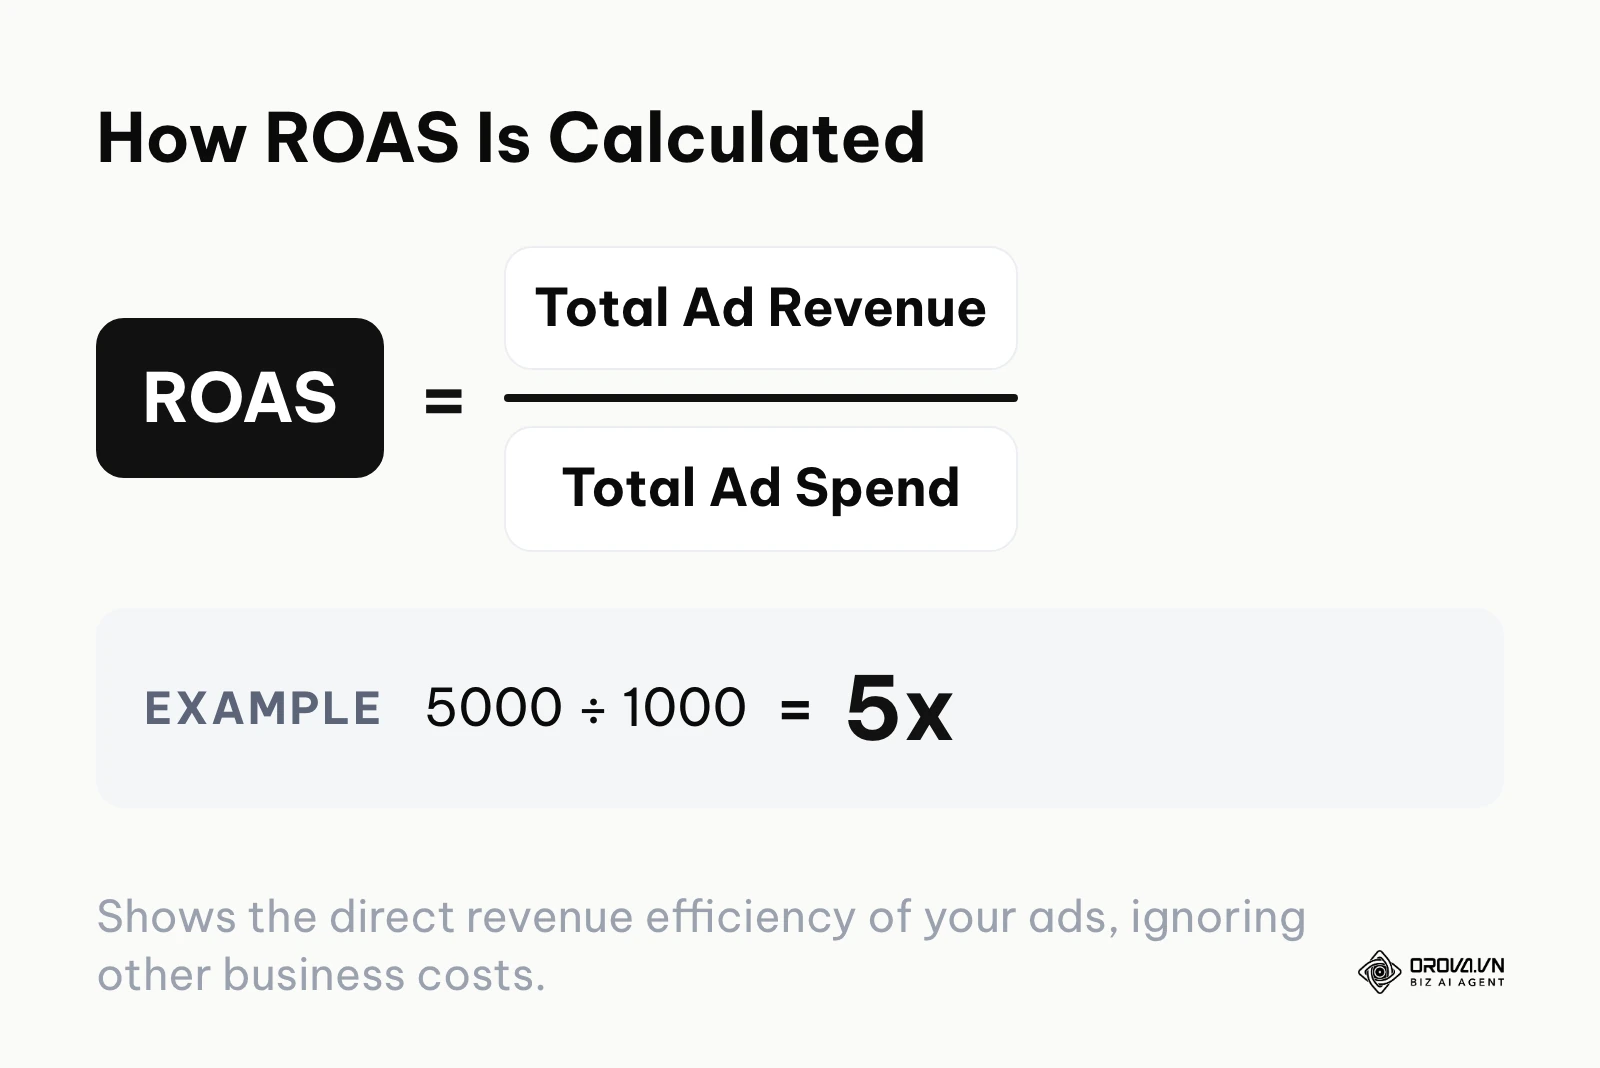
Marketers frequently confuse these two financial terms, but they measure entirely different scopes of profitability. ROAS (Return on Ad Spend) looks strictly at the revenue generated directly by the advertising campaign compared to the cost of those specific ads. Understanding the exact ROAS formula allows you to determine profitability instantly. If you spend 1,000 on ads and generate 5,000 in sales (in any currency), your ROAS is 5x (or 500%). It ignores all other business costs.
ROI (Return on Investment), however, is a comprehensive business metric. It factors in the ad spend, but also the cost of goods sold, employee salaries, software subscriptions, and shipping fees. A campaign might have a fantastic ROAS of 4x, but when you factor in the high manufacturing costs of the product, the overall business ROI might actually be negative. Ad platforms report ROAS; your accounting department calculates ROI.
Filtering Vanity Metrics vs Actionable Data
One of the most dangerous traps for beginners is optimizing for vanity metrics. These are numbers that look impressive on a report but have zero correlation with financial success. Metrics like total impressions, video views, page likes, and social media shares often fall into this category. A campaign that generates ten thousand likes but zero sales is a total failure, yet many practitioners highlight the likes to mask the financial loss.
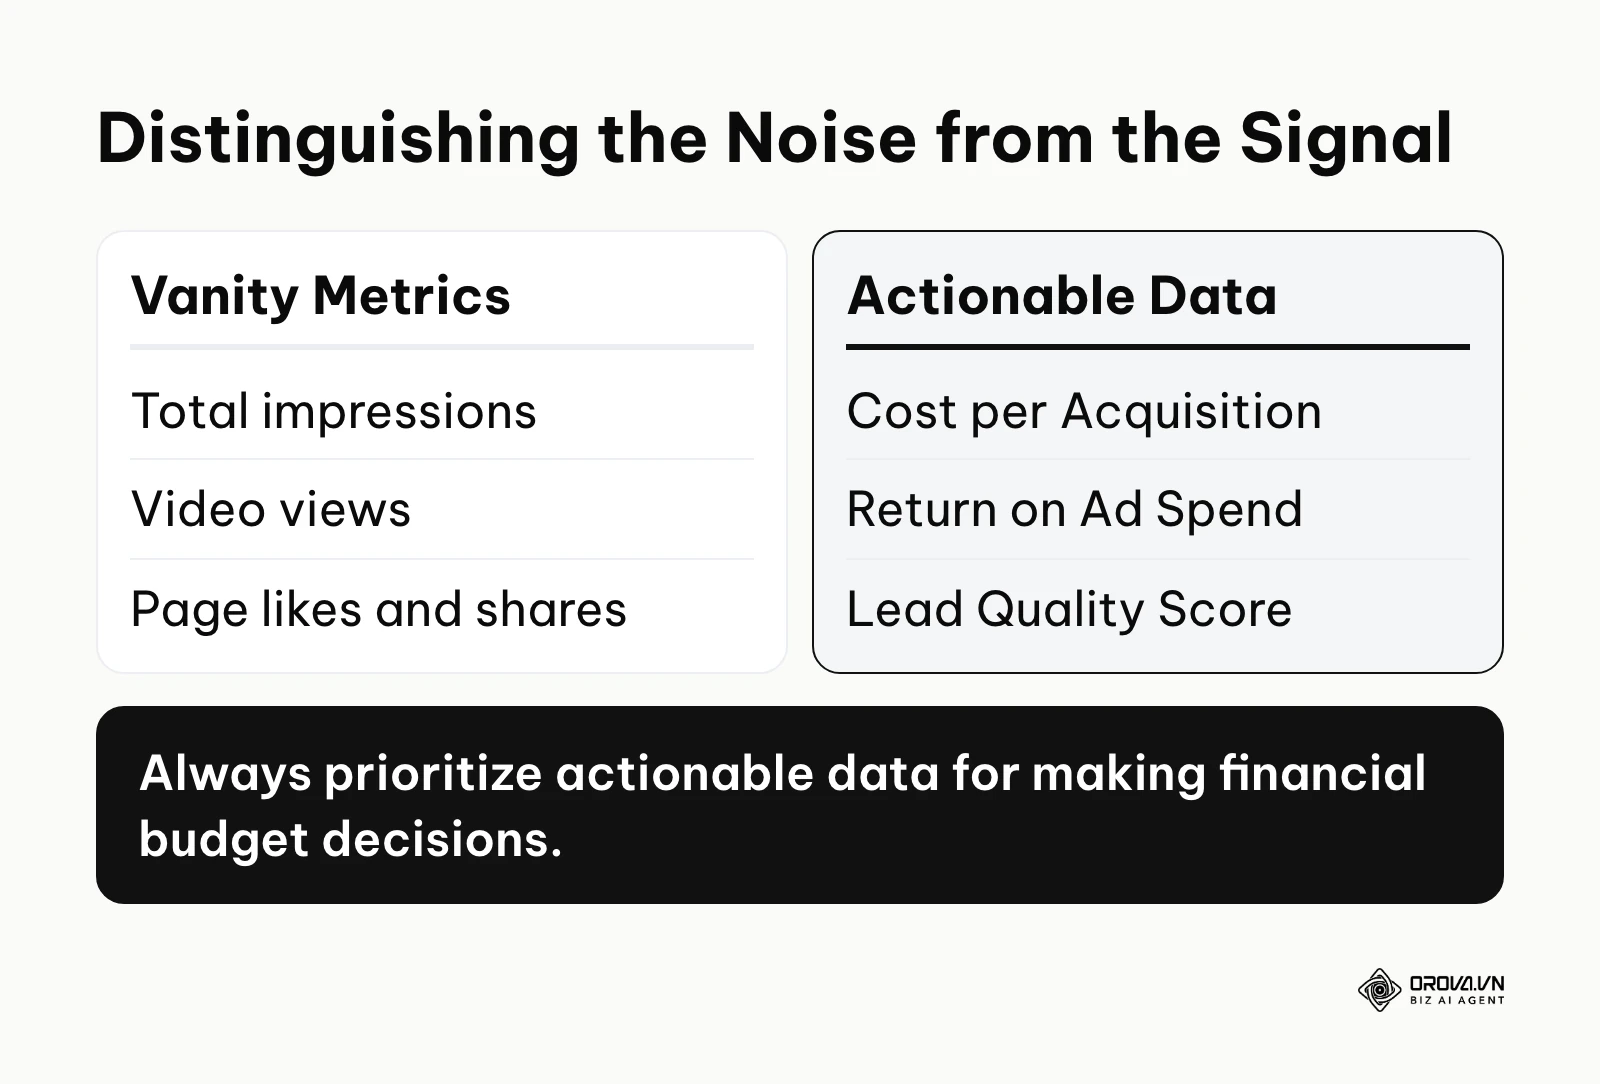
Actionable data, on the other hand, informs direct business decisions. Metrics like CPA, ROAS, and Lead Quality Score dictate whether you should increase your budget or pause the campaign. You must rigorously filter your dashboards to ensure that actionable data is prominent, while vanity metrics are buried or removed entirely to prevent distraction.
Diagnostic Decision Tree: Finding the Bottleneck
The true power of these numbers lies in combining them to diagnose problems. This diagnostic approach is essentially a rigorous ad testing methodology. When a campaign fails, the numbers will always tell you exactly where the breakdown occurred.
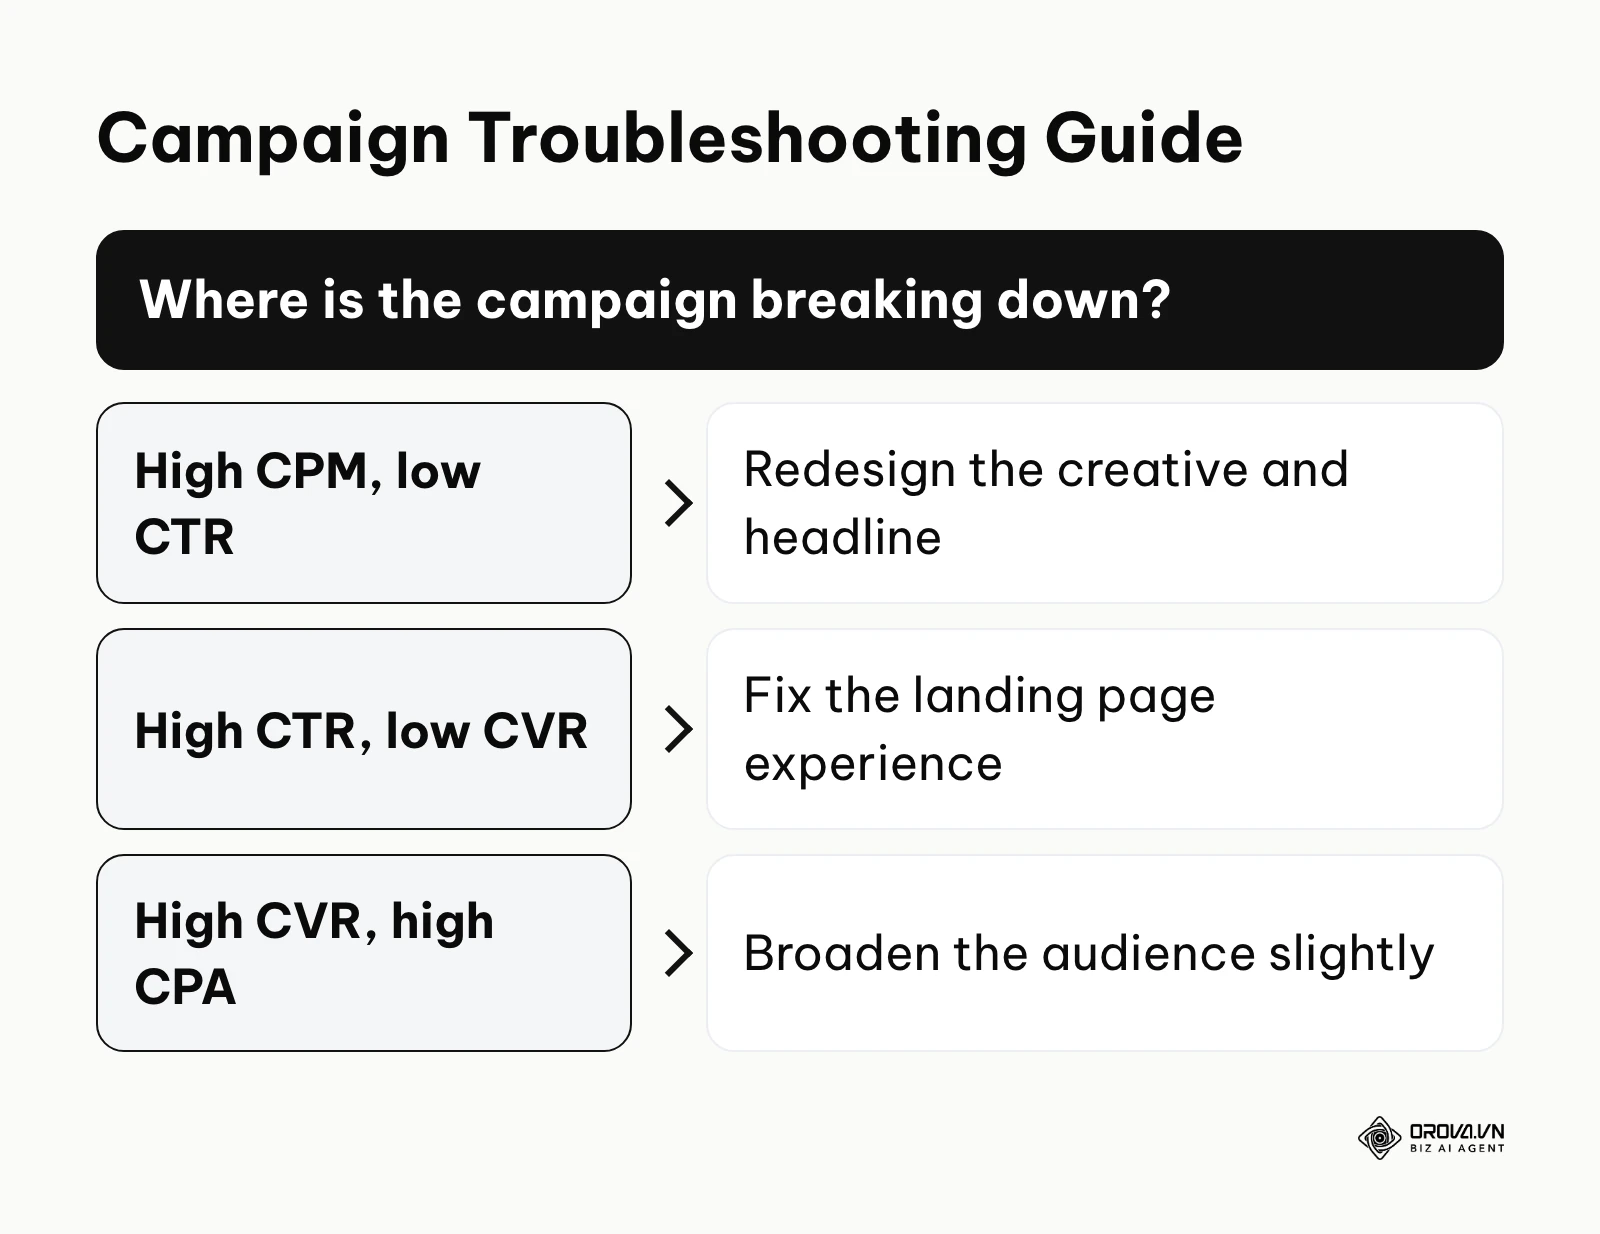
- Scenario 1: High CPM + Low CTR. The ad platform is charging you a premium to show your ad, but nobody is clicking it. Your targeting is likely highly competitive, and your creative is weak. Fix: Redesign the image/video and rewrite the headline to stand out.
- Scenario 2: Low CPC + High CTR + Low CVR. You are getting incredibly cheap clicks, and users love the ad, but nobody is buying. Fix: The ad is making a promise the landing page does not keep. Check your page load speed, ensure mobile responsiveness, and verify that the pricing matches the ad exactly.
- Scenario 3: High CVR + High CPA. The people who click are buying at a great rate, but the clicks are so expensive that the final cost to acquire the customer is too high. Fix: Your conversion process is excellent, but your targeting is too narrow. Broaden your audience slightly to lower the initial click costs.
Using Industry Benchmarks Without Misleading Yourself
Evaluating your numbers in isolation is difficult. You need context to know whether your CTR or cost per lead is weak or strong. Third-party publishers such as LocaliQ release annual search advertising benchmark reports that break down averages like CTR, cost per lead, and conversion rate by industry, and they are a useful first reference point.
Use them with care. Averages vary widely by sector, country, platform, campaign type, and year, and the landscape keeps shifting as AI bidding spreads, so older figures lose relevance quickly. Treat a published benchmark as a rough sanity check, then build your real yardstick from your own data:
| Comparison point | What it tells you | How to use it |
|---|---|---|
| Your own last 30 to 90 days | Whether performance is improving or slipping | Primary baseline for every bid and budget decision |
| Your break-even CPA and ROAS | Whether a campaign is profitable for your margins | Hard line for pausing or scaling |
| A published industry report | Whether you sit in a plausible range for your sector | Sanity check only; read the report's own method and year first |
Navigating Cross-Device Tracking Challenges
A major hurdle in modern measurement is cross-device behavior. A user might click an ad on their smartphone while commuting, but wait until they are on their desktop computer at home to make the purchase. The Meta Business Help Center documentation on attribution settings explains that conversions are credited within a set window after someone clicks or views an ad, and ad platforms also use modeling to estimate conversions they cannot observe directly. If you only look at last-click attribution on a single device, you will severely undervalue top-of-funnel mobile campaigns.
| Metric Category | Key Characteristics | Best suited for |
|---|---|---|
| Awareness | High volume, low cost, measures visibility. | Brand launches and reaching new audiences. |
| Consideration | Measures active engagement and initial interest. | Lead generation and content distribution. |
| Conversion | Focuses on strict financial returns and final actions. | Ecommerce sales and high-ticket B2B services. |
What to Do to Start Adapting Your Tracking
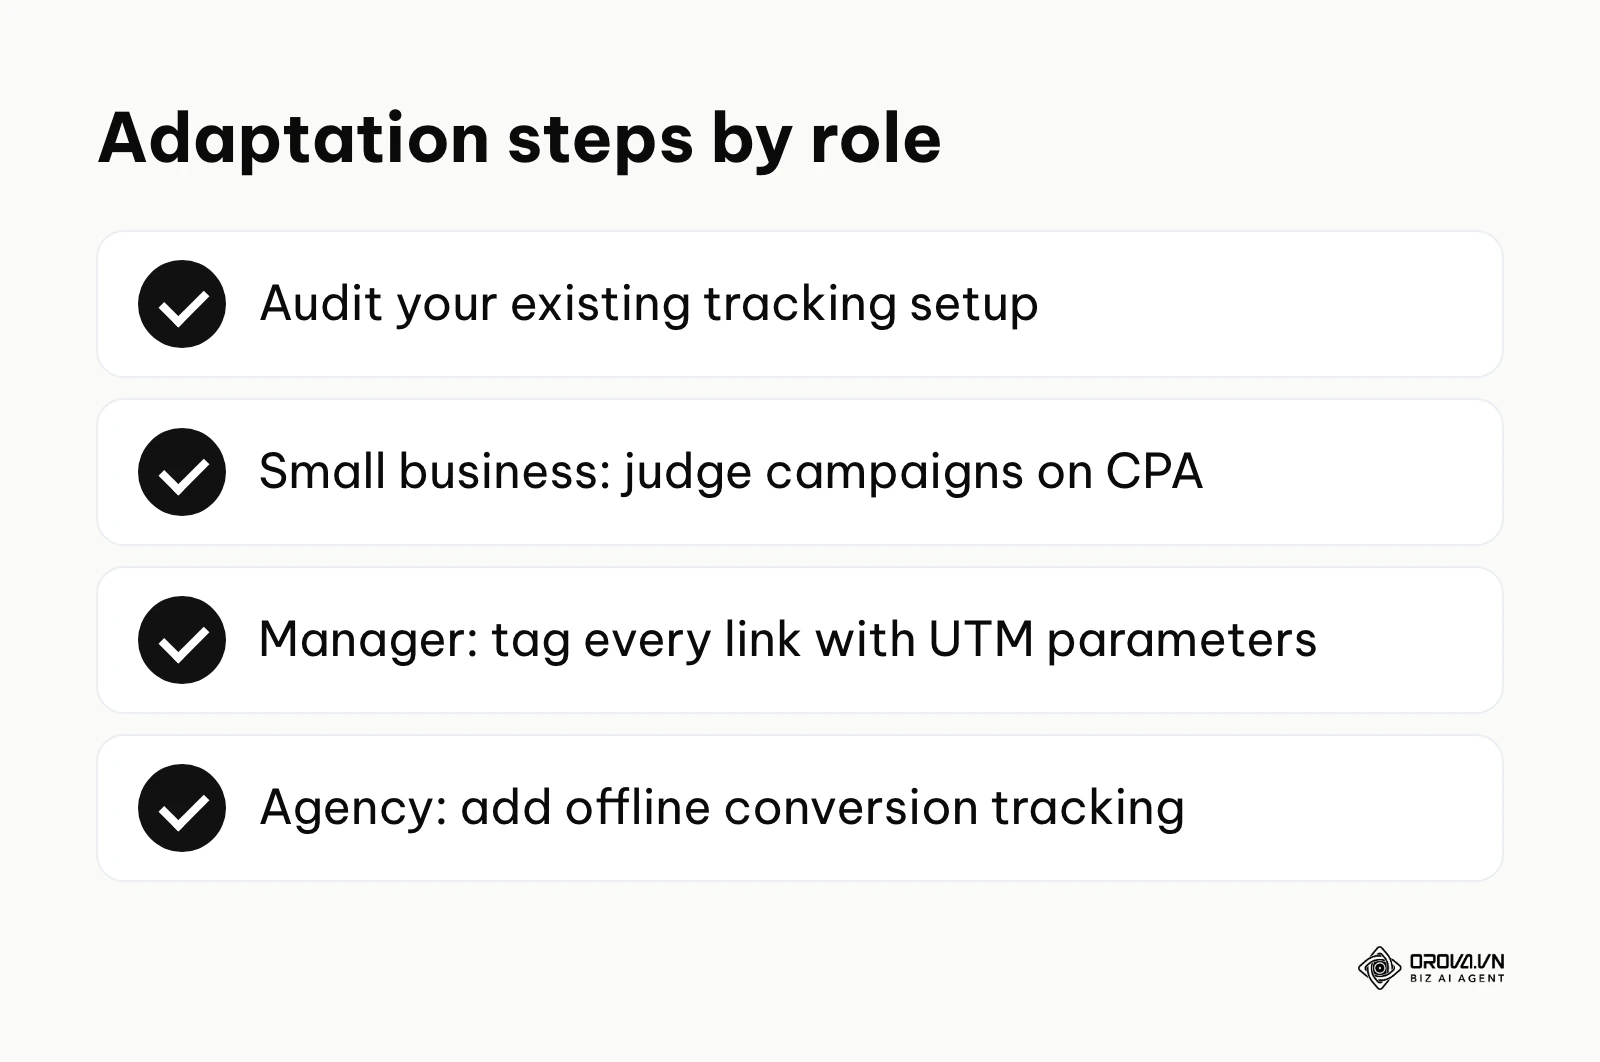
To adapt your tracking strategy, you must first audit your existing technical setup and establish clear, unified reporting standards. The immediate goal is to centralize your data so you can make confident decisions across all platforms. Different roles require slightly different approaches to adaptation.
For the Small Business Owner
If you own a small business, you are likely wearing multiple hats and do not have time to analyze complex spreadsheets. Your focus must be ruthless simplicity. Stop looking at daily fluctuations in click costs and focus entirely on your Cost Per Acquisition (CPA). Determine exactly how much profit you make on an average sale, and set a hard rule: if a campaign's CPA exceeds that profit margin for more than seven days, turn it off. Set up automated email alerts from your ad platforms to notify you only when this CPA threshold is breached.
Illustrative example: An independent ecommerce store owner managing a modest monthly ad budget noticed dropping sales. They exported their Meta Ads performance data, compared the Cost Per Acquisition against their average order value, and paused the three worst-performing ad sets. The friction occurred when they realized iOS privacy updates were delaying attribution data, causing them to pause ads prematurely. By extending their evaluation window to 7 days and utilizing server-side tracking, their fulfillment center immediately saw a return to normal shipping volumes, evidenced by physical packages leaving the warehouse daily.
For the Marketing Manager in a Company
As an in-house marketing manager, your job is to translate complex data into business insights for executives. You need to adapt by building an ad performance metrics dashboard that aggregates data from Google, Meta, and LinkedIn into one view; the guide to marketing dashboard KPIs covers how to decide what earns a place on it. Move away from native platform reporting, which often takes credit for the same conversions. Start implementing UTM tracking parameters rigorously across every link you deploy, ensuring that your backend CRM data matches the front-end ad spend.
For the Agency or Freelancer
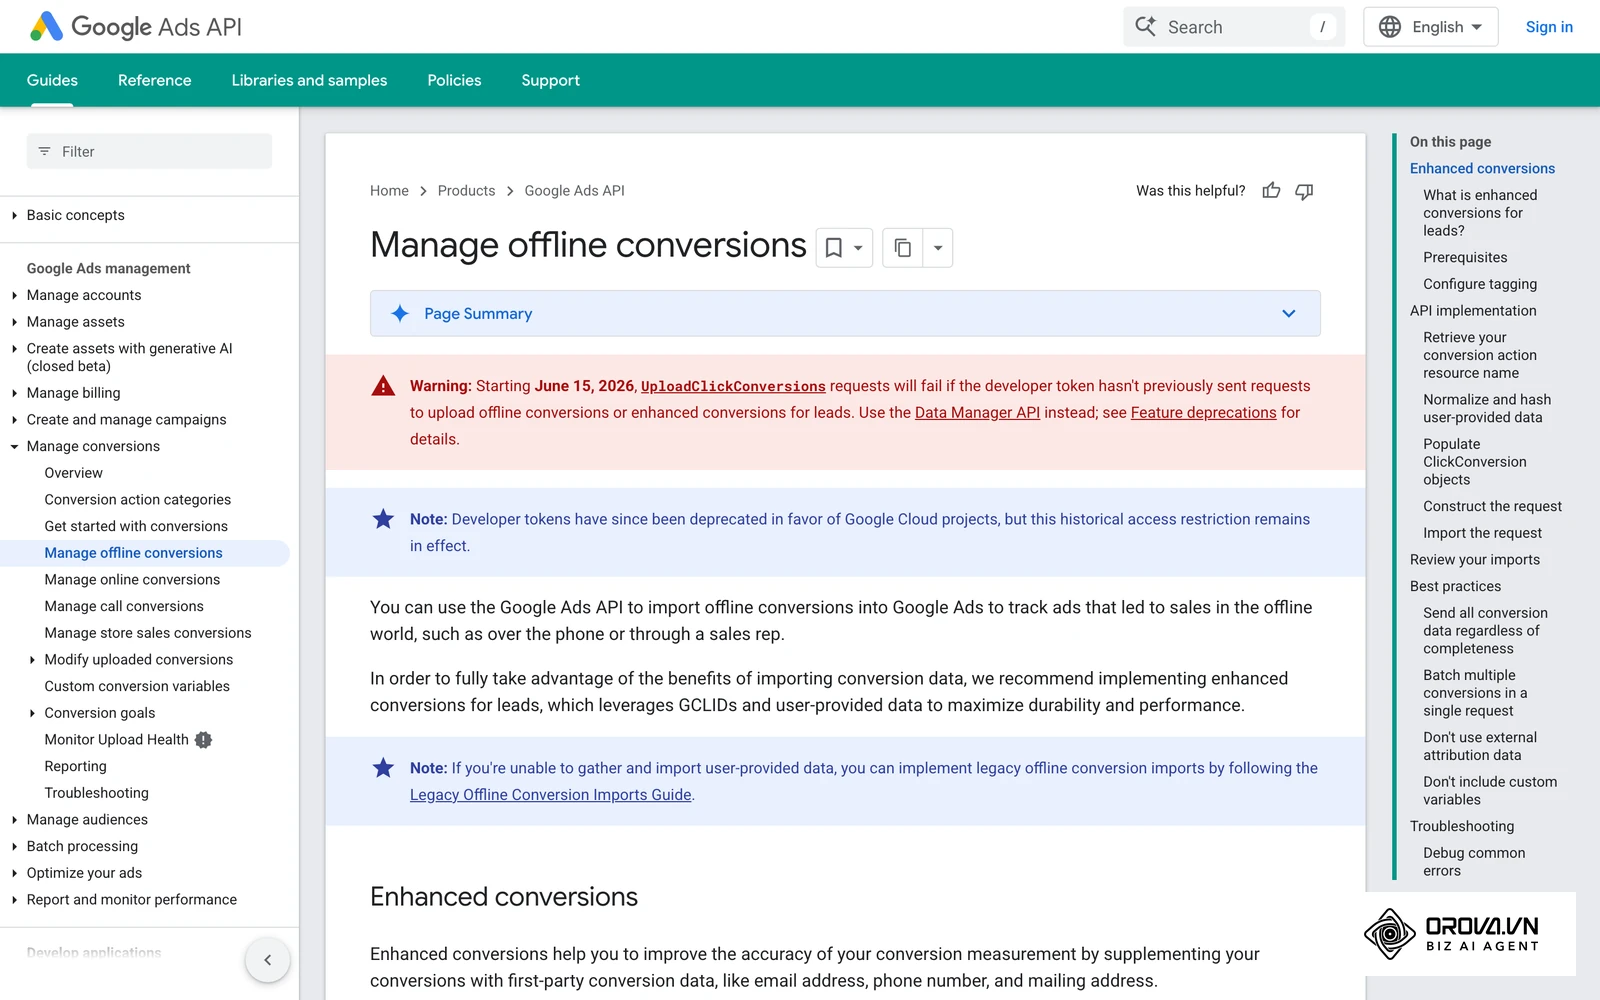
Agencies must adapt by proving incrementality—showing clients that the ad spend caused sales that would not have happened otherwise. You need to implement offline conversion tracking to tie in-store purchases or long-cycle B2B phone sales back to the original digital click. Your adaptation strategy should involve migrating clients from outdated manual reports to live, automated dashboards using tools like Looker Studio, providing absolute transparency to build trust.
| Common Mistake | Immediate Consequence | How to Avoid It |
|---|---|---|
| Tracking too many numbers | Analysis paralysis and delayed decisions. | Select only 3 to 5 core indicators per campaign. |
| Ignoring attribution windows | Pausing profitable ads prematurely. | Wait at least 7 days before judging conversion data. |
| Optimizing for vanity metrics | High engagement but zero actual revenue. | Always tie ad spend directly to pipeline sales. |
Want to scale your budget but afraid of breaking performance? 📉
Integrate OROVA ADS now - an AI Agent that automatically monitors and optimizes Google, Meta, TikTok ads 24/7. Now, expanding and replicating your Performance Ads team is just one click away.
🚀 Try it now at: orova.vn/ads
The Future of Ad Metrics in 2026: Author's Predictions
In the coming years, metric tracking will become heavily reliant on predictive artificial intelligence and privacy-first measurement frameworks. Manual data extraction will shrink as automated insights take precedence. Based on the current trajectory of the industry, here is where I see the landscape moving.
AI Will Take Over Most Manual Data Parsing
Campaign types such as Google Performance Max already lean heavily on machine learning and give advertisers less granular control than classic campaigns. I believe marketers will increasingly stop exporting spreadsheets by hand to calculate basic ratios or diagnose bottlenecks. AI systems will instantly highlight anomalies and autonomously suggest budget shifts across networks. You should prepare by learning how to ask AI the right strategic business questions, rather than just memorizing mathematical formulas, because manual calculation is becoming a smaller part of the job.
Privacy Regulations Will Force Blended Measurement
Current signs indicate that strict privacy laws and browser restrictions are making exact one-to-one pixel tracking increasingly unreliable. My perspective is that we will see a broader shift toward blended measurement—often called Media Mix Modeling—where overall business revenue is mapped against total marketing spend, rather than trying to track individual users. You need to start building robust first-party data collection systems today, encouraging users to log in or provide emails, so you depend less on third-party cookies and cross-site tracking.
Consolidated Dashboards Will Become the Norm
I strongly suspect that the practice of logging into five different advertising platforms natively to check metrics will become obsolete. Because platforms are becoming increasingly siloed and protective of their data, centralized analytics dashboards will become the most practical way to see the true cross-channel impact. You should begin evaluating unified data tools now to avoid being blinded by fragmented reporting. Of course, sudden restrictive changes in platform API access by major tech companies could potentially delay or complicate this integration trend.
Frequently Asked Questions About Ad Performance Metrics
The most frequently asked questions about this topic revolve around technical setup, ideal financial targets, and the impact of automation. Below are clear answers to the most common challenges marketers face today.
How frequently should I check my advertising dashboards?
For new campaigns, checking daily is recommended to ensure budgets are pacing correctly and no technical errors occurred. However, you should not make major optimization decisions daily. Ad platform algorithms require time to learn user behavior. It is generally best practice to wait 48 to 72 hours before adjusting bids or pausing underperforming creative assets to allow the data to stabilize.
Are ad performance metrics still needed when AI manages campaigns?
Yes, they are arguably more important, but the way you use them changes. While AI handles the micro-bidding and targeting adjustments, you still need high-level metrics (like ROAS and CPA) to determine if the AI's actions are actually profitable for your specific business constraints. You use metrics to set the guardrails and feed the AI the correct business goals.
How to measure ad performance for offline sales?
To connect digital ads to offline purchases, you must implement Offline Conversion Tracking (OCT). This involves collecting customer information at the physical point of sale (like an email address for a digital receipt), and then securely uploading that encrypted data back to the advertising platform. The platform then matches the offline purchase to the user who previously clicked your digital ad.
What is considered a good return on ad spend?
There is no universal "good" ROAS because it depends entirely on your profit margins. A software company with no physical manufacturing costs might be highly profitable at a 2x ROAS. Conversely, a retail business with thin margins, high shipping costs, and expensive inventory might require a 4x or 5x ROAS just to break even. You must calculate your specific break-even point first.
How many metrics should I realistically track?
You should track no more than three to five core metrics per campaign objective. If your goal is lead generation, focus obsessively on Cost Per Lead, Lead Conversion Rate, and total spend. Tracking fifteen different numbers simultaneously usually leads to analysis paralysis, where conflicting data points prevent you from making a clear decision.
Where to Start?
You should begin by identifying your current stage of data maturity and executing one foundational technical task immediately. The goal is to build a reliable base before attempting complex cross-channel analysis. Do not try to build a massive dashboard if your basic tracking is broken.
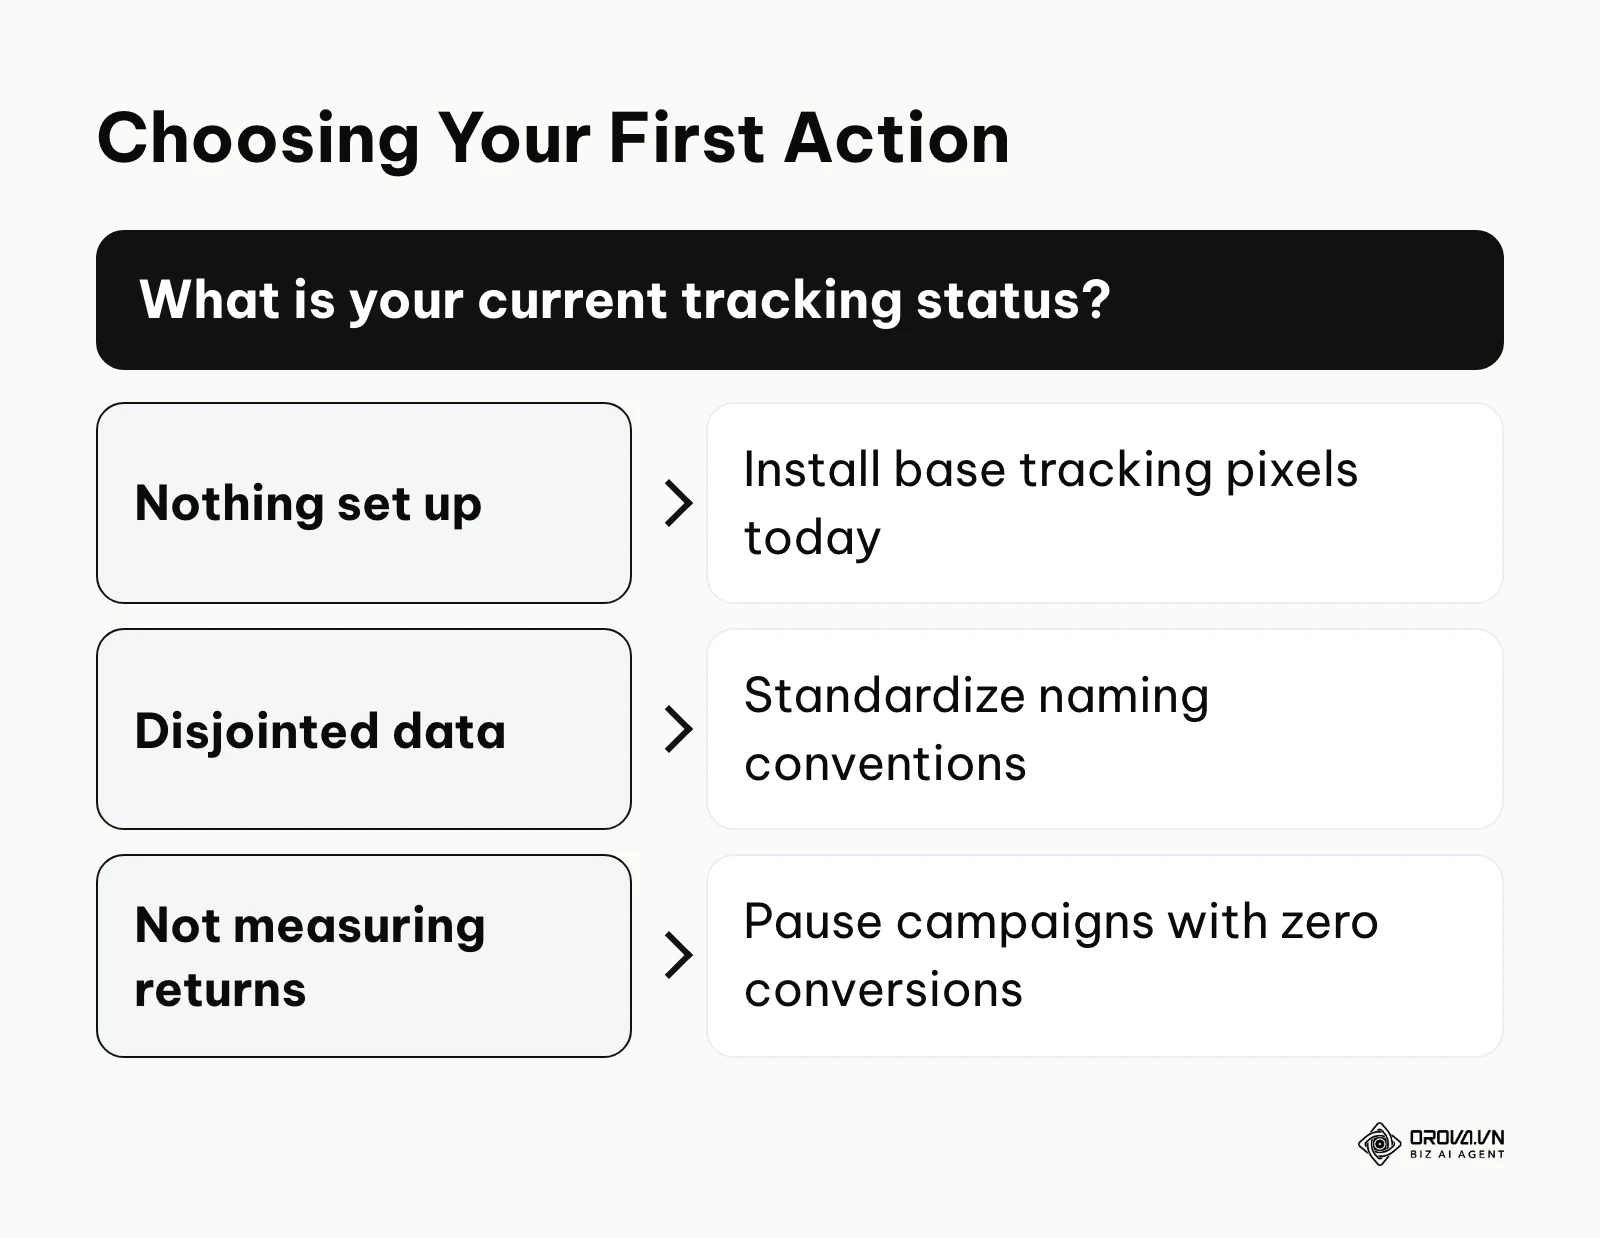
If you have nothing set up: Your very first step is to implement foundational tracking pixels on your website. Do not launch any new campaigns until you have successfully placed the base code for platforms like Google and Meta on your site and verified that basic page views are registering. This can easily be completed in a single afternoon using standard tag management software, and it ensures you are at least collecting audience data for future use.
If you have tracking, but it is disjointed: Your immediate action should be to standardize your naming conventions across all platforms. Go into your accounts and rename every active campaign, ad set, and ad using a strict, uniform structure that includes the date, platform, target audience, and objective (e.g., "2026_Meta_Retargeting_Leads"). This single, non-technical action will instantly make your exported data readable and ready for cross-platform comparison.
If you are running campaigns but not measuring returns: Your task for today is to pause any campaign that has spent money for more than fourteen days without generating a single measurable financial conversion. Take two hours to audit your historical spend, identify the highest cost drivers that yield zero returns, and stop the financial bleeding immediately. You must halt the waste before you invest time into building out a more complex ad performance metrics structure.
About the author

Builder of Orova
Nguyễn Đỗ Trọng Ân has 8 years of experience in marketing, including 6 years managing market development across Asia. He builds Orova, a Biz AI Agent that never sleeps: it plans, runs and optimizes work for businesses.
Run your business with AI Agents
Orova is the always-on Biz AI Agent — it plans, runs, and optimizes the work for you.
Save time, unlock productivity.