
The data-driven SEO report guide: frameworks, KPIs and AI prompts

It is the fifth day of the month. You are staring at a blank spreadsheet, attempting to compile thousands of rows of analytics data into a coherent presentation. You carefully paste a screenshot of a rising traffic graph into your slide deck. Your client, or perhaps your Chief Marketing Officer, looks at the upward curve and asks a devastatingly simple question: "This looks great, but how many actual sales did this bring in?" That is the exact moment you realize your current method of delivering an SEO report is fundamentally broken. Most practitioners treat this document as a simple data dump, throwing numbers at stakeholders and hoping the value is inherently obvious.
This approach completely fails in modern business environments. Executives do not care about crawler statistics or canonical tags; they care about customer acquisition costs, pipeline velocity, and bottom-line revenue. If your documentation does not directly connect search engine visibility to tangible financial outcomes, your budget will always be viewed as an expense rather than an investment. This guide is designed to dismantle the traditional, ineffective template and rebuild it from the ground up. You will learn how to extract raw metrics, apply a rigorous storytelling framework, utilize artificial intelligence to synthesize complex data, and confidently navigate conversations when performance inevitably fluctuates.
What is an SEO report and why do standard templates fail?
An SEO report is a structured, strategic document that translates technical search engine performance metrics into actionable business insights. It serves as the primary communication bridge between marketing practitioners and business stakeholders. You must create this document to justify marketing budgets, demonstrate the return on investment of content creation, and secure alignment for future technical implementations. If your primary objective is merely checking a box at the end of the month, you are missing the fundamental purpose of the exercise.
Standard templates fail because they are almost entirely focused on vanity metrics. A generic template downloaded from the internet will prominently feature total impressions, total clicks, and average ranking positions. While these data points are technically accurate, they exist in a vacuum. A stakeholder cannot deposit an impression into the bank. Furthermore, standard templates lack narrative context. They show what happened, but they completely fail to explain why it happened or what the strategic response should be. When you rely on a pre-built template, you abdicate your responsibility to act as a strategic advisor, reducing your role to that of a mere data compiler.
Preparing for your first data-driven SEO report
Before you open a dashboard tool or begin formatting charts, you must establish an airtight data foundation. You cannot accurately report on metrics that you are not reliably tracking. The preparation phase is often the most tedious, but skipping it guarantees that your final presentation will be built on flawed assumptions. The credibility of your entire analysis hinges on the accuracy of the raw data flowing into it.
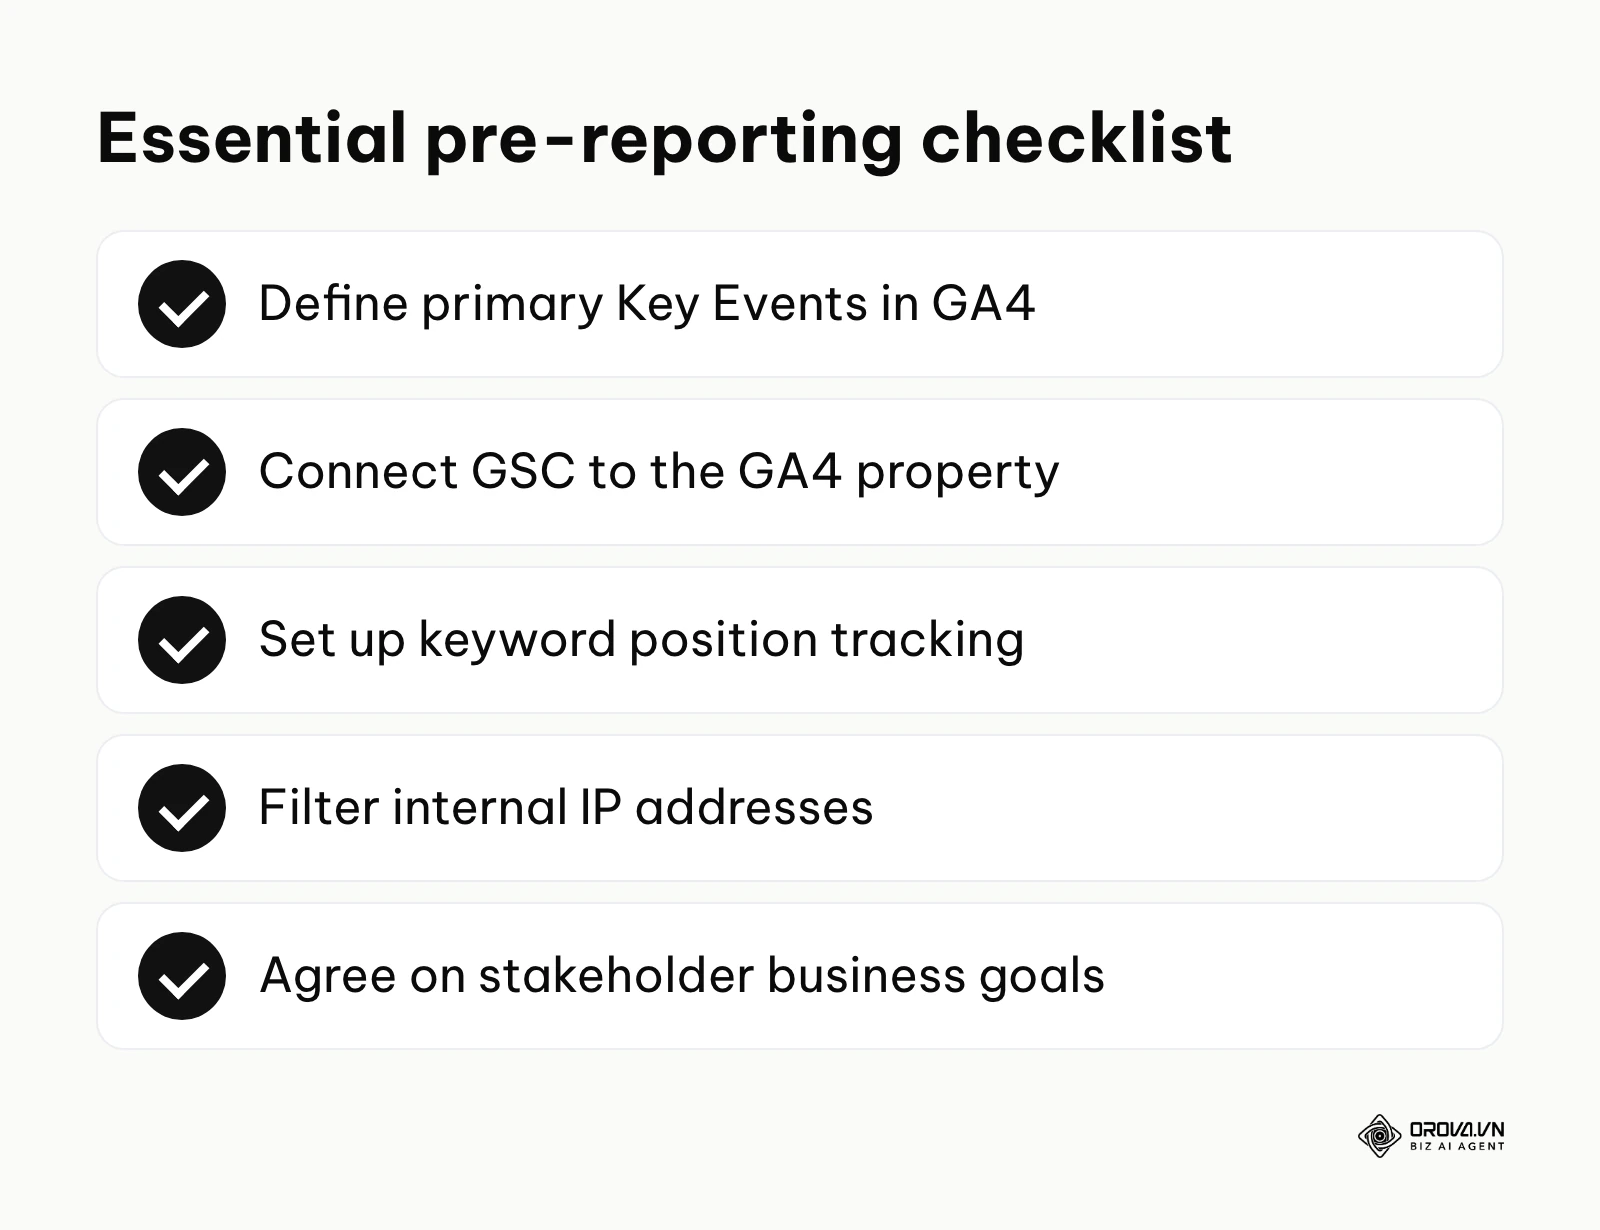
You need to gather specific access rights and configure your platforms to communicate with each other. This requires a technical understanding of how data is categorized and attributed across different systems. Without this setup, any report becomes an exercise in guesswork, as you will be unable to prove which channel drove which conversion. If you need the cross-channel view rather than the organic-only one, our marketing report guide covers how to report on every channel together.
| Required Asset | Source Platform | Estimated Setup Time |
|---|---|---|
| Conversion Event Tracking | Google Analytics 4 (GA4) | 2–4 hours |
| Clean Organic Data Source | Google Search Console (GSC) | 15 minutes |
| Keyword Position Tracking | Third-party Rank Tracker | 1 hour |
| Stakeholder Business Goals | Direct communication | 1–2 hours |
| Filtered IP Addresses | GA4 Admin Settings | 30 minutes |
First, you must ensure that Google Analytics 4 is properly configured to track your primary business objectives. In GA4, these are called Key Events (formerly conversions). Whether your goal is a completed e-commerce checkout, a filled lead generation form, or a newsletter signup, these actions must be strictly defined and tested. If GA4 cannot tell you exactly how many Key Events were attributed to the organic search channel, your report is functionally useless to a financial stakeholder.
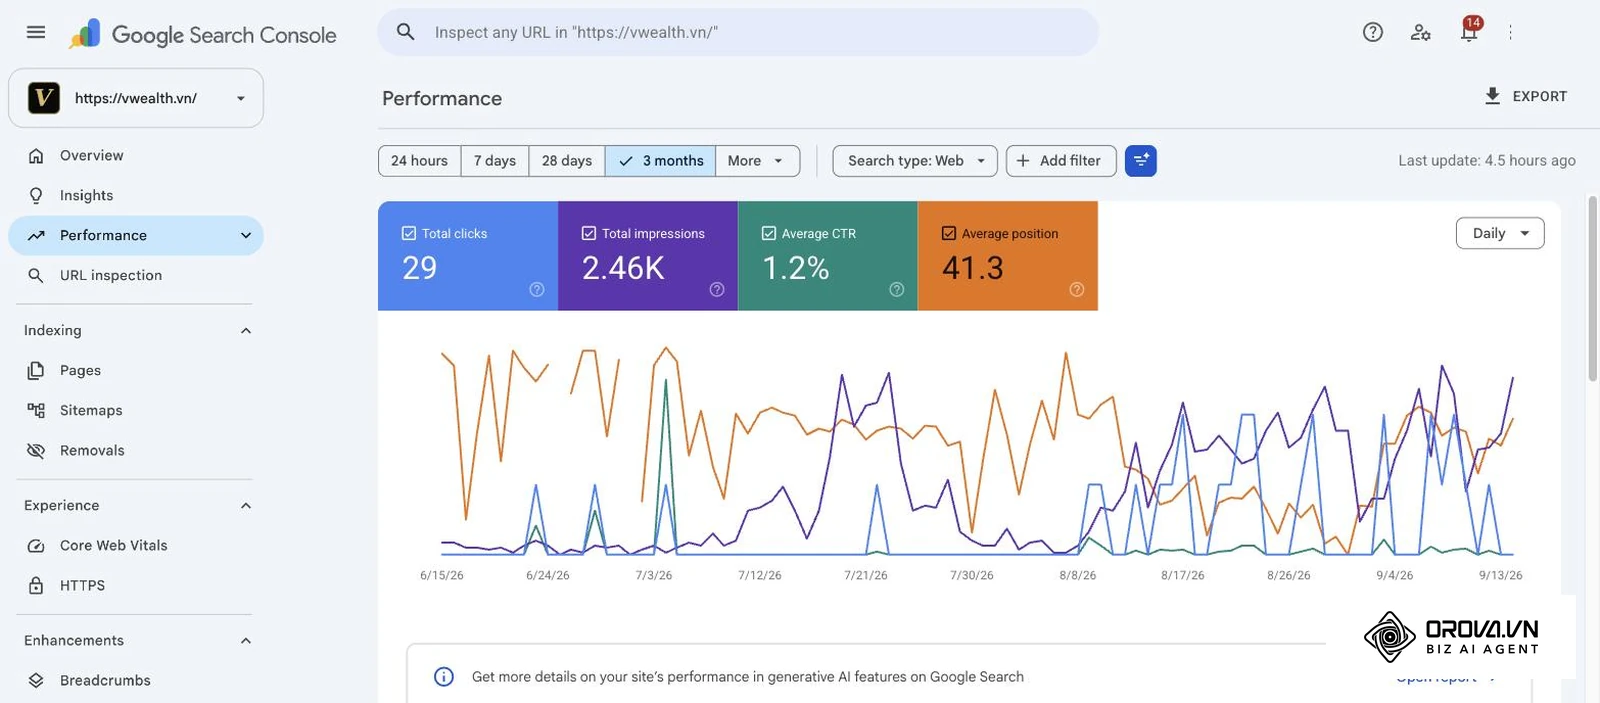
Next, you must connect your Google Search Console property directly to your GA4 property. GSC is the primary tool that provides query data directly from Google, showing you precisely what users typed into the search bar before clicking your link. However, GSC only retains data for 16 months and does not track user behavior after the click. By linking the two platforms, you begin to bridge the gap between search intent and website engagement. Finally, you must sit down with your stakeholders and explicitly ask them what metrics define success for their specific department. A sales director cares about qualified leads, while a brand manager cares about share of voice. Your preparation must align with their specific definitions of success.
How to create an SEO report: a 6-step framework
Building a compelling analysis requires moving past raw numbers and developing a systematic approach to data presentation. This six-step framework is designed to enforce discipline in how you extract, interpret, and present your findings.
Step 1: Separate in-house and agency reporting structures
The most critical mistake you can make is delivering the exact same document to an internal executive as you would to an external client. The underlying data might be identical, but the context and the required narrative are entirely different. You must define your audience before you select a single metric.
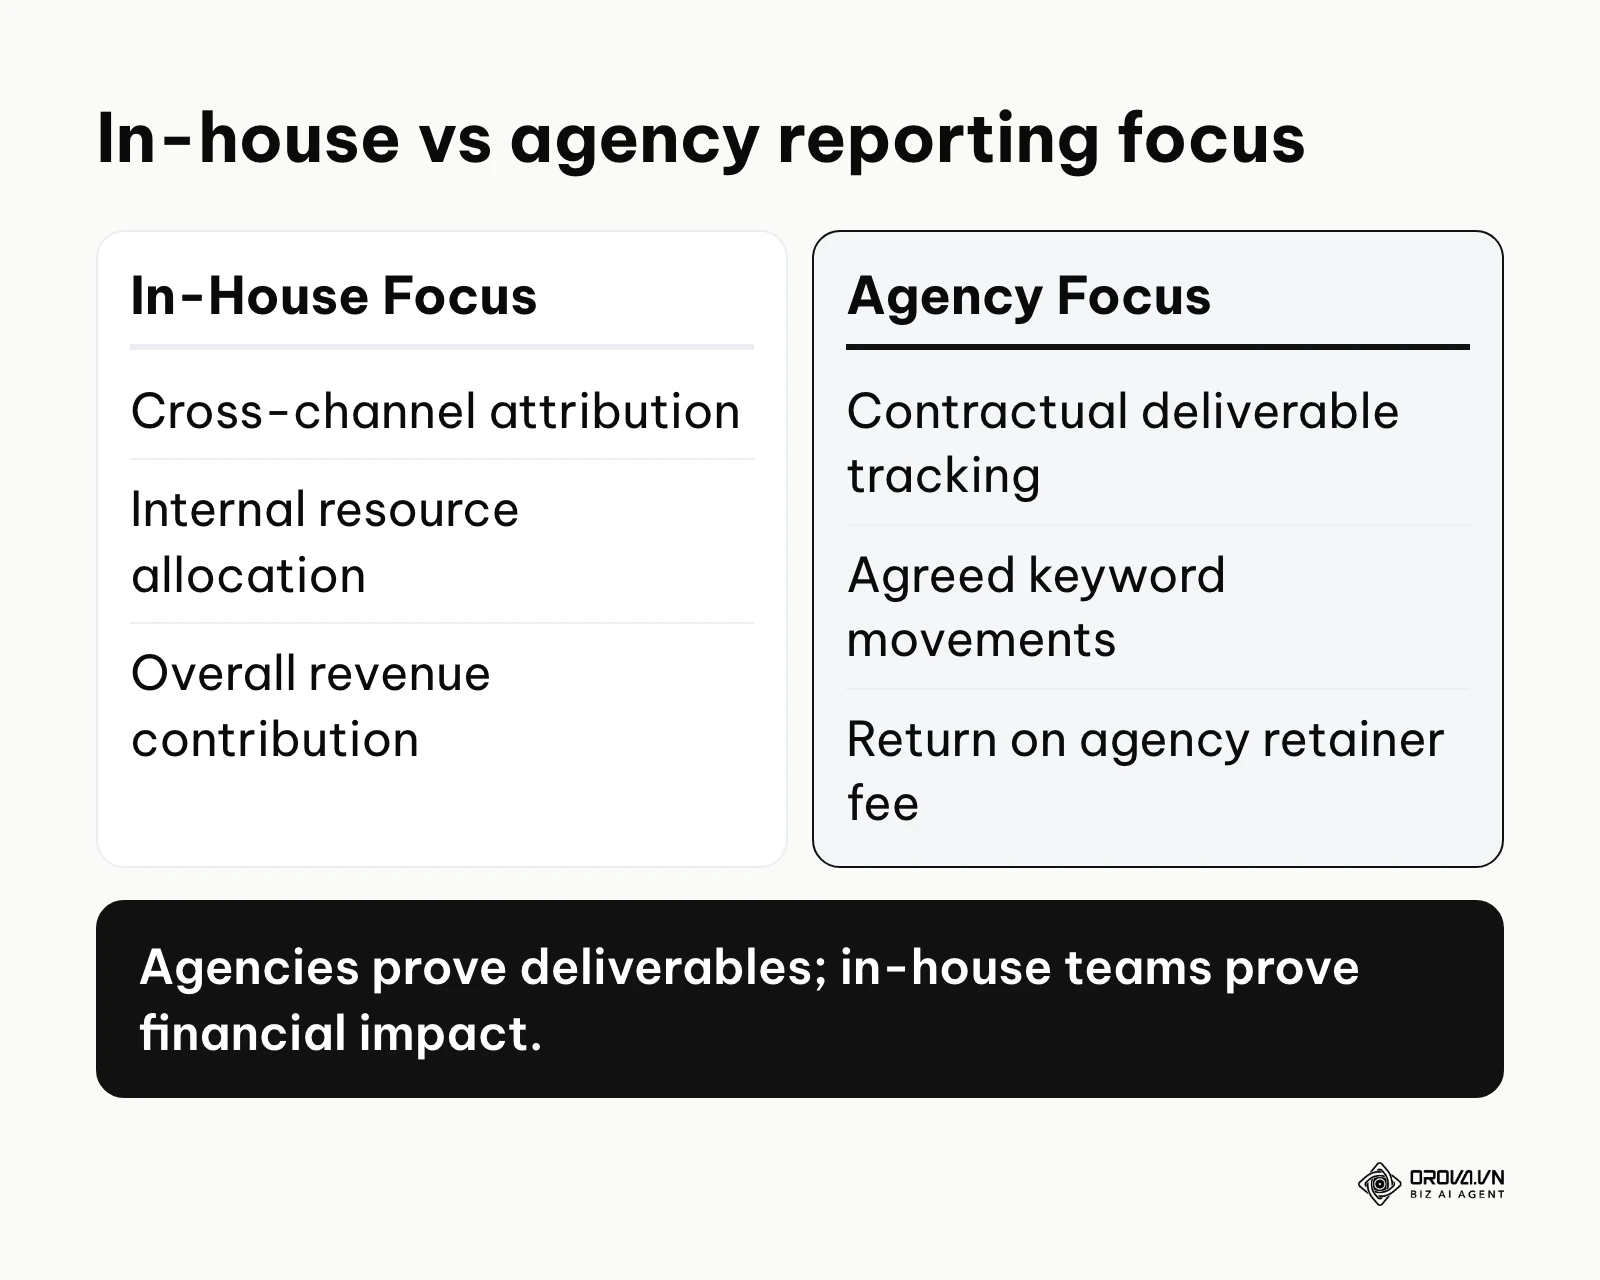
For in-house teams, the primary audience is usually a Marketing Director, a VP of Growth, or the CEO. These stakeholders view search performance as just one piece of a complex multi-channel machine. Your in-house analysis must focus heavily on cross-channel attribution. You need to demonstrate how organic content is reducing the overall Customer Acquisition Cost (CAC) compared to paid search channels. The conversation should revolve around internal resource allocation. If you need engineering time to fix core web vitals, your report must show the projected revenue loss of maintaining a slow website. In-house reports are fundamentally about proving that the salaries and resources dedicated to the department are yielding a positive return.
Conversely, if you work at an agency, your primary audience is the client who hired you. Their mindset is entirely different. They are evaluating whether you are fulfilling the specific promises outlined in your service level agreement. Agency documentation must prioritize absolute transparency regarding deliverables. You must clearly list the exact number of articles published, the specific technical errors resolved, and the movement of the exact keywords you promised to target. The client needs to see a direct correlation between the monthly retainer fee they pay and the upward trajectory of the metrics. Failure to clearly delineate these two distinct reporting styles will result in confusion and a lack of perceived value.
Step 2: Select tools and automate data aggregation
Manually downloading CSV files from different platforms and pasting them into a spreadsheet is a massive waste of human capital. This manual process is prone to human error and consumes hours of time that should be spent on strategic analysis. You must automate your data aggregation pipeline.
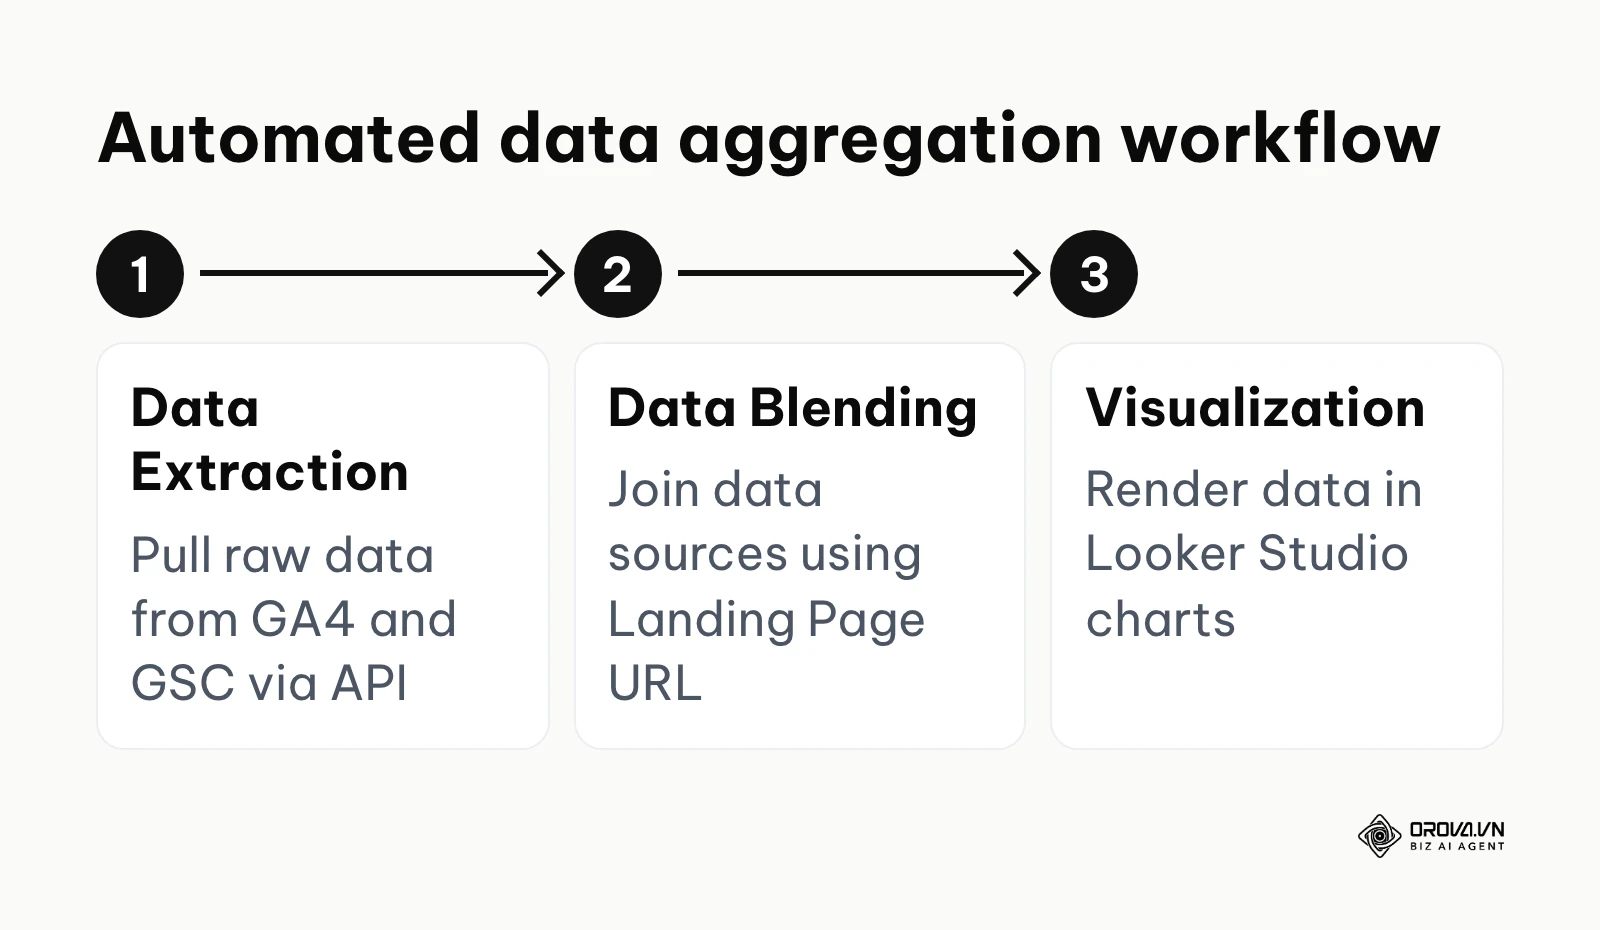
A widely used option for this automation is Google Looker Studio (Google's help pages now call it Data Studio; the steps are the same). This free platform allows you to connect directly to GA4, GSC, and various third-party rank trackers via application programming interfaces (APIs). Once connected, the data flows into your dashboard automatically and refreshes on a schedule instead of being pasted in by hand. The most powerful feature of Looker Studio is "Data Blending." This technique allows you to join the query data from GSC with the conversion data from GA4 using the "Landing Page" dimension as the join key. This blended data source allows you to see not just which page got traffic, but which specific search queries are most likely resulting in a completed Key Event.
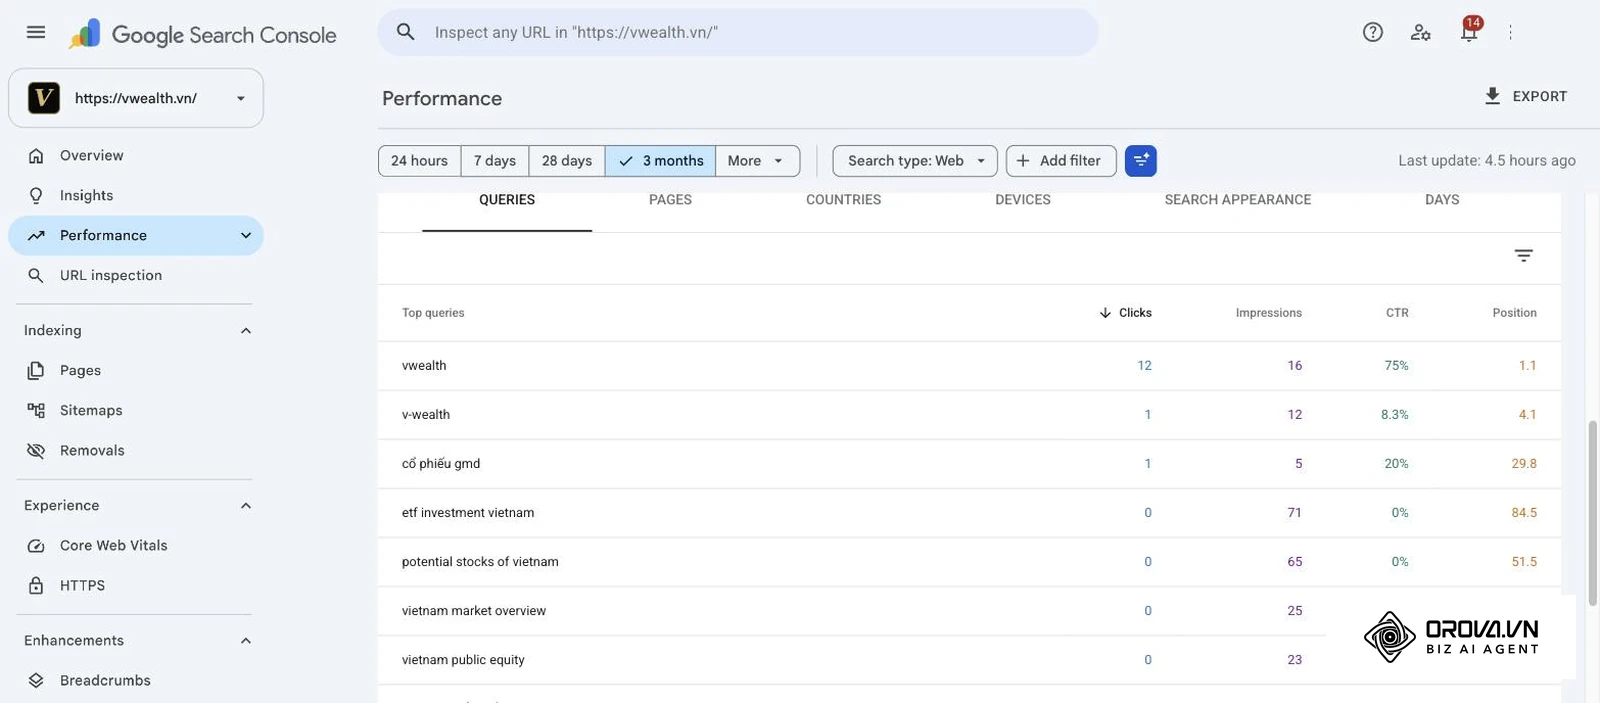
However, automation requires strict data hygiene. Before setting up your automated pipelines, you must implement regular expression (Regex) filters to separate branded search traffic from non-branded search traffic. If a user searches for your exact company name, they already knew who you were; this is a navigational query, not a new acquisition driven by your optimization efforts. If you fail to filter out branded queries, your growth metrics will be artificially inflated by offline PR campaigns or brand awareness efforts, leading to wildly inaccurate performance assumptions.
Step 3: Apply the 3-part data storytelling framework
Data without a narrative is just noise. Stakeholders do not inherently understand why a 5% increase in click-through rate matters. You must translate the data into a business narrative using a strict three-part storytelling framework: The Business Problem, The SEO Solution, and The Result.
The first part, the Business Problem, establishes the stakes. You must state clearly what business issue the company was facing. Perhaps the paid advertising costs for a specific product line had become unsustainable, or perhaps a new competitor was stealing market share in a critical geographic region. Establishing this problem grounds the rest of your presentation in financial reality. The second part, the SEO Solution, explains the strategic action you took. Did you create a cluster of informational articles to capture users earlier in the buying cycle? Did you consolidate cannibalizing pages to focus link equity? This section explains the "how."
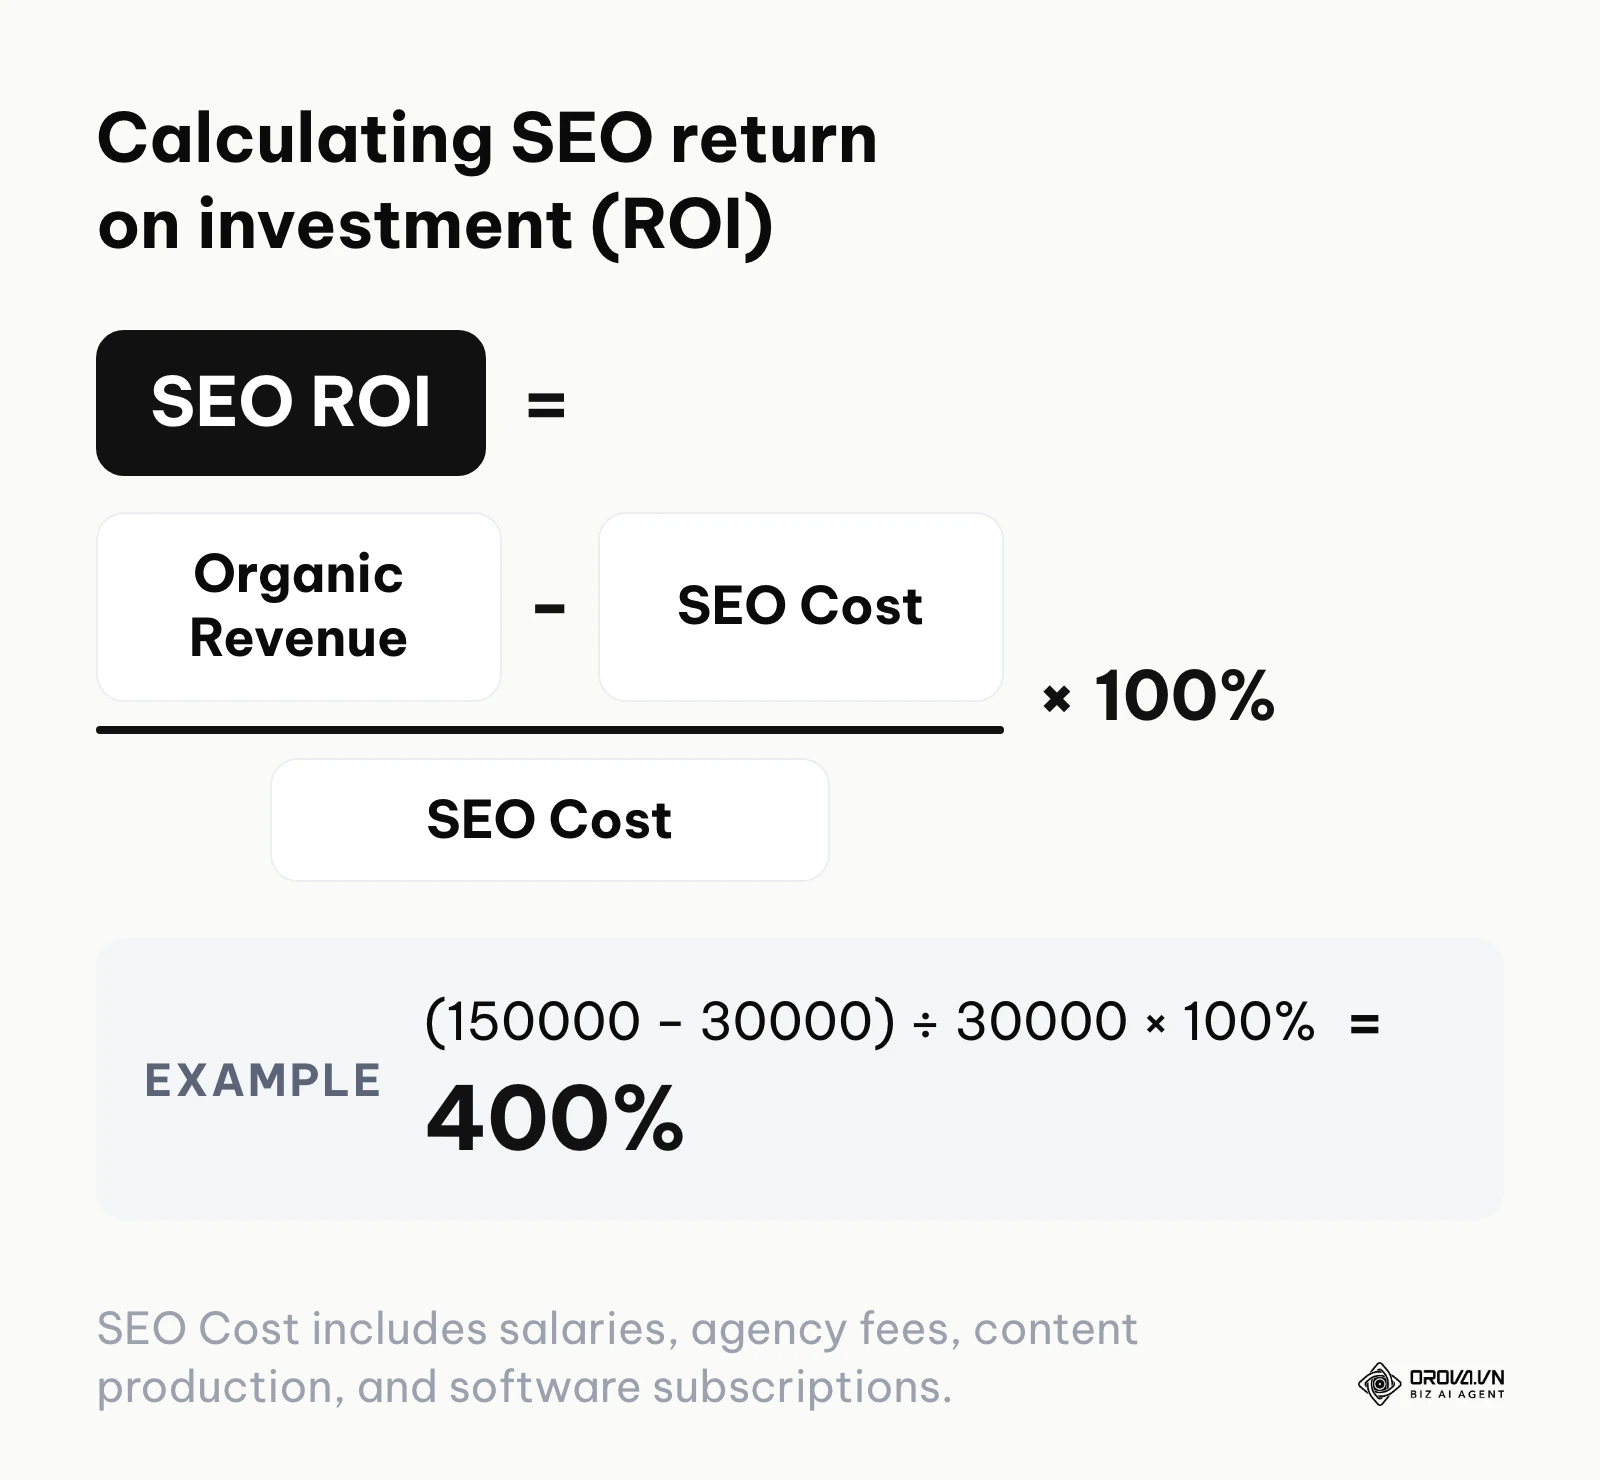
The final part, The Result, ties the technical action back to the initial business problem using hard numbers. When revenue is attributable, express it as return on investment: SEO ROI = (Organic Revenue − SEO Cost) ÷ SEO Cost × 100%, where SEO Cost includes salaries, agency fees, content production and software subscriptions. For example, 150,000 in organic revenue against 30,000 in total SEO cost (same currency) gives (150,000 − 30,000) ÷ 30,000 × 100% = 400%.
Illustrative example:
- Context: A mid-sized B2B software company where the Marketing Director needed to justify a significant budget request to the CEO for content expansion.
- Steps taken: The marketing lead extracted strictly non-branded organic traffic data from GA4. They mapped this specific traffic cohort to the "Demo Request" lead generation events. Finally, they calculated the equivalent cost to acquire those exact same leads if they had been forced to bid on them via Google Ads.
- Friction and solution: The CEO initially dismissed the organic metrics because they assumed the traffic was simply existing customers logging into the portal via branded searches. The solution was presenting the strictly filtered non-brand data, proving that these were entirely net-new prospects who had never interacted with the brand before.
- Result: The CEO immediately approved a 30% budget increase for the content team. The report successfully demonstrated that the non-brand organic strategy was generating highly qualified pipeline at approximately one-third the cost of their paid acquisition channels.
Step 4: Use AI prompts for executive summaries
The most difficult section of any presentation to write is the Executive Summary. This single paragraph must condense thousands of data points into a concise, impactful statement. Historically, this required hours of manual data interpretation. Today, you can dramatically accelerate this process using Large Language Models (LLMs). When deciding how to integrate these tools, reviewing what AI SEO is and how it works can provide deeper context on the division of labor between humans and machines.
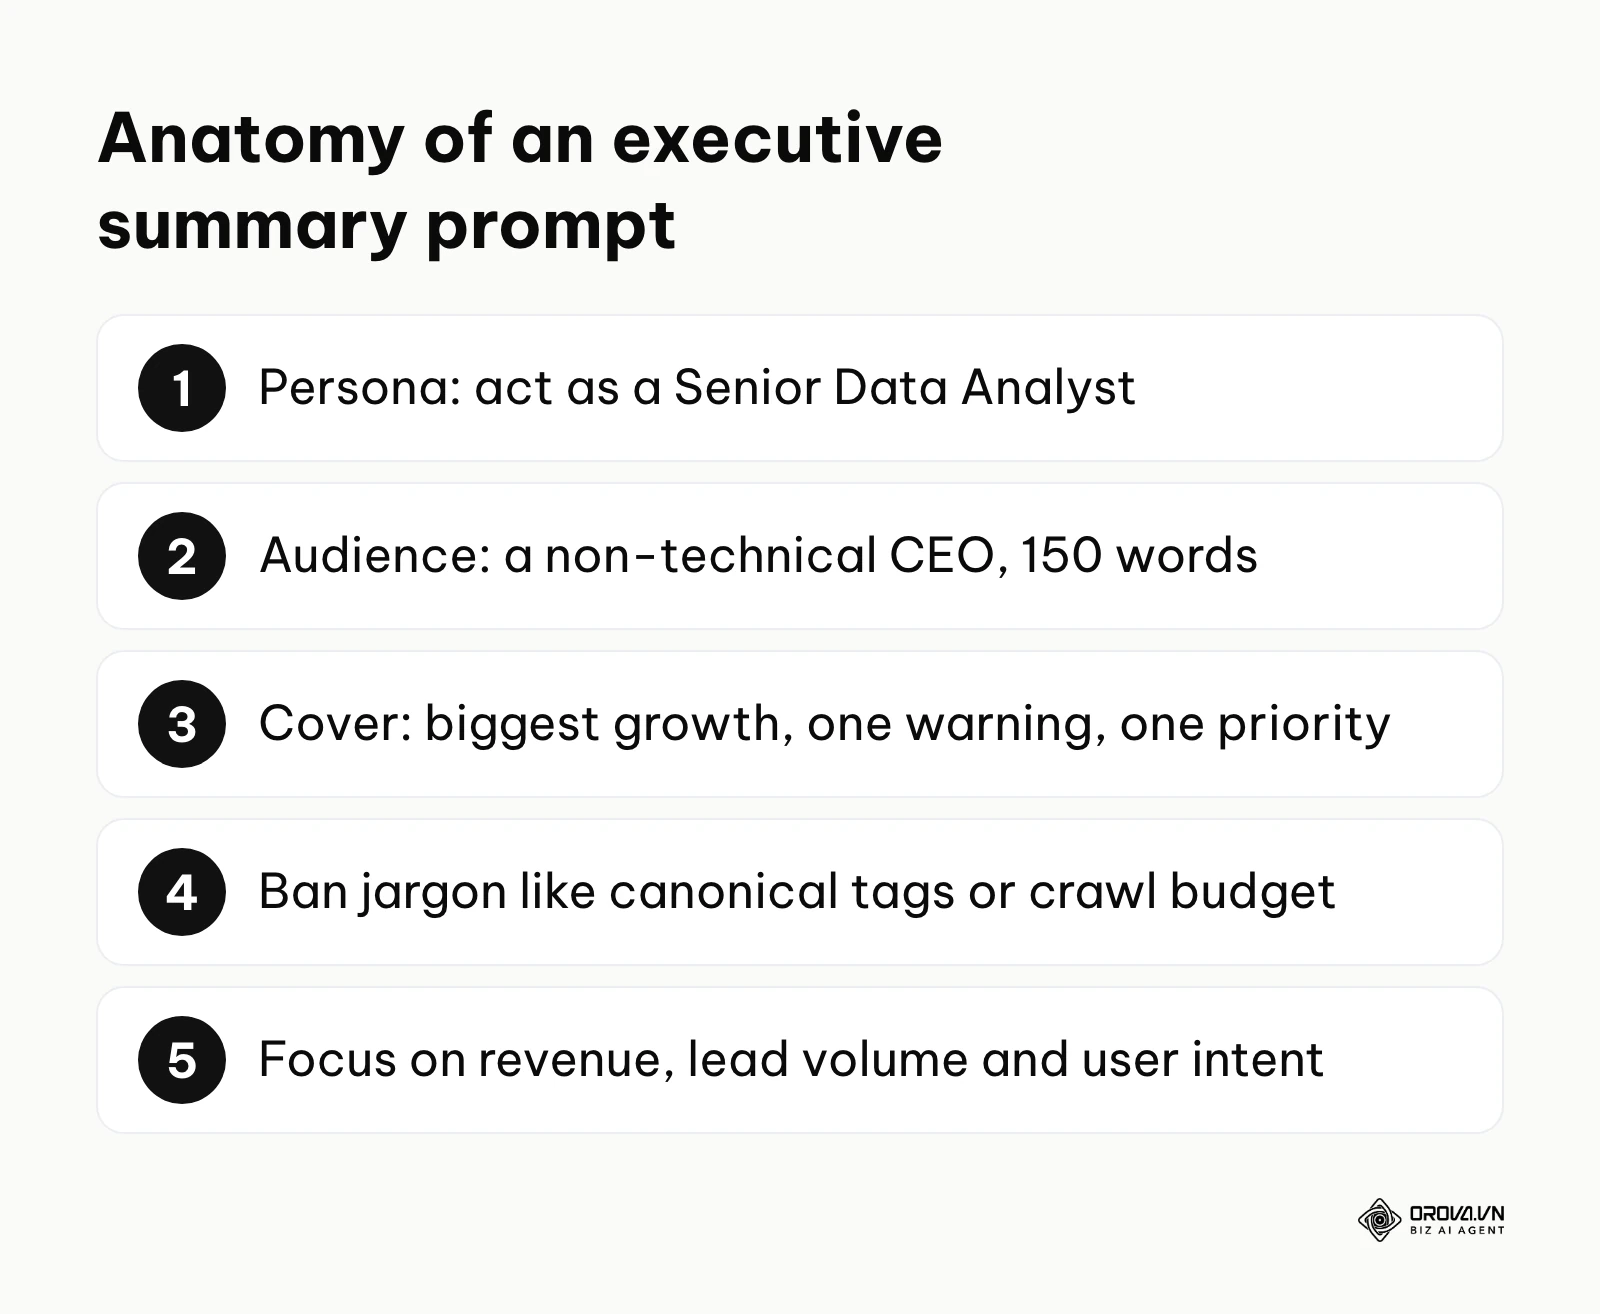
To generate a professional summary, you must provide the AI with strict constraints, a specific persona, and clean data inputs. Do not simply ask the AI to "summarize my traffic." You must use a structured prompt to force the model to look for anomalies and business correlations.
Here is an exact prompt structure you can use: "Act as a Senior Data Analyst. Review the following organic search data from GA4 and GSC for the month of October. Your task is to write a 150-word Executive Summary for a non-technical CEO. You must highlight the biggest area of growth, identify one critical warning sign related to conversion rates, and suggest one strategic priority for next month. Do not use technical jargon like 'canonical tags' or 'crawl budget'. Focus strictly on revenue, lead volume, and user intent. Here is the raw data: [Paste Data Here]."
By feeding the model structured data and demanding a specific output format, you remove the writer's block associated with executive summaries. The AI acts as a sophisticated reasoning engine, rapidly identifying correlations between impression drops and conversion spikes that a human analyst might overlook after staring at spreadsheets for hours.
Step 5: Draft the "bad news" narrative for traffic drops
Almost every guide on the internet assumes your traffic will always go up. In reality, search marketing is highly volatile. You will inevitably experience a month where traffic drops by 20% or more due to a Google Core Algorithm Update, a sudden technical failure, or aggressive competitor movements. Handling this conversation requires extreme professionalism. Hiding the drop or blaming the algorithm without a plan will destroy your credibility.
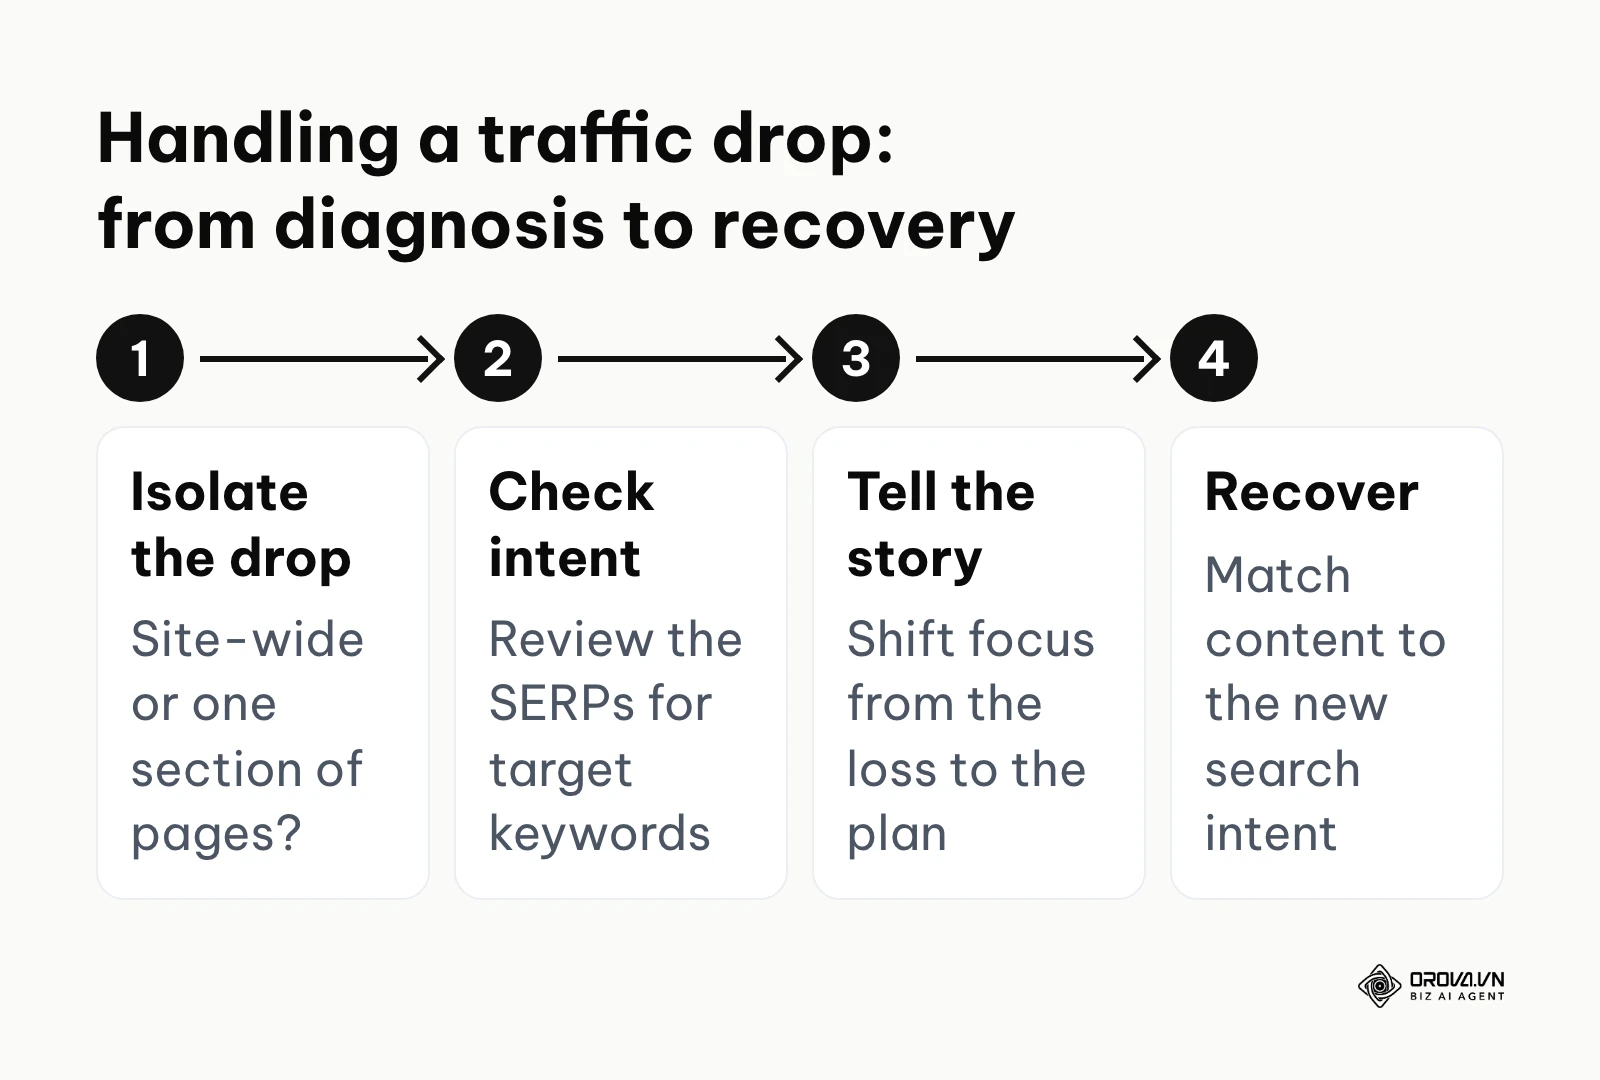
When traffic drops, your first step is rigorous diagnosis. You must isolate exactly where the drop occurred. Did the entire site lose traffic, or just one specific category of blog posts? Did your rankings actually drop, or did the total search volume for those keywords decrease due to seasonality? If you need a structured way to run that diagnosis, follow a Google Search Console SEO audit before you write a single slide. Once you have diagnosed the root cause, you must draft a "bad news" narrative that immediately shifts the focus from the loss to the recovery plan.
Illustrative example:
- Context: An e-commerce furniture retailer experienced a sudden 40% drop in organic traffic immediately following a major search engine algorithm update. The agency account manager had to present this disastrous data to the furious founders.
- Steps taken: The manager isolated the traffic drop strictly to the product category pages using GSC. They manually reviewed the search engine results pages (SERPs) for their target keywords and discovered that Google had fundamentally shifted the intent. The search engine was now rewarding long-form, informational "buying guides" rather than transactional product grids. The manager drafted a presentation explaining this intent shift.
- Friction and solution: The founders panicked and demanded a complete technical overhaul of the website architecture, believing they had been penalized for slow load times. The manager successfully stopped this massive waste of resources by visually proving the drop was intent-based, not technical. The solution presented was a rapid pivot to producing deep-dive educational content.
- Result: By deploying the new buying guides to match the new search intent, the lost traffic was entirely recovered within eight weeks. Furthermore, the overall conversion rate actually increased, as the educational guides built higher trust with users before they clicked through to the product pages.
Step 6: Build the visual dashboard layout
The layout of your dashboard dictates how stakeholders process the information. If you place complex technical metrics at the top, you will immediately lose their attention. A professional layout follows an inverted pyramid structure, starting with broad financial impact and drilling down into granular technical details.
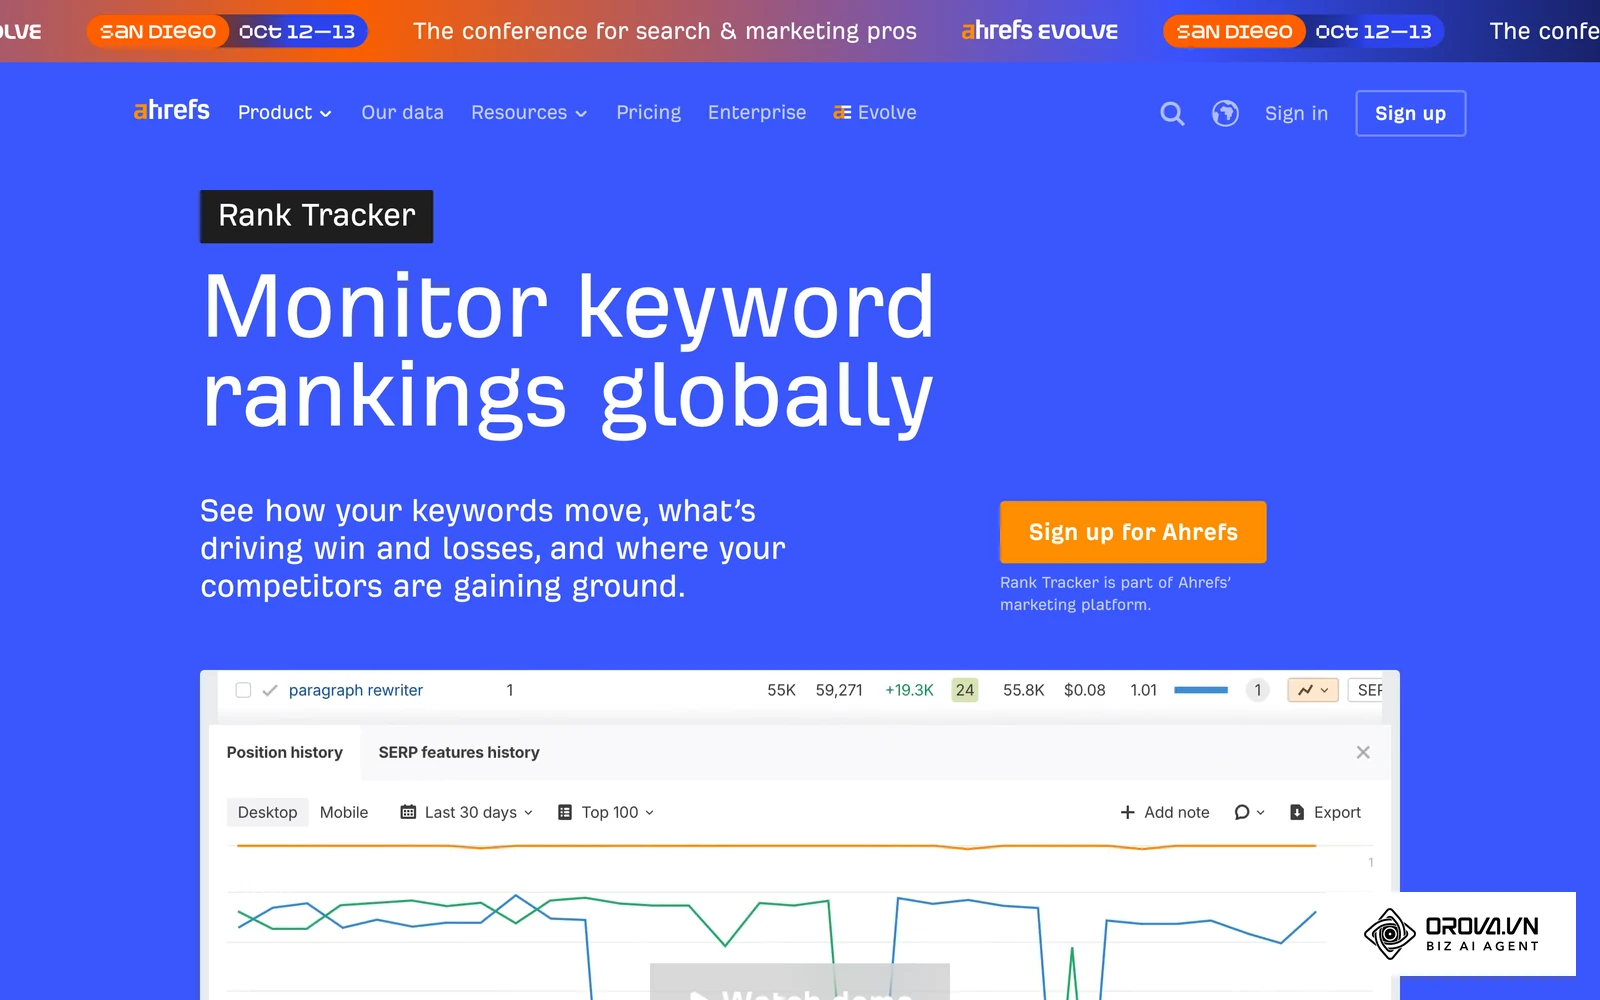
The top section of your dashboard should exclusively feature the Executive Summary and the bottom-line business metrics. This includes Total Organic Revenue, Total Organic Leads, and the overall Conversion Rate. If a CEO only looks at the top quarter of your report, they should immediately understand the financial value generated that month.
The middle section should transition into traffic and engagement metrics. This is where you display Total Non-Brand Organic Sessions, Engagement Rate, and Average Session Duration. This section proves that you are not just driving traffic, but you are driving relevant users who actually interact with the content. Finally, the bottom section of the dashboard is reserved for granular, diagnostic data. This includes specific keyword ranking movements, landing page performance tables, and technical health scores. This section is primarily for you and other marketing practitioners to reference when adjusting the strategy, but it must be available for stakeholders who wish to dig deeper into the mechanics of the campaign.
Discover Orova.vn – a Biz AI Agent platform with OROVA SEO, a complete solution for every website. The system supports search engine optimization from A to Z with features including keyword research, writing new SEO-ready articles, optimizing existing content, rank tracking, plus competitor analysis and in-depth technical analysis. Sign up today to experience OROVA SEO completely free (offer valid through July 7, 2027).
SEO reporting tools comparison: Looker Studio vs paid software
The market is flooded with software platforms designed to automate the reporting process. However, the decision ultimately comes down to a binary choice: Do you invest the time to build a custom solution in a free platform, or do you pay a monthly subscription for speed and convenience?
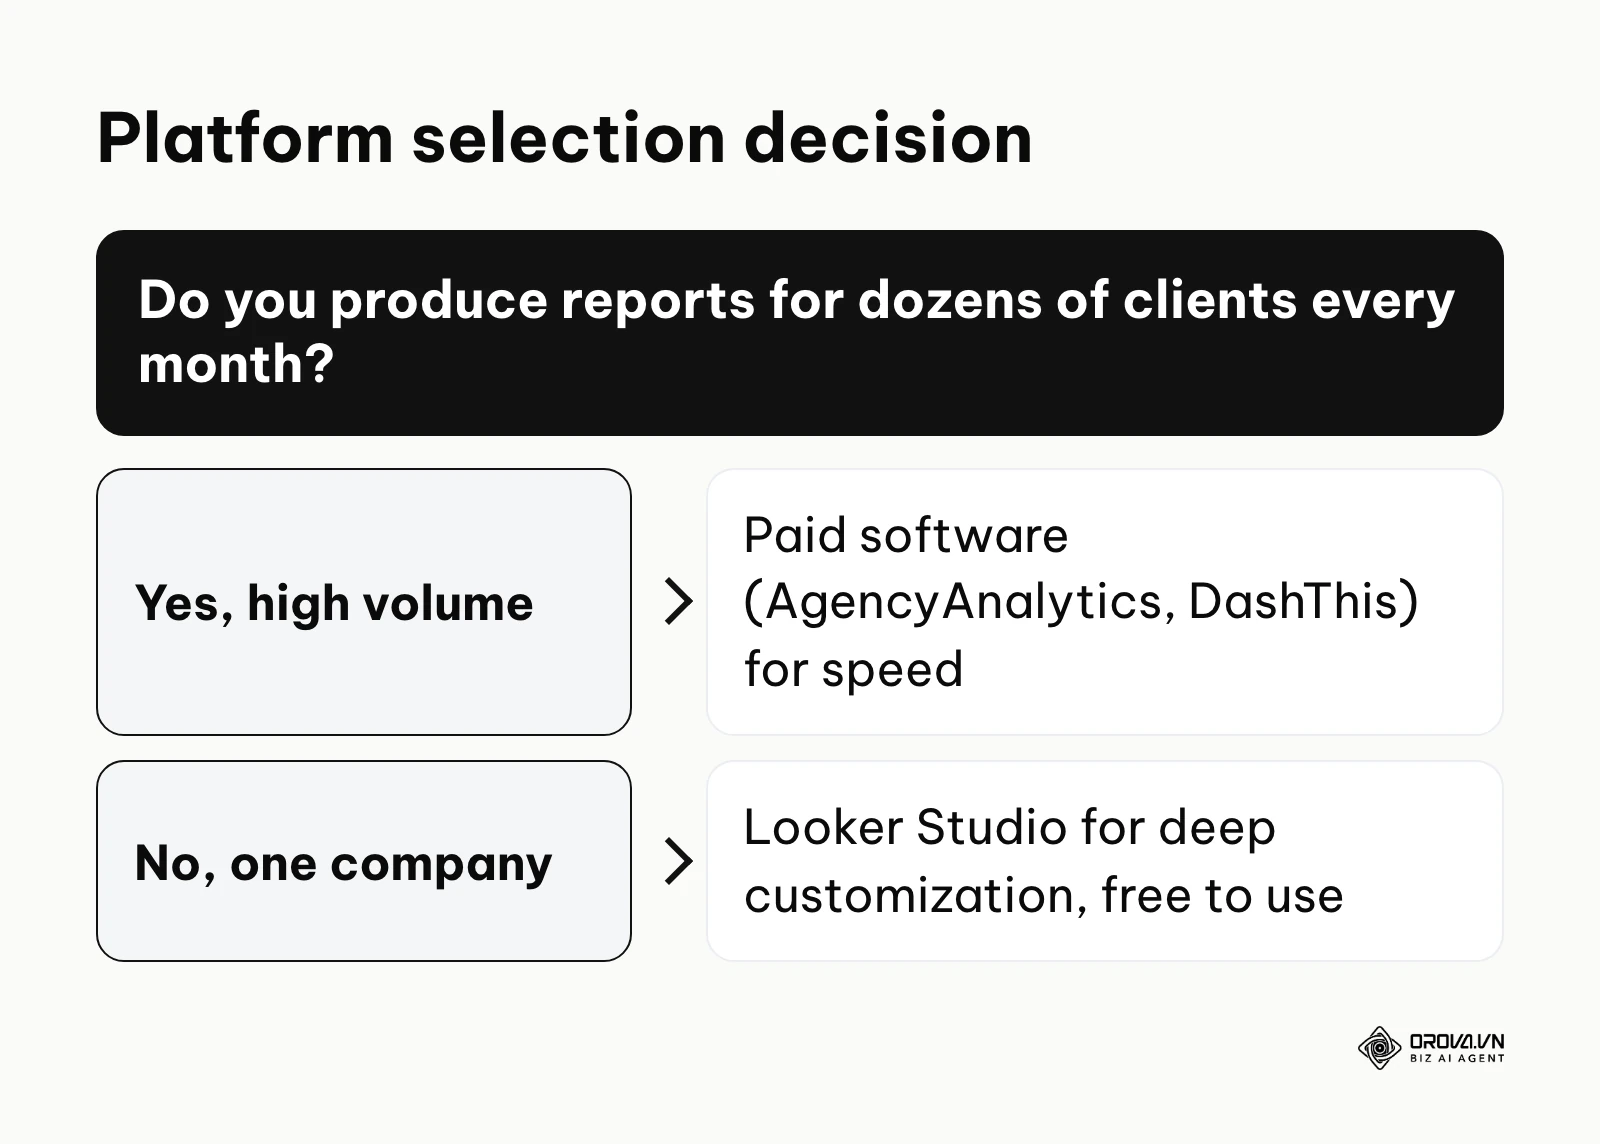
Looker Studio (now called Data Studio again on Google's help pages) is powerful and free to use. Because it is a Google product, it has native connectors for GA4 and GSC. The primary advantage of Looker Studio is absolute customization. You can build highly complex, blended data sources, apply custom Regex filters, and design the dashboard to perfectly match your corporate branding. However, the learning curve is steep. If you do not understand how data joins work, your charts will break, and troubleshooting API connection errors can consume hours of your time. Looker Studio is generally best for in-house teams who have the time to build and maintain a highly specific, customized dashboard for a single company.
On the other hand, paid reporting software like AgencyAnalytics or DashThis prioritizes speed and scalability. These platforms come with pre-built integrations for dozens of different marketing channels, including search, social media, and email marketing. You can connect your accounts and generate a professional-looking dashboard in under ten minutes. The tradeoff is a lack of deep customization. You are restricted to their pre-defined widgets and chart types, and blending complex data sources is often difficult or impossible. These paid tools are ideal for marketing agencies managing dozens of clients, where the sheer volume of reports makes manual Looker Studio maintenance impossible.
Measuring success: KPIs across the SEO project lifecycle
A common mistake is attempting to report on revenue and conversions during the first month of a brand-new project. Search engine optimization is a compounding process, and the metrics that define success change drastically depending on the maturity of the project. You must educate your stakeholders on this lifecycle so they know what to expect and when. Prior to finalizing your KPI list, reviewing a comprehensive SEO checklist ensures you are tracking the foundational elements correctly.
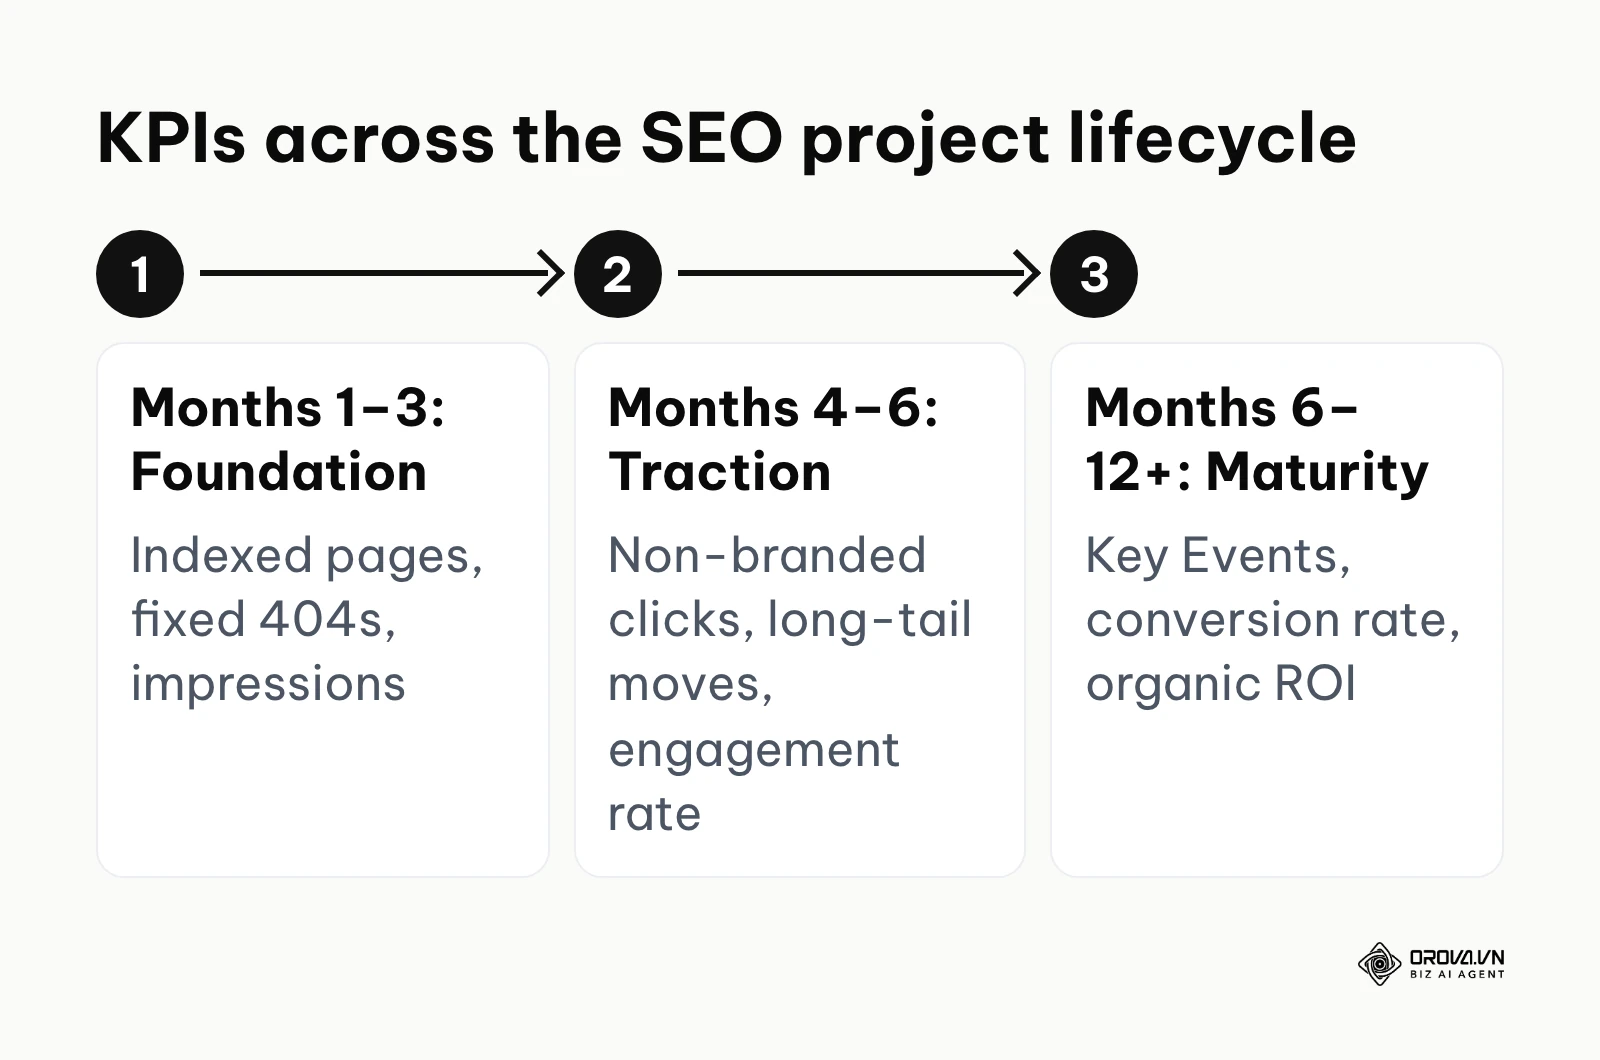
During Month 1 to Month 3, the project is in the foundational phase. If you are working on a new website or a site that has never been optimized, traffic will likely be close to zero. During this phase, you should not report on traffic or conversions. Instead, your KPIs must focus on technical health and visibility. You should report on the number of pages successfully crawled and indexed by the search engine. You should report on the resolution of critical 404 errors and broken links. The primary metric from GSC during this phase is "Impressions." An increase in impressions proves that the search engine is beginning to rank the content, even if it is on page five where no one is clicking yet.
From Month 4 to Month 6, the project enters the traction phase. The technical foundation is solid, and the content is beginning to mature. During this phase, your KPIs should shift toward user behavior. You should report on the growth of non-branded organic clicks. You should monitor the movement of long-tail keywords, moving from page three to page one. This is also the phase where you begin analyzing the Engagement Rate in GA4 to ensure the traffic arriving on the site actually finds the content relevant to their search intent.
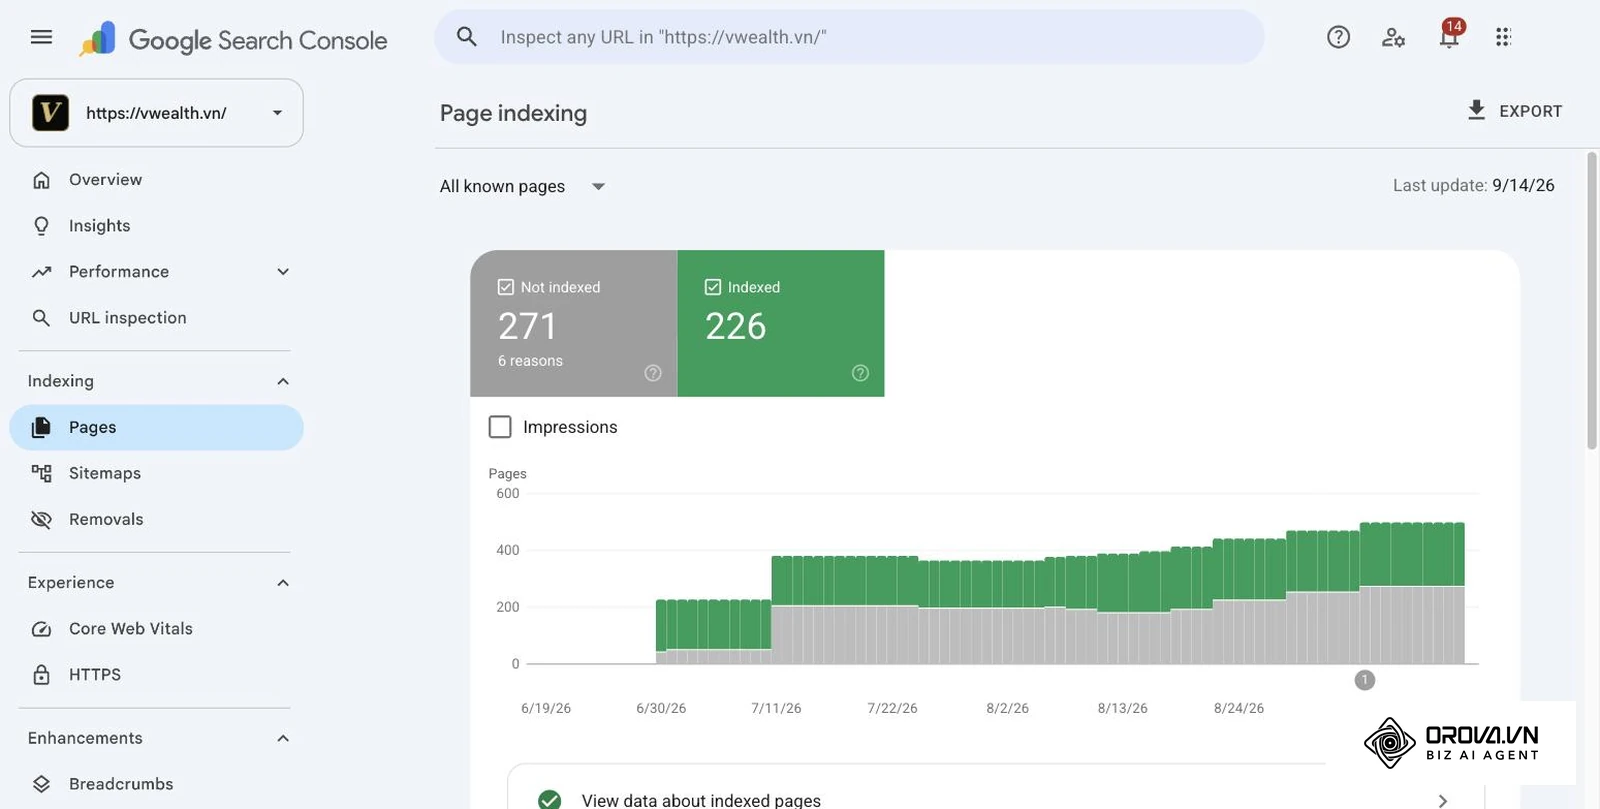
From Month 6 to Month 12 and beyond, the project is in the maturity phase. Now, and only now, should revenue and conversions become the absolute primary focus of your reporting. Your KPIs must track the total number of Key Events generated by organic search, the conversion rate of specific landing pages, and the overall organic return on investment. At this stage, technical metrics fade into the background, serving only as diagnostic tools if the primary revenue metrics begin to decline.
With OROVA.VN and the OROVA SEO module, you put an end to the exhausting days of manual work for good. Instead of struggling for hours to write articles and compile reports, the entire process is now optimized and completed in just 5 minutes.
6 common mistakes that ruin an SEO report
Even with the best tools and accurate data, the way you present information can completely undermine your credibility. Avoiding these common pitfalls is essential for maintaining stakeholder trust.
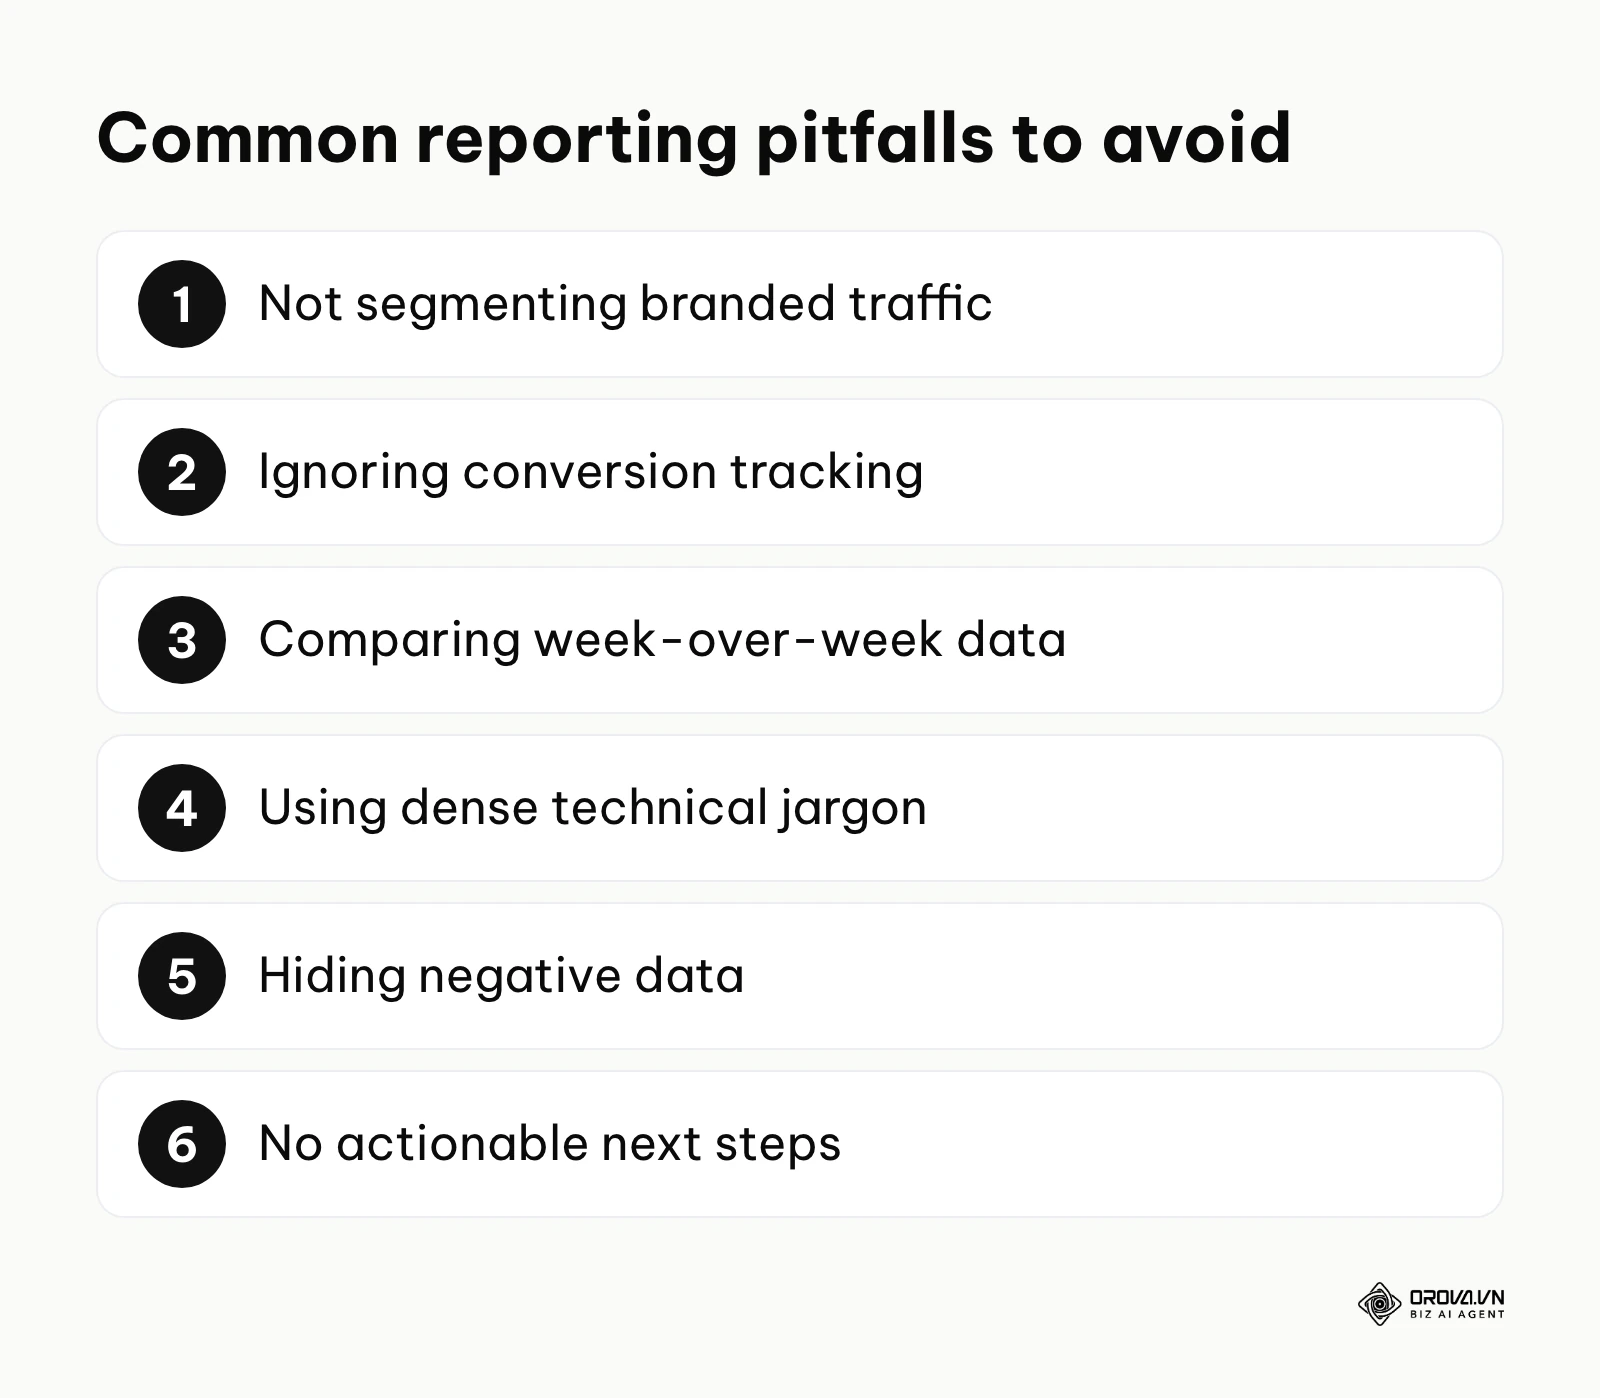
- Failing to segment branded traffic: If your company runs a massive television advertising campaign, people will search for your brand name, and your organic traffic will skyrocket. If you present this massive spike as an SEO victory, you are lying to your stakeholders. You must strictly filter out all queries containing the brand name to show the true growth of unbranded, discovery-based searches.
- Ignoring conversion tracking entirely: Showing a chart with a 200% increase in traffic means absolutely nothing if none of those users bought a product or filled out a form. If you cannot tie traffic to business value, stakeholders will eventually view your efforts as a sunk cost rather than a revenue driver.
- Comparing week-over-week data: Search volume is highly susceptible to seasonality. Comparing traffic from the week of Thanksgiving to the week prior will show a massive discrepancy that has nothing to do with your optimization efforts. You must always compare data on a Year-Over-Year (YoY) basis to account for seasonal trends, or at minimum, Month-Over-Month (MoM) for newer projects.
- Using dense technical jargon: C-suite executives do not care about "canonicalization," "render-blocking JavaScript," or "hreflang tags." When you fill your presentation with technical jargon, you alienate your audience. You must translate technical issues into business impacts. Instead of saying "We fixed a 5xx server error," say "We restored access to the checkout page, so customers can complete purchases again."
- Hiding negative data: When an algorithm update negatively impacts your site, the worst thing you can do is attempt to hide the data or manipulate the date ranges to make the chart look flat. Trust is built in difficult moments. Present the drop clearly, explain your diagnosis, and outline the immediate steps you are taking to recover.
- Providing no actionable next steps: A report that merely states what happened is a history lesson. A professional analysis must always conclude with strategic recommendations. If traffic is up, what are you doing next month to capitalize on it? If conversions are down, what specific A/B tests are you running to fix the issue?
Illustrative example:
- Context: A local real estate agency where the in-house marketer delivered a monthly presentation boasting a massive 200% spike in organic traffic.
- Steps taken: The agency owner, confused by the lack of new phone calls despite the traffic spike, asked an external consultant to review the raw query data in GSC. The consultant immediately filtered the data to isolate the agency's exact business name.
- Friction and solution: The massive spike was entirely due to a viral local news PR campaign that mentioned the company, causing thousands of people to search for the brand name directly. It had absolutely nothing to do with the marketer's content efforts. The marketer was forced to retract their previous claims and implement a strict RegEx filter in their dashboard to permanently separate brand from non-brand traffic.
- Result: Subsequent documentation showed a much flatter, but entirely accurate, growth curve. This painful correction forced the team to stop relying on PR spikes and focus their actual optimization efforts on highly competitive, unbranded local search terms like "apartments for rent near me."
Trends in SEO reporting: the author's predictions
The landscape of search marketing is shifting rapidly, and the way we communicate performance must evolve alongside the technology. Based on the current trajectory of search engine capabilities and analytics platforms, calculating performance will look fundamentally different in the near future.
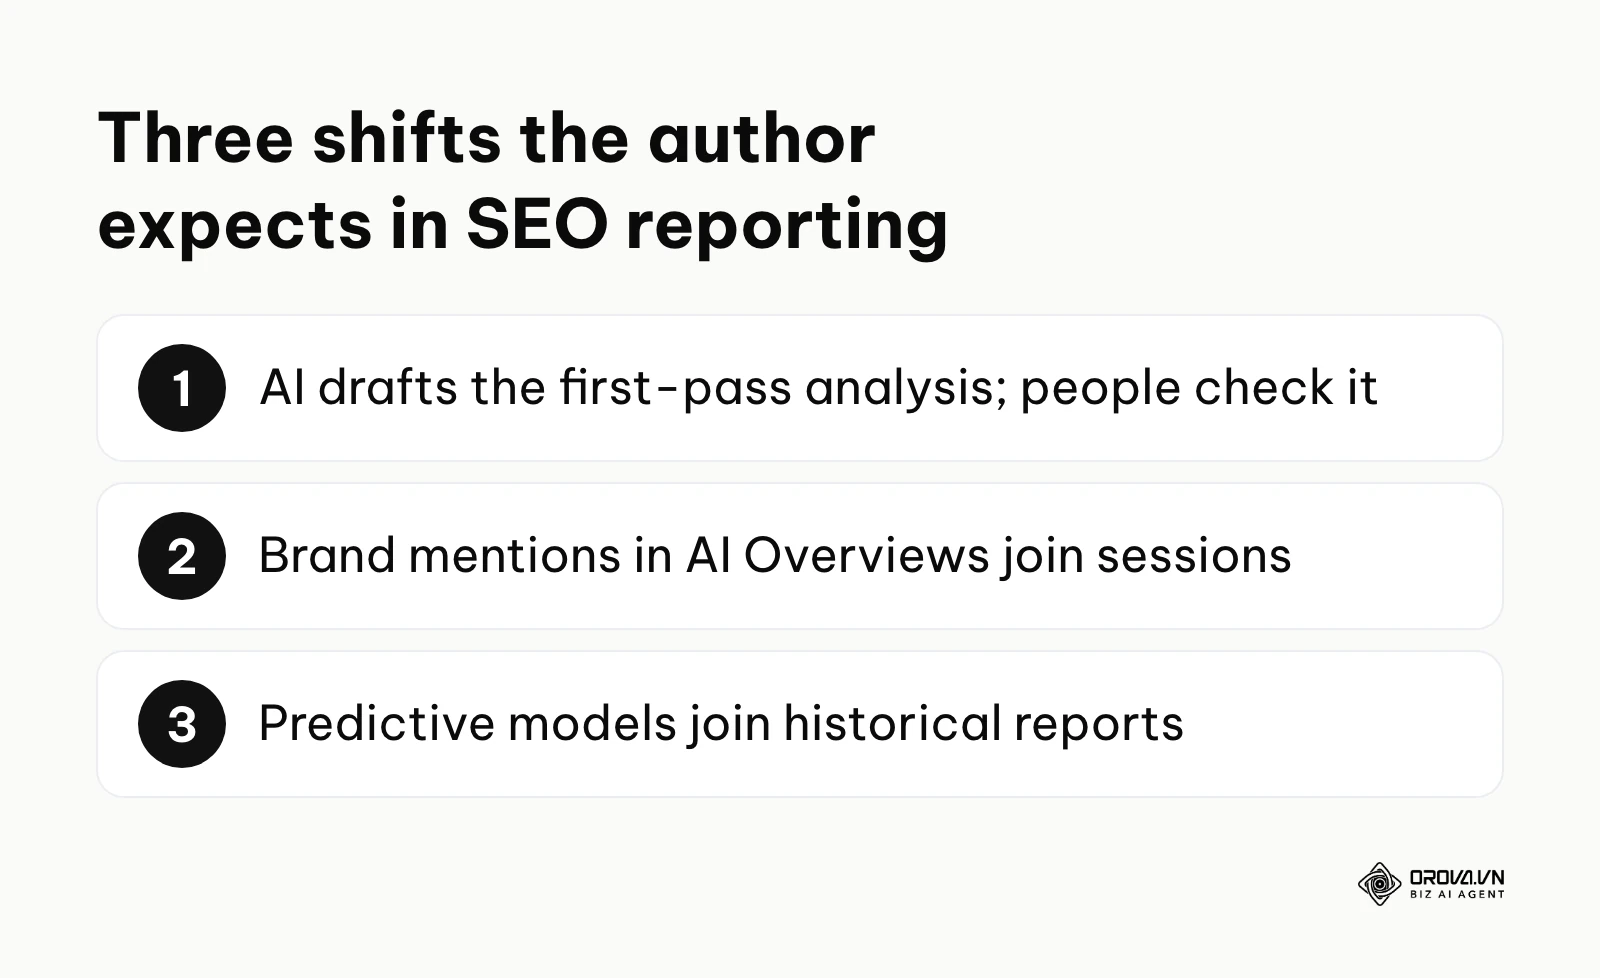
AI will take over first-pass data interpretation
I believe that the manual interpretation of analytics dashboards will become a much smaller part of the job. We are already seeing the integration of language models directly into analytics platforms. Instead of a human analyst spending hours trying to figure out why conversions dropped on a specific Tuesday, the system is likely to alert stakeholders with a written first-pass analysis. In my view, our role will shift away from data compilation and toward checking those analyses, managing relationships and making strategic decisions.
AI Overviews force a pivot to brand mentions
As Google and other engines show AI-generated overviews at the top of the results page, click-through rates for some informational queries may decline. I expect that we will increasingly need to report on brand mentions and inclusion in generative summaries alongside website sessions, rather than relying on sessions alone. If the search engine answers the user's question directly using your content, you provided value, even if the user never clicked your link. We must develop new metrics to capture this off-site visibility.
Predictive modeling joins historical analysis
Currently, almost all documentation is historical; it tells you what happened last month. I foresee a gradual shift toward predictive reporting. Using machine learning algorithms applied to years of historical GSC data, dashboards will project future traffic trends and estimate the likely revenue impact of publishing a specific cluster of content before a single word is even written. You must prepare for this by ensuring your historical data is immaculately clean today, as predictive models depend on long, consistent historical data. Of course, sudden algorithmic shifts or unprecedented global events could render these predictive models temporarily inaccurate, requiring human oversight to adjust the baseline assumptions.
Frequently asked questions about SEO reporting
What if traffic increases significantly but conversions remain flat?
This is the most common and frustrating scenario in search marketing. When traffic spikes without a corresponding increase in revenue, it almost always indicates a search intent mismatch. You have likely ranked a piece of content for a broad, high-volume informational keyword, but the users searching that term have zero intention of making a purchase. The solution is not to generate more traffic, but to audit the landing pages and shift your focus toward lower-volume, highly transactional keywords. Extracting raw query data to diagnose this issue requires understanding how to use Google Search Console for SEO effectively.
How long should a professional presentation be?
If you are delivering a PDF or a slide deck, it should never exceed three to five pages. If you are delivering a live dashboard, the stakeholder should not have to scroll more than two times to see the bottom-line financial impact. Executives suffer from severe decision fatigue; burying your most important insights on page twelve guarantees they will never be read. Brevity is a sign of deep analytical understanding.
What is the exact difference between an SEO report and a general marketing report?
A general marketing report aggregates data from multiple channels, including paid search, social media advertising, email marketing, and organic search, to calculate the blended customer acquisition cost. An SEO report is a deep-dive specifically focused on the organic search channel. It isolates technical website health, organic query data, and backlink profiles to determine the isolated ROI of search optimization efforts, which is then fed upward into the broader marketing overview.
How is AI changing the expectations of stakeholders?
Stakeholders are becoming accustomed to instant, highly synthesized information in their daily lives due to consumer AI tools. Because of this, their tolerance for receiving raw, unformatted data dumps is rapidly decreasing. They now expect you to act as an intelligent filter. They expect your documentation to immediately tell them the "so what" behind the numbers, as they know the technology exists to rapidly interpret large datasets.
Where to start?
Transitioning from a chaotic data dump to a professional, automated reporting framework can feel overwhelming. You do not need to implement every strategy discussed in this guide immediately. Your next steps depend entirely on your current state of operational maturity.
If you currently have no reliable tracking in place: Your absolute first priority is establishing a clean data foundation. Do not attempt to build a dashboard or write an executive summary. Spend your next working session entirely within the GA4 interface. Define your primary Key Events, ensure cross-domain tracking is functioning properly if you use third-party checkout software, and strictly filter out your company's internal IP addresses so employee activity does not inflate your traffic metrics.
If you are still manually copying data into spreadsheets: Your immediate goal is to eliminate manual extraction. Dedicate your next afternoon to creating a free Google Looker Studio account. Connect your GA4 and GSC properties as data sources. Build a single, simple dashboard that displays a line chart of organic sessions and a table of top-performing landing pages. The goal is not perfection; the goal is establishing an automated data pipeline that updates itself without your intervention.
If you have an automated dashboard but stakeholders ignore it: The problem is not your data; the problem is your narrative. Before your next presentation, completely remove all technical jargon from the first page of your document. Implement the three-part data storytelling framework. Force yourself to write a concise executive summary that clearly connects a recent technical implementation to a specific business outcome, using the AI prompt structures provided to synthesize the insights rapidly.
About the author

Builder of Orova
Nguyễn Đỗ Trọng Ân has 8 years of experience in marketing, including 6 years managing market development across Asia. He builds Orova, a Biz AI Agent that never sleeps: it plans, runs and optimizes work for businesses.
Run your business with AI Agents
Orova is the always-on Biz AI Agent — it plans, runs, and optimizes the work for you.
Save time, unlock productivity.