
Multi-Touch Attribution Models Explained, With the Trade-offs

You are building the quarterly slide and the numbers will not add up. Google Ads says one thing, Meta says another, TikTok says a third thing, and when you stack them together the total is way higher than the actual number of orders your store processed. You did not do anything wrong. Each platform is simply reporting what it saw, and none of them saw the whole customer journey. This is exactly the problem multi touch attribution exists to solve: it is a way of splitting credit for a single sale across all the ads and touchpoints that led up to it, instead of letting three platforms each claim the entire sale for themselves.
The trouble is that most owners try to fix this by picking whichever model sounds fair and trusting it going forward, without realizing that every single model leans in its own direction. Some models are generous to the first ad someone ever saw. Others are generous to the last click before checkout. None of them are neutral, and if you do not know which way a model leans, you end up making budget calls based on a number that was quietly built to favor one channel over another.
This piece walks through the six ways credit gets split, plainly, so you can see which one fits your business and which one you should be suspicious of. You will also see why platform-reported numbers are structurally flattering to whoever reported them, what a more honest check actually looks like, and a simple rule you can use even if your team is too small to run formal tests. By the end, you will be able to look at Thursday's slide and know which numbers to trust, which to discount, and why.
What Is Multi Touch Attribution?
Multi touch attribution is a set of rules for splitting credit for one conversion across every ad, email and organic visit that preceded it. Instead of one channel taking the whole sale, each touchpoint gets a share. The rule you choose decides the answer, which is why the model matters as much as the data.
That is marketing attribution explained in one line. The longer version needs three pieces, and most teams only have two of them.
The first piece is a path: an ordered list of the interactions one person had before buying. Search ad on the 2nd, Instagram video on the 5th, an organic visit from a blog post on the 9th, a brand search on the 12th, purchase. Without a stitched path you have no touchpoints to split anything across, and you are doing single-touch attribution whether you admit it or not.
The second piece is a window: how far back you are willing to look. A 7-day window and a 90-day window produce different paths from identical behaviour, because the 7-day version simply deletes the first three touches and hands their credit to whatever survived.
The third piece is the model: the arithmetic that turns a path into a set of percentages. This is the part everybody argues about and the part that matters least, which is one of the quieter jokes of this whole field. Get the path and the window wrong and no model will save you. Get them right and the model choice moves numbers by a lot less than people expect.
Worth being blunt about the ceiling. Attribution is a correlational accounting exercise, not a causal one. It answers "which ads appeared before the purchases we recorded" and it dresses that answer up as "which ads caused the purchases". Those are different questions. Every trade-off in this article comes from that one substitution.
Why Three Platforms Claim the Same Sale
Before models, understand the mess models are applied to. Your 921-versus-604 gap has causes, and they compound rather than cancel.
Each platform only sees itself. Google Ads cannot see that Meta showed the same person a video two days earlier. Meta cannot see the branded search. Each one runs its own attribution independently, on its own data, and each one credits itself with the conversion it observed. Nobody is lying. There is simply no shared ledger.
The windows differ, and the defaults differ. Meta's Business Help Centre documents a default attribution setting of 7-day click and 1-day view. Google Ads uses its own conversion windows, configurable per action. If one platform looks back seven days and another thirty, they will disagree about the same purchase even if they somehow shared data.
View-through credit exists on some platforms and not others. A scrolled-past impression that was never clicked can earn credit. That is defensible for brand video and indefensible for a high-frequency retargeting set that shows a hundred impressions a week to people who were going to buy anyway. The higher your retargeting frequency, the more view-through inflates you.
Some conversions are modelled, not observed. After Apple's App Tracking Transparency arrived in iOS 14.5, and as browser cookie restrictions tightened, platforms began estimating conversions they can no longer see directly. Modelled conversions are a reasonable engineering response to missing data. They are also, by definition, not a count of things that happened.
Lag shifts everything sideways. Purchases land days after the click and are back-dated to the click date, so today's numbers for the last week are always understated and always improve on their own. If you compare a fresh week against a settled one you will conclude a channel collapsed when it merely has not finished reporting. That mechanic deserves its own treatment, and we go through it in ROAS Formula & Conversion Lag: Why Today's ROAS Is Wrong.
Deduplication depends on an identifier you may not be sending. If your pixel and your server-side events do not carry a shared event ID and a stable order ID, one purchase can be recorded twice inside a single platform, before any cross-platform overlap is considered.
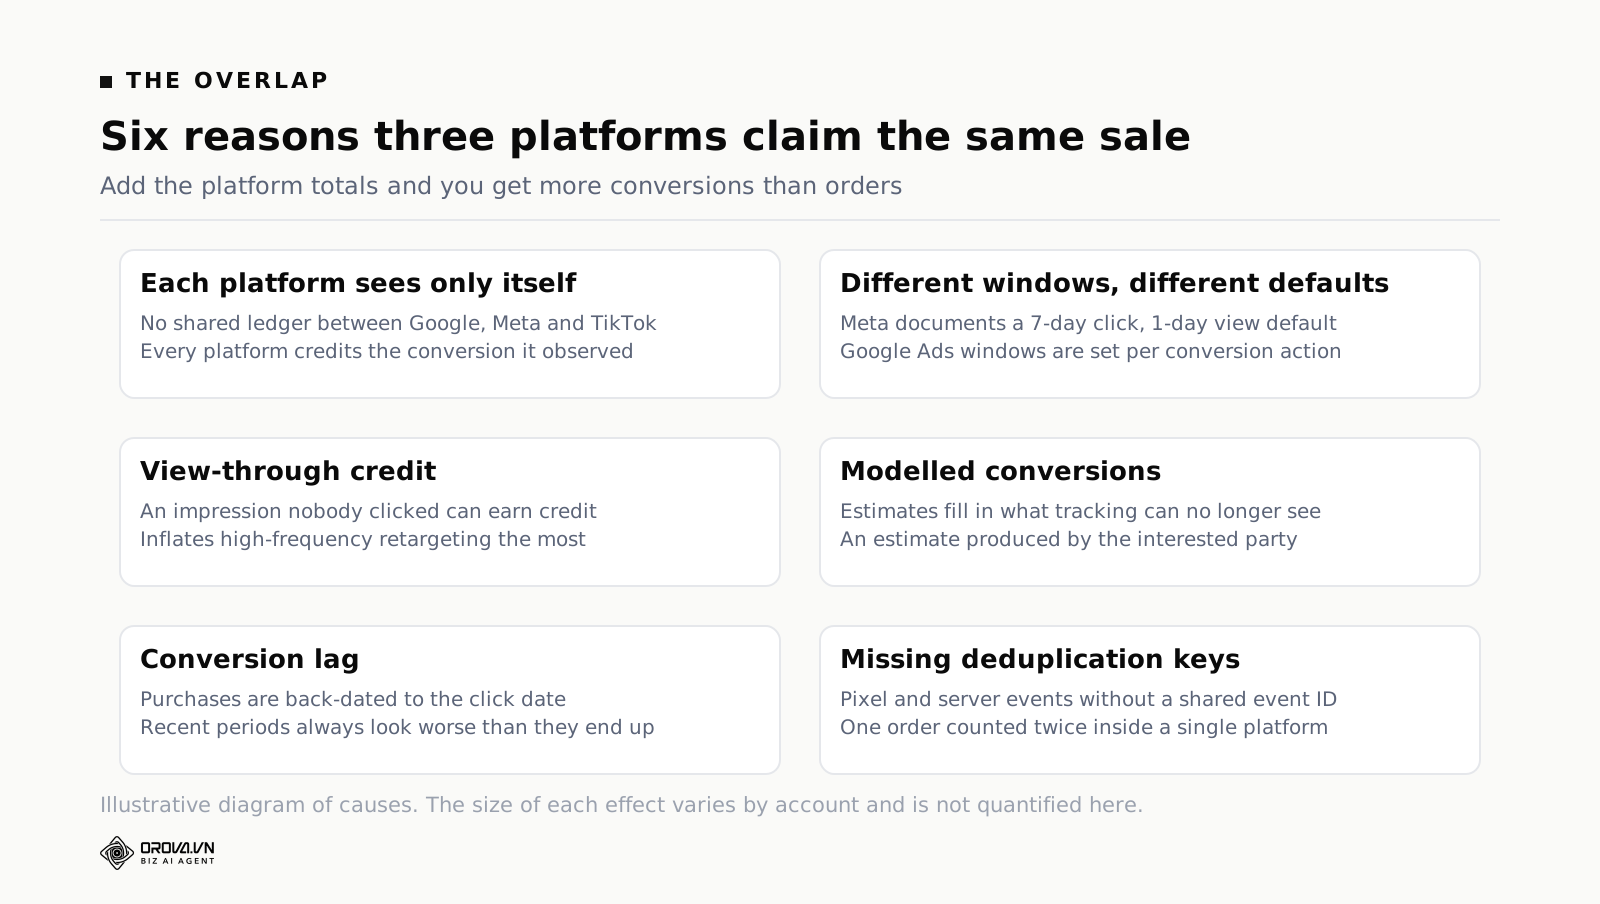
Notice what none of those causes is: a broken model. You can fix all six and still have to choose how to divide credit. That is the next problem.
The Six Attribution Models Compared
Six models turn up in almost every tool. Here is what each does, the direction it distorts, and the situation where it is defensible.
First touch
All credit to the earliest interaction in the window. Simple, stable, and easy to explain to someone who has never opened an ad platform.
The bias is straightforward: first touch systematically over-credits awareness channels and under-credits everything that closes. Broad prospecting, YouTube, top-of-funnel display and any channel that catches people early look excellent. Search on high-intent terms looks pointless. Run your budget on first touch for two quarters and you will build a beautiful discovery machine that converts nobody, because you defunded the part that converts.
It is defensible for one job: understanding where demand is being created when you are launching a new product and genuinely do not know which audiences are discoverable.
Last touch, or last click
All credit to the final interaction before the purchase. This is still the most widely used model on earth, mainly because it is the default in most reporting and requires no path data at all.
The bias is the mirror image and it is expensive. Last touch massively over-credits branded search, retargeting and email, because those are the channels people bump into once they have already decided. It teaches you to shift budget toward the cheapest, closest-to-purchase channels, which look outstanding right up until the demand feeding them dries up. The classic failure is cutting prospecting because it "does not convert", watching branded search volume fall six weeks later, and never connecting the two events.
It is defensible for direct-response accounts with genuinely short paths, and for the specific question "which ad was in front of them at the moment of purchase".
First touch vs last touch
Worth pausing on the pair, because looking at first touch vs last touch side by side is the cheapest attribution diagnostic there is, and it needs no new tooling.
Run the same period under both models and compare each channel's share. A channel that gets far more credit under first touch than last touch is an opener: it creates demand it does not personally close. A channel that gets far more credit under last touch than first touch is a closer: it harvests demand created elsewhere. A channel that scores similarly under both is doing both jobs, or has such short paths that the distinction does not apply.
That single comparison tells you more about your account structure than most attribution projects do, and it takes an afternoon. It will not tell you the correct budget split. It will tell you which channels are structurally dependent on each other, which is exactly the knowledge that stops someone cutting a channel that was holding up three others.
Linear
Every touchpoint gets an equal share. Four touches, 25% each.
Linear's bias is that it treats a scrolled-past display impression and a forty-minute pricing-page session as equal contributions, which they are not. Because it is even-handed it also rewards volume: a channel that appears many times in many paths accumulates credit through repetition rather than influence. Retargeting and remarketing display do disproportionately well under linear for that reason alone.
It is defensible as a diplomatic default in a business with genuinely long, multi-channel consideration paths, and where the reporting's job is to stop teams fighting rather than to set budget.
Time decay
Credit increases the closer a touchpoint sits to the conversion, following a half-life. A 7-day half-life means a touch seven days before the purchase gets half the weight of one on the day itself.
Time decay is last touch with the corners sanded off. It leans toward closers, just less violently, and its bias scales with the half-life you set — a short half-life makes it nearly last touch, a long one drifts toward linear. Most tools default to seven days and most users never change it, which means most time-decay reports are running an assumption nobody in the room has examined.
It is defensible for considered purchases with a compressed decision phase: the person researches for weeks, then decides in three days, and you want the decision window to dominate.
Position based, or U-shaped
Typically 40% to the first touch, 40% to the last, and the remaining 20% split among everything in the middle.
The bias is a value judgement dressed as arithmetic. It asserts that discovery and closing matter equally and that the middle barely matters, which is a defensible worldview and a completely arbitrary one. Nothing in your data produced the 40/20/40 split; a product manager chose it. Middle-of-funnel content — comparison pages, reviews, nurture email — is structurally punished by this model no matter how well it performs.
It is defensible when you already know your paths follow a discover-then-decide shape and you want a stable rule that will not swing month to month.
Data driven
Instead of a fixed rule, the platform compares the paths of people who converted with the paths of people who did not, and assigns credit according to which touchpoints shift the probability of conversion. Google made this the default in Google Ads and, per Google Analytics Help, retired the other models from GA4 in 2023, leaving data-driven and last click. Google Ads Help documents the same retirement of first click, linear, time decay and position-based models on its side.
Data-driven attribution is genuinely better than a fixed rule, and it has three trade-offs that get glossed over.
It needs volume. Comparing converting and non-converting paths requires enough of both, and below a certain conversion count the model either falls back to something simpler or produces unstable output that swings between months.
It is not transparent. You cannot inspect why a touchpoint received 31% rather than 12%, which matters when somebody senior asks you to defend a budget cut. "The model said so" is not an answer that survives a finance meeting.
It is still correlational, and it is still run by the platform that benefits from the answer. A data-driven model inside Google Ads still only sees Google's touchpoints and still cannot credit a TikTok video it never observed. Sophistication inside a walled garden does not fix the walls.
The comparison, in one table
| Model | Credit rule | Direction it distorts | What it needs |
|---|---|---|---|
| First touch | 100% to the earliest touch | Over-credits awareness, blanks closers | Path data, long window |
| Last touch | 100% to the final touch | Over-credits brand search, retargeting, email | Nothing beyond a conversion tag |
| Linear | Equal share to every touch | Rewards frequency over influence | Complete path data |
| Time decay | Weight rises near the conversion | Leans to closers; result depends on half-life | Path data plus timestamps |
| Position based | 40 / 20 / 40 across the path | Punishes mid-funnel by assumption | Path data; the split is a choice, not a finding |
| Data driven | Modelled contribution per touch | Opaque; limited to what the platform observes | High conversion volume, one platform's view |
A worked example, so the size of the difference is concrete
Take one path. These are illustrative touches, not measured data, and the point is the arithmetic rather than the specific channels.
- Day 0: generic search ad on Google
- Day 3: Instagram video ad
- Day 9: TikTok ad
- Day 12: branded search ad, then purchase
Ask a single question of each model: what share of the sale does the first touch — that day-0 generic search ad — receive?
First touch gives it 100%. Last touch gives it 0%. Linear gives it 25%, one of four equal shares. Position based gives it 40%, by rule.
Time decay takes a moment. With the common 7-day half-life, each touch is weighted by 0.5 raised to the power of (days before conversion divided by 7). The day-0 touch is 12 days out, so its weight is 0.5^(12/7) = 0.305. Day 3 is 9 days out: 0.410. Day 9 is 3 days out: 0.743. Day 12 is the conversion day: 1.000. Those sum to 2.458, so the first touch's share is 0.305 ÷ 2.458 = 12.4%, and the branded search at the end takes 40.7%.
So the same purchase, the same four ads, and the credit given to the ad that started everything ranges from 0% to 100% depending on a dropdown. Data-driven is absent from that list on purpose: its answer depends on your account's own converting and non-converting paths, so it cannot be computed from the path alone.
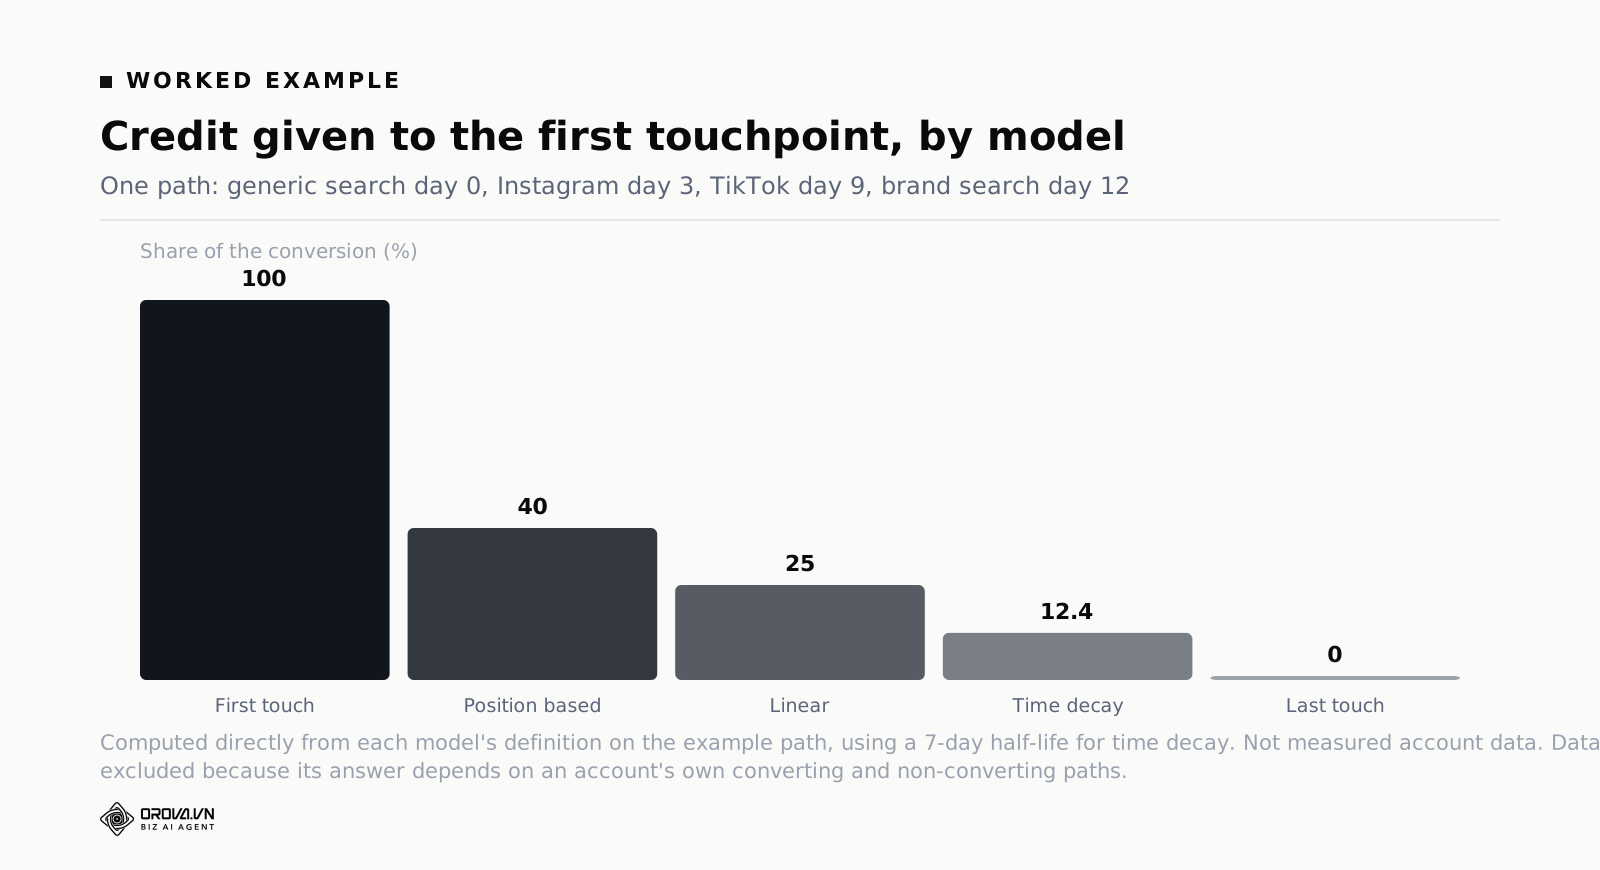
The practical lesson is not "pick the model in the middle". It is that any budget decision which flips when you change the dropdown is a decision the data does not actually support. Save your certainty for conclusions that survive all six models.
What Data Each Multi Touch Attribution Model Needs
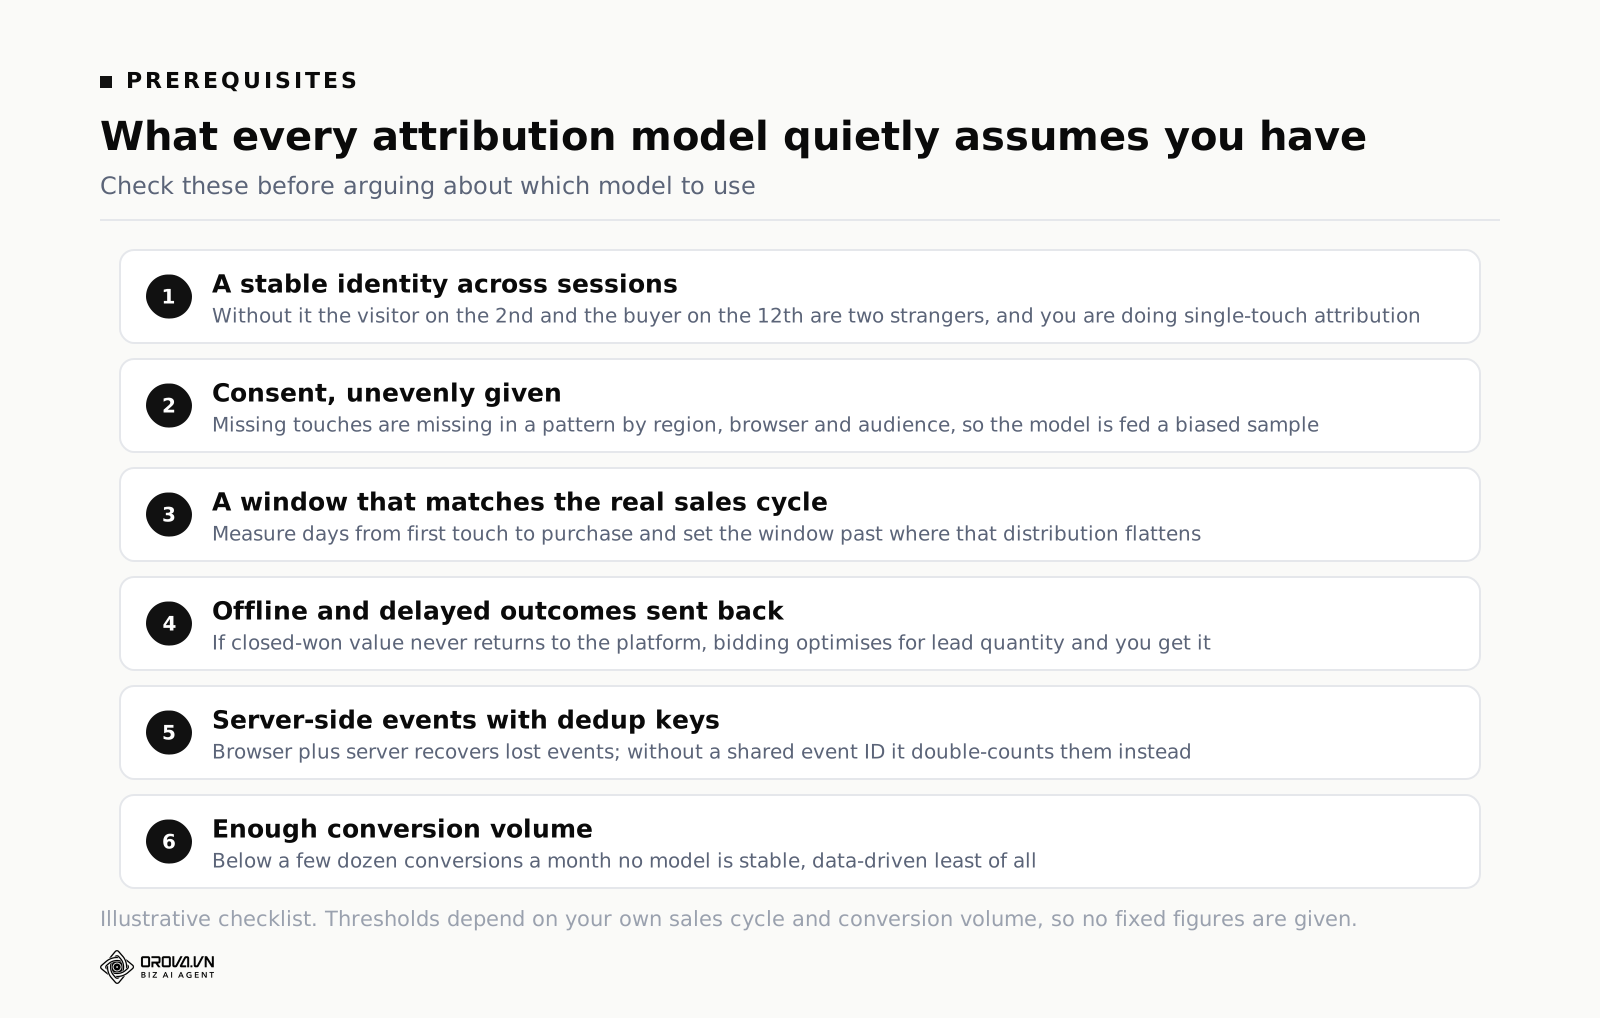
Every model above assumes inputs that most accounts do not fully have. Checking these first will save you from building a beautiful report on top of a broken path.
A stable identity across sessions. Paths only exist if you can tell that the visitor on the 2nd and the buyer on the 12th are the same person. Browser storage limits, private browsing and cross-device behaviour break this constantly. A logged-in account or a hashed email captured early is worth more to your attribution than any model upgrade.
Consent. Where consent is required and not given, the touch does not exist in your data. This is not evenly distributed: it varies by region, by browser and by audience, so the missing paths are missing in a patterned way rather than at random. Your model is being fed a biased sample before it does any arithmetic.
A window that matches your actual sales cycle. Measure it rather than guessing. Export converted paths, look at the distribution of days from first touch to purchase, and set the window past the point where the tail flattens. If 90% of purchases happen within 21 days and your window is 7, you have decided by accident to hide a third of your marketing.
Offline and delayed conversions, sent back. For anything with a sales team, the event that matters is the closed deal, not the form fill. If closed-won value never returns to the platform, every model is optimising toward lead quantity and you will get exactly that.
Server-side events with deduplication keys. Browser-only tracking loses events. Server events recover some. Both together, without a shared event ID, double-count. The key is not optional.
Enough conversion volume. Below a few dozen conversions a month, no model is stable, data-driven least of all. Small accounts should be spending their measurement effort on clean conversion definitions and blended numbers, not on model selection.
Why Platform-Reported Attribution Is Self-Serving
Not dishonest. Self-serving, structurally, in ways that would apply to any company in the same position.
An ad platform is the only witness to its own contribution, the referee of its own performance, and the party paid according to that performance. Every default it sets resolves in the direction of more credit to itself, and each default is individually reasonable.
Counting view-through conversions is defensible — video does influence people who never click. It also means the platform decides that showing an ad to someone who was already buying counts as a contribution.
Modelling unobserved conversions is defensible — the data really is missing. It also means a portion of reported performance is an estimate produced by the interested party, with no way for you to audit it.
Attributing on the click date rather than the purchase date is defensible — it is how you evaluate a click. It also means your channel report and your finance report describe different months.
Optimising toward the conversion event you configured is defensible — you configured it. It also means that if you send "purchase" including tax, shipping and eventually-refunded orders, the bidding system will happily buy more of exactly that.
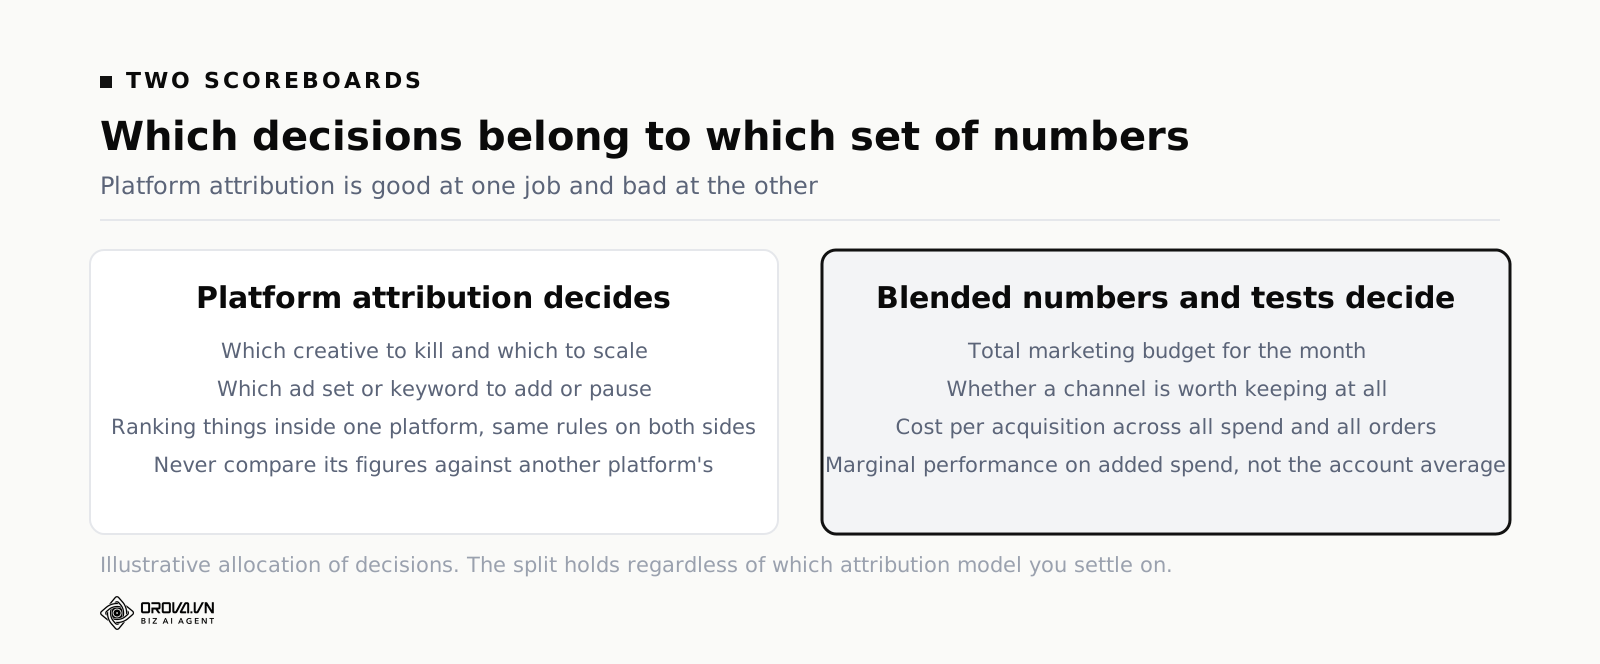
None of this makes platform numbers useless. It makes them the wrong tool for one specific job. Platform attribution is good at ranking things inside the platform: this ad set against that ad set, this creative against that creative, same rules on both sides. It is bad at answering how much to spend in total, and worse at comparing one platform against another, because the two are keeping score by different rules. Building a view that spans channels is a separate exercise with its own pitfalls, which we cover in combining SEO and ads in one report.
The rule that follows: never let a cross-platform budget decision rest on numbers each platform computed about itself.
Incrementality Testing: The Honest Check
Attribution asks which ads were present before the sale. Incrementality asks a better question: how many of those sales would have happened anyway. The only way to answer it is to withhold advertising from a comparable group and measure the difference.
This is the check that keeps your models honest, and it is the reason attribution should never be your last word.
Geo holdout
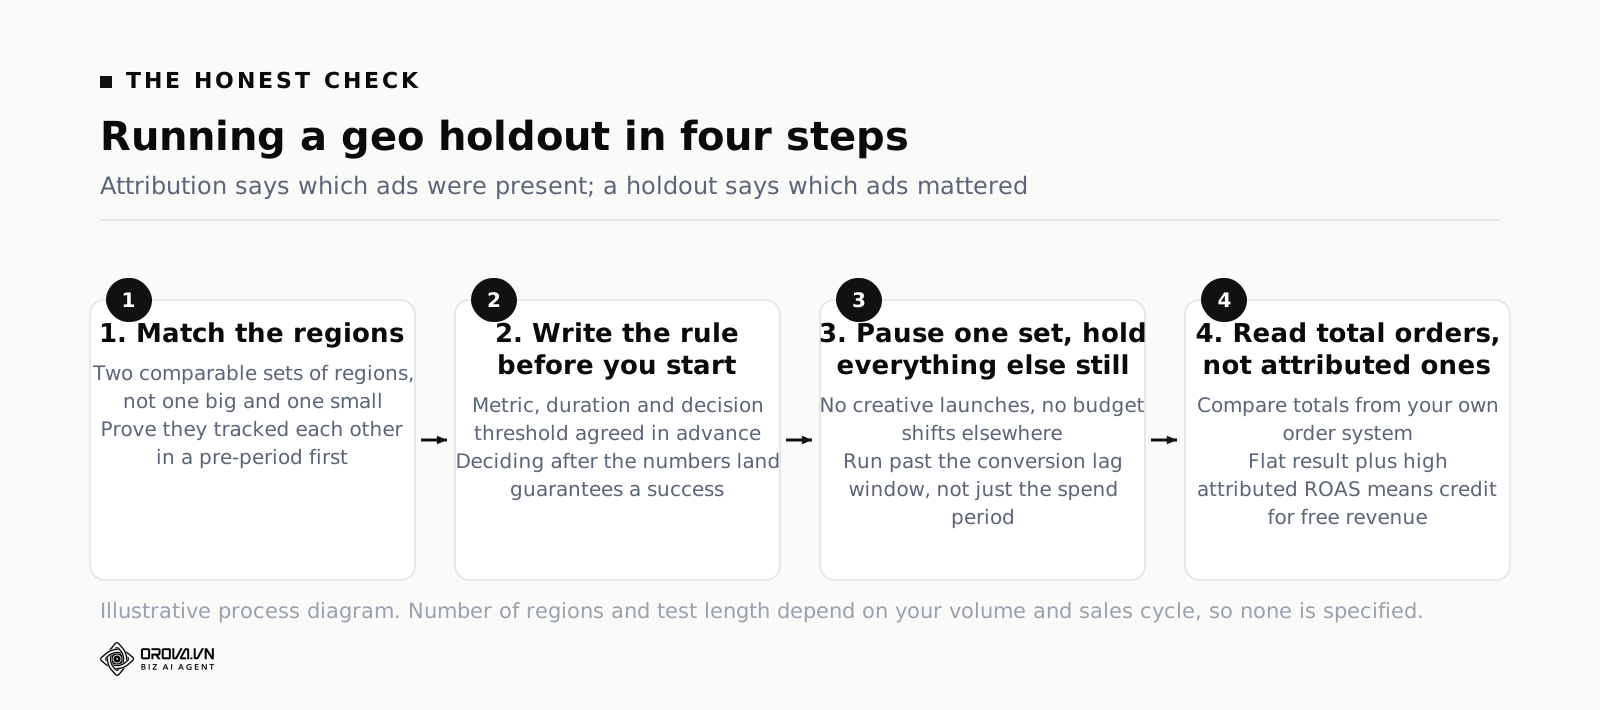
Split regions into two comparable sets, keep spending in one, stop in the other, and compare total sales — not attributed sales, total, from your own order system. If the paused regions barely move, the channel was harvesting demand it did not create. Geo tests are the most robust option for most businesses because they need no user-level tracking at all and are immune to every identity problem above.
They need scale and patience: enough regions to build balanced groups, enough weeks to clear the conversion lag, and a matched pre-period to prove the two groups tracked each other before you intervened.
Conversion lift studies
Most large platforms offer a built-in randomised holdout, where a portion of your target audience is deliberately not shown the ads. This is a genuine experiment and it is far better evidence than any attribution report. The caveat is that the platform still runs and reports it, and eligibility usually requires meaningful spend.
Budget-step tests
The cheap version. Move one channel's budget up or down by a large, deliberate amount — small changes vanish into noise — hold everything else steady, wait past your lag window, and look at total orders and blended cost per acquisition. It is not a controlled experiment, seasonality can fool you, and it is still worth more than an argument about models.
Reading the result without lying to yourself
Decide the metric, the duration and the decision rule before you start, and write them down. Waiting until the numbers arrive to decide what counts as success guarantees you will find success. Expect wide error bars, especially at low volume. And accept the uncomfortable outcome when it comes: a channel with a spectacular attributed ROAS and a flat incrementality result is a channel taking credit for revenue you were getting free.
A Practical Rule for Small Teams That Cannot Run Holdouts
Most teams cannot run a clean geo test. Too few regions, too little volume, not enough weeks in the quarter to sit still. Here is the rule that works anyway, and it is deliberately boring.
One source of truth for the total. Your order system or CRM decides how many sales happened and what they were worth. Not the platforms, ever. Every report starts from that number, and if a channel report disagrees, the channel report is the one that is wrong about the total.
Blended cost per acquisition, watched weekly. Take all marketing spend across every channel, divide by total orders from your source of truth. No attribution required, no model, no window. This one number is immune to every problem in this article, because it never asks which ad deserves credit. If blended cost per acquisition is stable while a platform reports a triumph, the triumph is reallocation, not growth.
Platform numbers for inside-platform decisions only. Which creative to kill, which ad set to scale, which keyword to add — use the platform's own report, and never compare its figures against another platform's.
Judge new spend at the margin. When you increase a budget, ignore the account average. Look at the extra orders divided by the extra spend. Marginal performance is what actually degrades as you scale, and account averages hide it for months.
Ask the buyer. An optional "how did you hear about us" field at checkout is unscientific, biased toward memorable channels, and still catches things no pixel will ever see — the podcast, the friend, the physical sign. Treat it as a hint, not a measurement, and it will occasionally save you from cutting something that works.
Pick one model and stop rearranging it. Choose a model that fits your path shape, write down why in one sentence, and leave it alone for at least a quarter. Consistency over time is worth more than accuracy at a point in time, because you make decisions from trends, not from levels. Whichever model you keep, make sure the small set of numbers you actually steer by is agreed in advance — the argument for that is laid out in ad Performance Metrics That Actually Matter.
Five Mistakes That Make Attribution Lie
Adding up conversions from different platforms
The mistake that produced 921 orders out of 604. Each platform counts its own version of the same event under its own rules, so the sum is not a total of anything. If you need a single number, take it from your order system and use attribution only to split it, not to build it.
Changing the model mid-period
Switching models rewrites history. Every channel's past performance moves, trends break, and any comparison spanning the change is meaningless. If you must switch, recompute at least three prior months under the new model before you show anyone a trend line, and label the change on the chart.
Treating data-driven as truth rather than as a better guess
Data-driven attribution is the strongest option in most accounts and it is still a model, still limited to one platform's field of view, still unable to see the channel it does not run. Use it. Do not quote it as fact in a room where somebody is about to cut a budget.
Ignoring conversion lag when comparing periods
Comparing an unsettled recent week against a fully-matured earlier one is the single most common way to invent a crisis. Either compare like-aged periods, or exclude the last several days entirely, and be consistent about which.
Letting attribution set the total budget
Attribution divides a pie. It has nothing useful to say about how big the pie should be, because it cannot see what would have happened without you. Total budget is an incrementality question and a blended-margin question. Every time an attributed ROAS is used to justify spending more overall, someone is using a ruler to weigh something.
A Monthly Attribution Review You Can Repeat
An hour a month, in this order.
| Step | What you check | What it tells you |
|---|---|---|
| 1 | Total orders and revenue from the order system | The only number that is not up for debate |
| 2 | Sum of platform-reported conversions against that total | The size of your overlap, tracked over time |
| 3 | Blended cost per acquisition, all spend over all orders | Whether the business is getting cheaper or dearer to grow |
| 4 | Same period under first touch and last touch | Which channels open and which channels close |
| 5 | Path length and days-to-conversion distribution | Whether your window is still the right length |
| 6 | One incrementality read: a live test, or the last budget step | Whether any channel is taking credit for free revenue |
| 7 | Tracking health: consent rate, event match quality, dedup errors | Whether the paths feeding the models are degrading |
Step 2 matters more than it looks. The gap between the platform sum and your real total is itself a metric. When it widens sharply, something changed — a new retargeting campaign inflating view-through, a tracking break, a window edited by someone who did not mention it.
Where Manual Work Ends and Tooling Starts
Everything above can be run from a spreadsheet, and for one or two channels under a modest budget you should do exactly that. The manual approach fails at a predictable point: when the exports needed to answer one question exceed the time you have to reconcile them, and the monthly review quietly becomes quarterly, then annual.
Three things get hard by hand. Pulling daily numbers from several ad platforms plus analytics plus your own order system into one place with matching date ranges. Keeping one definition of a conversion when every source ships its own default. And getting real outcomes — the closed deal, the refunded order — back out of your CRM and into the same view, rather than living in a system nobody opens.
That last one is where a reporting layer earns its keep. Orova Insight connects 16 kinds of source, from GA4 and Search Console to Google, Meta and TikTok ads, Fanpage, Instagram, Threads and Google Sheets, and any system it does not support natively — a CRM, an accounting tool, something built in-house — can post JSON to its own webhook and becomes a normal drag-and-drop source alongside the rest. Figures sync daily into one store, so the comparison in step 2 above stops being an export job. Custom metrics defined by formula let you hold blended cost per acquisition as a first-class number rather than recomputing it by hand, across 31 chart types and 11 kinds of filter control on a multi-page canvas, with ten recoverable versions when someone rearranges a report they should not have. Its AI Analyst answers questions in plain language and builds charts from the real figures, and reads only the sources you have explicitly enabled for AI — a restriction worth having, because a tool that silently reaches into every connected system is a tool you cannot hand to a client. Reports can be shared by link, by workspace, per person, publicly, embedded, exported to PDF, or scheduled to send themselves.
Whatever you use, the sequence does not change. Fix the identity and the window, agree one source of truth for the total, choose a model and leave it alone, and test incrementality when you can. Automating a broken definition just produces wrong decisions faster, and with better charts.
Frequently Asked Questions
Which attribution model should I use?
If your paths are short and mostly direct-response, last touch is defensible and cheap. If they are long and multi-channel, position based or time decay will treat your upper funnel less brutally. If you have high conversion volume in one platform, use its data-driven model for decisions inside that platform. Then, regardless of the choice, judge total budget on blended numbers and incrementality instead.
Is data driven attribution better than the others?
Usually yes, with conditions. It adapts to your account rather than applying someone else's rule, and Google has made it the default in Google Ads and the primary model left in GA4. But it needs volume to be stable, it cannot be inspected or explained, and it only sees the touchpoints belonging to the platform that runs it. Better model, same walls.
Why do Google and Meta both claim the same conversion?
Because neither can see the other. Each runs attribution on its own observed touchpoints, using its own window and its own view-through rules, and each credits itself. There is no shared ledger between platforms, so overlap is guaranteed rather than exceptional. Reconcile against your order system and treat the gap as a number you track.
How long should my attribution window be?
Measure it instead of copying a default. Export converted paths, plot days from first touch to purchase, and set the window beyond the point where that distribution flattens out. A window shorter than your real sales cycle does not reduce noise; it deletes early touches and hands their credit to whichever channel came last.
Do I need a dedicated attribution tool?
Not at the start. A source of truth for orders, a blended cost per acquisition, and a first-touch-versus-last-touch comparison will out-perform a badly configured tool. Consider one when you are running three or more paid channels, have paths long enough that single-touch is clearly wrong, and have someone whose job includes maintaining the tracking that feeds it.
Has privacy killed multi touch attribution?
It has demoted it. Consent requirements, App Tracking Transparency and shorter browser storage lifetimes all break the user-level paths that these models are built on, so the paths you can see are both fewer and unrepresentative. Models still help you understand channel roles. They are no longer credible as a precise ledger, which is why incrementality and blended measurement have moved to the centre.
What to Do This Week
Four tasks, in order, none of which needs new software.
One. Put three numbers on one line for last month: total orders from your order system, the sum of conversions reported by every ad platform, and the difference. That difference is your overlap. Write it down somewhere you will see it again next month.
Two. Compute blended cost per acquisition for the last six months — all marketing spend divided by all orders — and plot it. If it has been climbing while your platform reports have been improving, you have found the story your attribution was hiding.
Three. Run the same period under first touch and last touch, and label each channel an opener or a closer. Take that one-page list to whoever is about to cut a budget.
Four. Check your window against your real days-to-conversion distribution, and fix it if it is short. Then pick your model, write one sentence explaining the choice, and do not touch it again until the quarter ends.
None of that produces a perfect number, because there is not one. It produces something more useful: a set of decisions that stay correct no matter which model the report is set to.
Stop Rebuilding This Slide Every Quarter By Hand
Working this out by hand means pulling exports from every ad platform, matching them against your order system, deciding on a model, redoing the math when someone questions it, and repeating the whole thing next quarter. That is hours of spreadsheet work for a number that expires the moment your ad mix changes.
Orova Insight is built to take that recurring work off your plate, pulling the pieces together and keeping the calculations consistent quarter over quarter so you are not rebuilding the same slide from scratch every time. If that sounds useful, feel free to take a look and see if it fits how your team already works.
See every channel on one baseline
Orova Insight brings ad platforms and analytics into one report so you can compare channels on the same terms.
Start for free