
Recruiting Metrics That Matter: Four Numbers That Change Decisions
The Monday hiring review has a slide. It says 240 applications, 18 interviews, an average time to hire of 41 days, and a green arrow next to something labelled "pipeline health". Everyone nods. Nobody changes anything. Two weeks later the same role is still open, the same slide appears with slightly different numbers, and the same nodding happens. That is the normal state of recruiting metrics in most companies: reported carefully, acted on never.
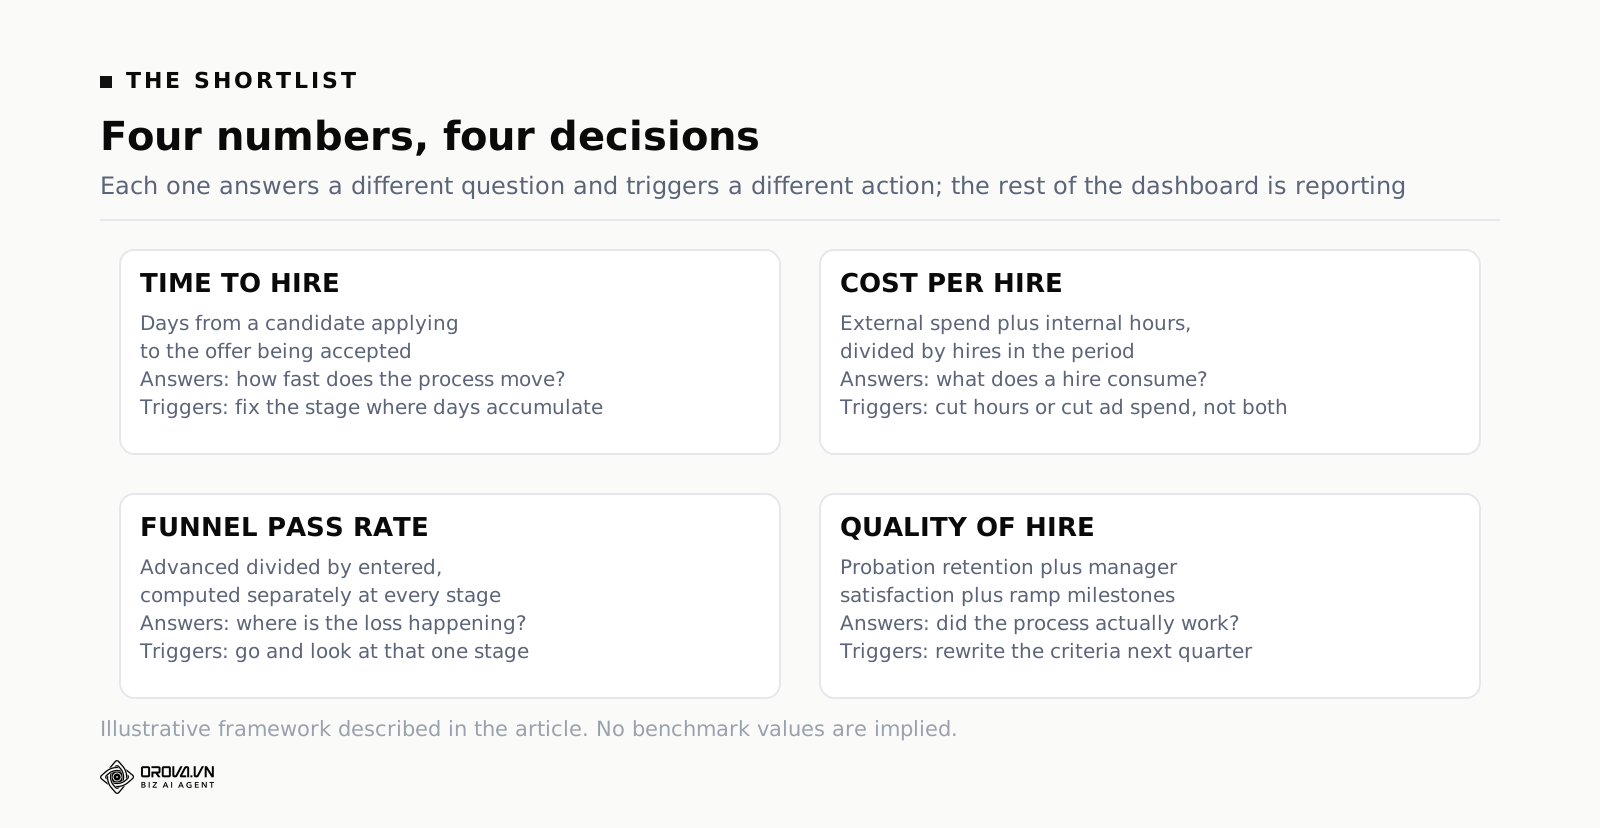
Here is the short version. Only four numbers reliably change what you do next week: time to hire, cost per hire, the pass rate at each stage of your funnel, and quality of hire. Everything else on that slide is decoration. A metric earns its place only if you can name, in advance, the specific action a bad reading triggers — and then actually take it.
This article goes through those four one at a time. For each, you get the formula written out, what a movement in it genuinely means, the trap hiding inside it, and the action it should trigger. Then a worked example that carries one open role through the whole funnel with numbers attached, a diagnostic table that maps a symptom to the likely bottleneck, an honest section on why "number of applications received" is the most misleading figure in the whole set, and a note on the thing that quietly determines whether any of your pass rates are comparable at all: whether candidates were scored the same way by the same standard.
Which recruiting metrics actually matter?
Four recruiting metrics change decisions: time to hire, cost per hire, funnel pass rate at each stage, and quality of hire. Everything else is reporting. Track a metric only if you can name the action a bad reading triggers this week. If no action exists, stop measuring it.
The test for whether a number belongs on your dashboard is simple and brutal. Finish this sentence: "If this number gets worse, I will ______ ." If you cannot fill the blank with something concrete — rewrite the ad, cut a stage, move the threshold, call the hiring manager — the number is not a metric. It is a fact. Facts are fine, but they belong in a file, not in a weekly meeting where five people are spending an hour each.
Most recruiting dashboards fail this test on almost every row. Source of applications, gender split of applicants, average candidate age, number of open requisitions, offer decline reasons collected from a dropdown that recruiters pick at random — these get reported because the software produces them, not because anyone decided they were worth producing. Meanwhile the two numbers that would tell you where the process is jammed, pass rate by stage and time to first interview, are frequently not tracked at all, because they require someone to define what a stage is and write down when candidates crossed it.
The four below are the ones that survive the test. They are not the only defensible set, and larger teams add more. But if you are a small company, or one recruiter carrying eight roles, or a founder doing this between everything else, these four cover almost every decision you will actually face.
One structural point before the detail. These four are not independent, and treating them as separate scorecards is how teams end up optimising one into the ground. Cut time to hire by skipping the second interview and quality of hire pays for it four months later. Cut cost per hire by dropping the paid job ad and time to hire stretches by three weeks. Push pass rates up by loosening the criteria and you have not improved anything, you have just moved the rejection later in the process where it costs more. Read them together or do not read them at all.
Time to hire, and the number that beats it
Start with the definition, because half the arguments about this metric are actually arguments about what is being counted.
Time to hire = the number of days from the moment a candidate enters your pipeline to the moment that candidate accepts the offer. It is measured per hire, then averaged.
Time to fill = the number of days from the moment the role was approved to the moment an offer is accepted (some teams end it at the start date instead). It is measured per role.
These get used interchangeably and they answer different questions. Time to hire measures how fast your process moves a person through it. Time to fill measures how long the business waits for a body in the seat, including the two weeks the job description sat in someone's drafts and the eleven days you spent waiting for headcount sign-off. If a hiring manager complains that hiring is slow, they mean time to fill. If you are trying to fix your own process, time to hire is the number you can move.
The number that is more useful than either: time to first interview
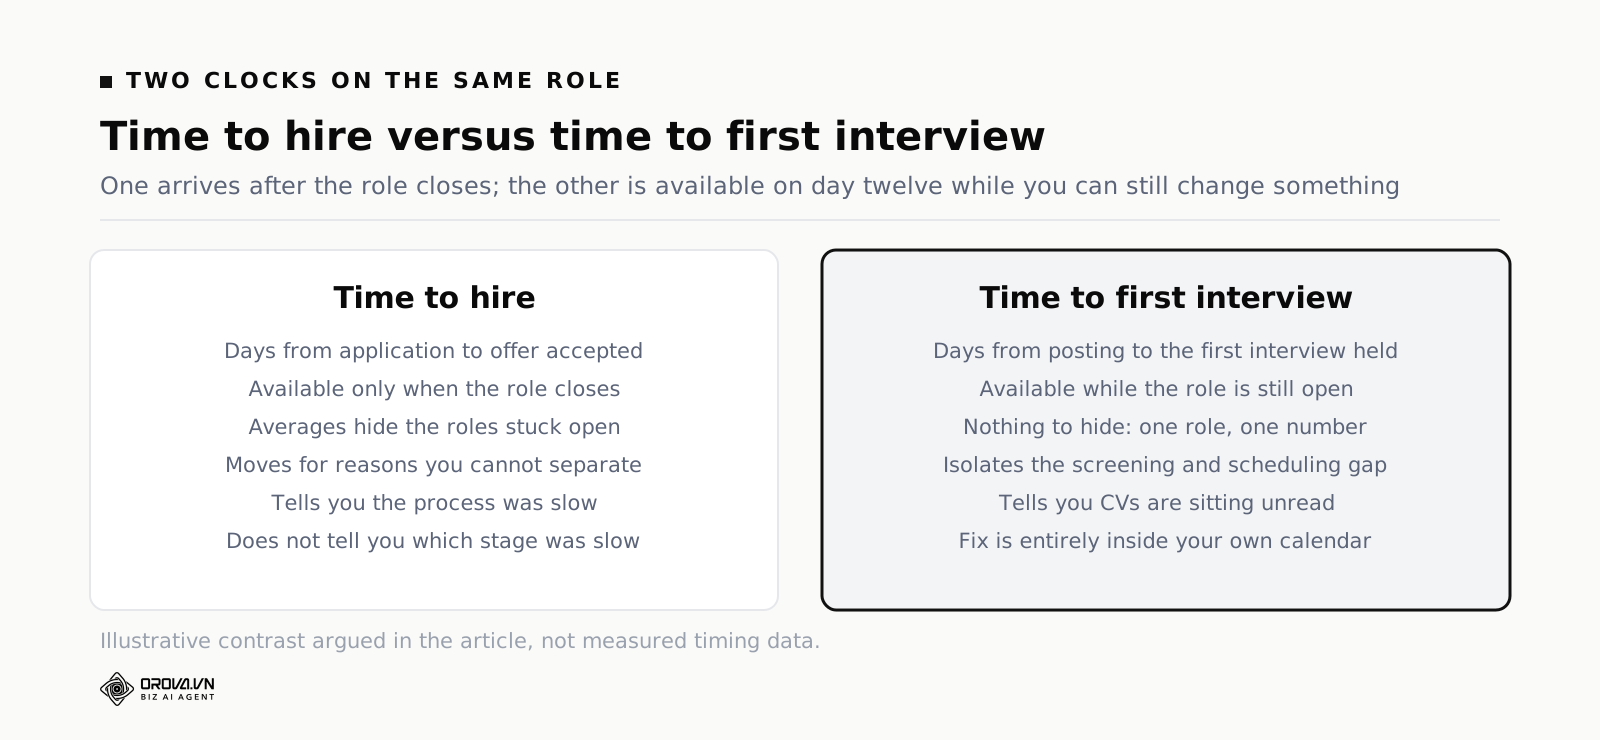
Here is the one that will change your week. Time to first interview = days from the role going live to the first qualified candidate sitting in a first interview.
Time to hire is a lagging measure. You learn it once the role closes, which is precisely when you can no longer do anything about it. Time to first interview is available on day twelve of an open role, and it isolates the single stage that most often causes the delay: the gap between CVs arriving and someone reading them properly.
In most small teams, that gap is where the days go. Applications arrive from day one. The CV pile grows for a week because nobody has a free afternoon. Then someone reads forty of them in one sitting, picks six, and starts the scheduling dance. By the time the first interview happens, two of the six have taken other offers. Nothing about that is an interview problem, a sourcing problem, or an employer brand problem, but the dashboard will call it "long time to hire" and the meeting will discuss job boards for twenty minutes.
What a change in it means
Time to hire rising usually means one of three things, and you can tell them apart by looking at where the days accumulated. Either the screening stage got slower (CVs piling up), the scheduling stage got slower (calendar congestion, hiring manager unavailable), or the decision stage got slower (interviews finished but nobody committed). The third is the most common in companies with more than one decision maker, and the least visible, because the candidate is technically "in process" the whole time.
Time to hire falling is not automatically good news. It falls when you get lucky with a strong early applicant, and it falls when you drop a stage. If it falls at the same time as your offer acceptance rate, you probably got faster. If it falls while quality of hire proxies fall, you cut a stage that was doing work.
The trap
The trap in time to hire is survivorship. You only measure it on roles that closed. The requisition that has been open for four months and has not produced a single offer contributes nothing to your average, which is exactly backwards — the disaster is invisible and the easy hires drag the number down. A team with a 32-day average time to hire and three roles stuck open for a quarter looks better on paper than a team with a 45-day average and nothing stuck.
Fix it by reporting time to hire alongside a second figure: the age of your oldest open role, and the count of roles open more than sixty days. Two numbers, no averaging, no hiding.
The action it should trigger
If time to first interview is over about two weeks, the action is not "post to more job boards". The action is to move CV screening from a task someone gets to, into a fixed slot that happens whether or not the pile is full. Every second morning, one hour, all new applications read and dispositioned. That single change moves time to first interview more than any sourcing decision you will make.
If time to hire is long but time to first interview is short, the problem is downstream. Look at the calendar gaps between stages. The fix there is usually structural: pre-book interview slots with the hiring manager for the whole month before the role goes live, and hold them empty rather than trying to find time reactively.
Cost per hire, and the formula most people quietly fudge
The formula everyone quotes is simple:
Cost per hire = (external costs + internal costs) ÷ number of hires in the period.
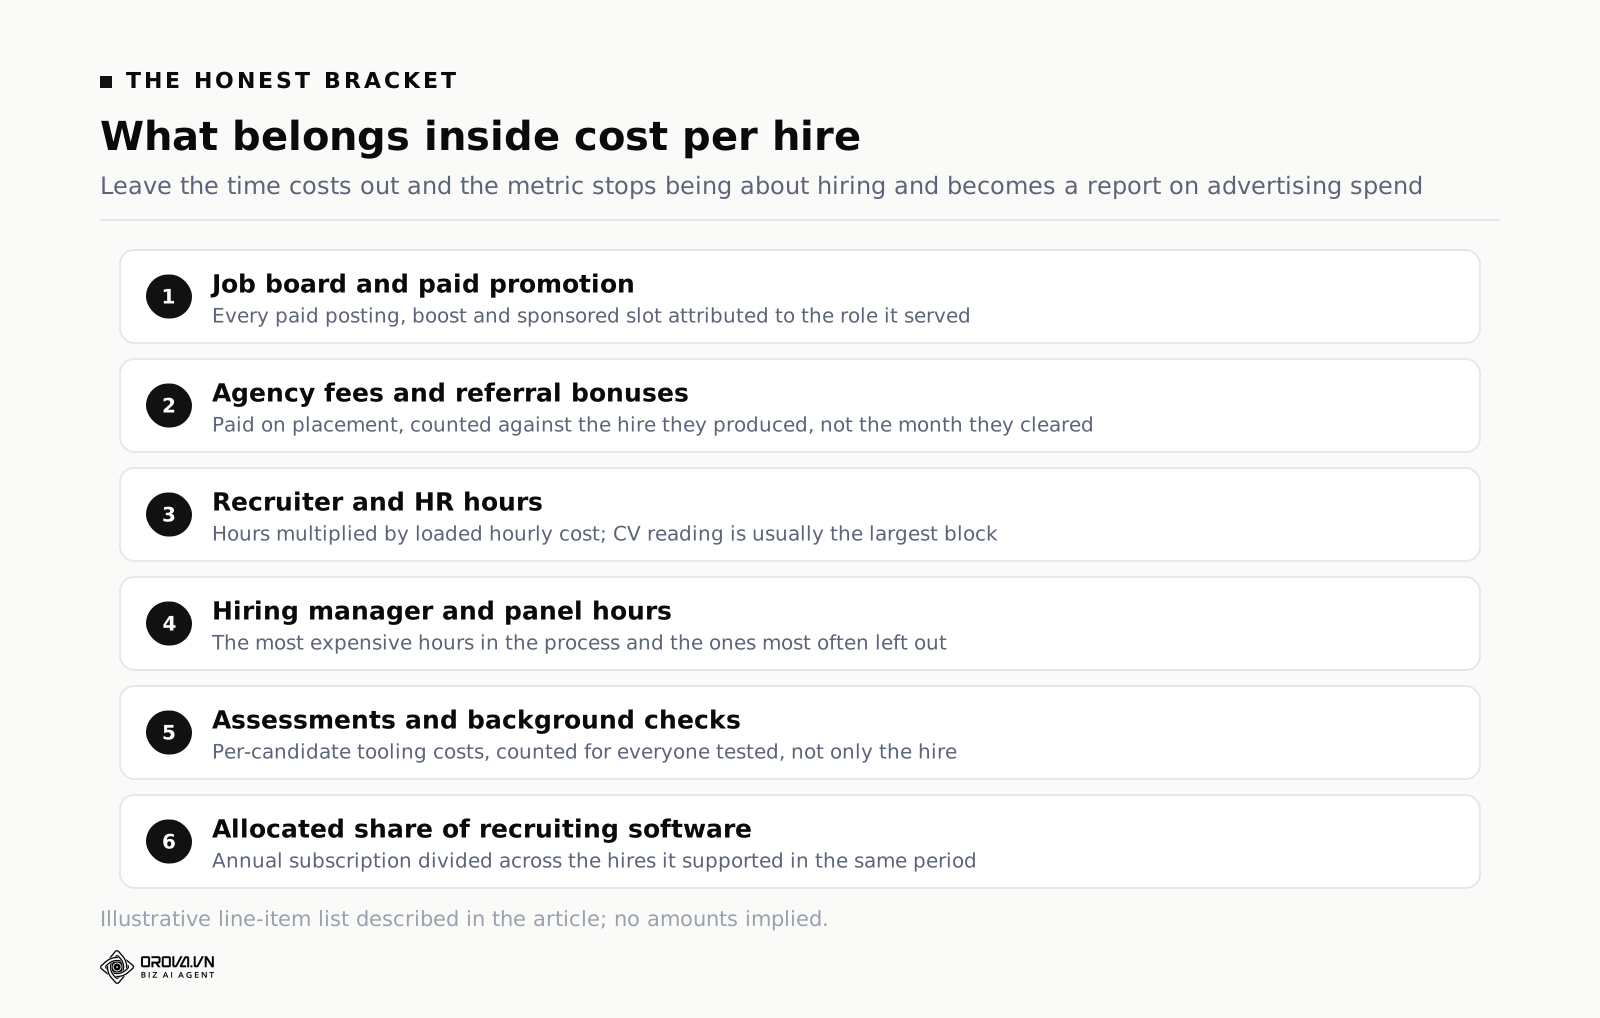
The argument is entirely about what goes inside those two brackets. Most published cost-per-hire figures are low because they count only external costs — the job board spend and the agency fee — and silently drop the largest line item, which is people's time. If you want the number to be useful rather than flattering, it has to include the hours.
External costs are the easy half: job board postings and paid promotion, agency or recruiter fees, referral bonuses paid out, assessment tools bought per candidate, background check fees, travel or venue costs for interviews, career fair and event costs allocated to the roles they served.
Internal costs are where honesty lives: recruiter or HR time (hours × loaded hourly cost), hiring manager and interview panel time (usually the most expensive hours in the whole process), the allocated share of any recruiting software subscription, and time spent by whoever writes and approves the job description.
What a change in it means
Cost per hire rising is not inherently bad, and this is where most reporting goes wrong. It rises when you hire a harder role, when the market for that skill tightens, when you replace an agency with an internal process that takes more of your own hours, and when you add an interview stage that catches mistakes. Only the first three are worth investigating; the fourth might be the best money you spent all quarter.
The version worth watching is not the absolute figure but the split. If cost per hire is rising because external spend is rising, you are buying attention. If it is rising because internal hours are rising, you are paying with your own team's calendar, which is the more expensive currency and the one that never shows up in a budget line.
The trap
Two traps sit inside cost per hire. The first is denominators: dividing by hires in a period rather than by hires that came from the spend in that period. If you spend heavily in March and the hires land in May, March looks catastrophic and May looks free. On low volume this makes the metric meaningless month to month. Report it per role, or per quarter, never per month if you make fewer than about ten hires a month.
The second trap is that cost per hire says nothing at all about what the hire was worth. A cheap hire who leaves in three months is not cheap, it is the most expensive outcome available, because you pay the whole cost twice and lose the output in between. Cost per hire is only interpretable next to a quality signal. On its own it rewards exactly the behaviour that damages you: fewer stages, faster decisions, less careful reading.
The action it should trigger
If external spend dominates, the action is to look at where your good candidates actually came from — not where the most applications came from, which is a different question and covered further down. Cut the channel that produces volume without shortlist-quality candidates, and move that budget to the one that produces the shortlist.
If internal hours dominate, the action is to look at which stage consumes them. In small teams the answer is almost always CV reading, because it scales linearly with applications and cannot be scheduled away. That is the stage where recruitment automation pays back first, and it is also the stage where automating the decision rather than the reading gets teams in trouble.
Funnel pass rates: the metric that tells you where the loss is
This is the one most teams skip and the one that does the most diagnostic work.
Pass rate at a stage = candidates who advanced out of that stage ÷ candidates who entered it.
You need one per stage, not one for the whole funnel. A single overall conversion rate from application to hire tells you nothing you can use — it is a product of six separate numbers, and knowing the product does not tell you which factor moved.
A typical set of stages, each of which needs its own pass rate: application received to readable and complete file; CV screen to shortlist; shortlist invited to phone screen actually held; phone screen to hiring manager interview; manager interview to final stage; final stage to offer made; offer made to offer accepted.
Notice that two of those are not quality filters at all. "Invited to screen actually held" and "offer made to accepted" measure whether candidates want to continue with you. Those are the rates that tell you about your employer brand, your response speed, and your salary band, and they are the two that teams most often lump into a single "drop-off" bucket where the cause is unrecoverable.
What a change in it means
Each stage has a characteristic story when its pass rate moves.
- CV screen pass rate very low (say, under a tenth of applicants): either the ad is attracting the wrong people, or your criteria are stricter than the market can supply. Both are real; they need different fixes.
- CV screen pass rate very high (say, over a third): your criteria are not filtering. You are pushing the rejection down into interviews, which is the expensive place to do it.
- Phone screen pass rate low: the CV screen is letting through people whose claims do not survive one follow-up question. This is a criteria problem, not a phone problem.
- Manager interview pass rate low: you and the hiring manager do not agree on what the role needs. This is the single most common cause of a slow, expensive hiring process, and it is a conversation, not a metric.
- Offer acceptance rate low: salary band, speed, or the experience candidates had during the process. Ask the people who declined; two of them will tell you.
The trap
Pass rates are only comparable when the standard behind them is stable. If one round of a role was screened by you in a focused morning and the next round was screened by a colleague on a Friday afternoon, the two pass rates are not measuring the same thing and the difference between them is noise. This is important enough that it gets its own section further down.
The second trap is small numbers. With nine candidates at a stage, one person's decision moves the pass rate by eleven points. Do not react to a stage with fewer than about twenty candidates through it; look at the direction across several rounds instead.
The action it should trigger
Pass rates do not tell you to do a thing directly. They tell you which stage to go and look at. That is their whole job, and it is enough — most hiring problems are not solved by knowing a number, they are solved by knowing which of six possible problems you have.
Quality of hire, and the uncomfortable truth about it
Quality of hire is the metric that matters most and the one you cannot have when you need it. Everything above is about efficiency; this is the only one about whether the process worked. And it is measured months after the decisions that produced it.
There is no single agreed formula. The workable version is a composite scored per hire, then averaged across hires in a cohort:
Quality of hire = a blend of (still employed and confirmed at end of probation) + (hiring manager satisfaction at day 90) + (performance rating at first review) + (time to reach an agreed ramp milestone).
Weight those however your business needs, and be explicit about the weights. What matters far more than the weighting is that you define the components before the hire starts, not after, because after is when everyone remembers the outcome and reverse-engineers a justification.
The uncomfortable truth
Quality of hire for people you hire this month arrives in four to six months. Which means it cannot steer this month's decisions. Anyone selling you a real-time quality of hire dashboard is selling you a proxy with a confident label on it.
What quality of hire actually steers is your criteria, one cycle behind. You look back at the last eight hires, see which of your weighted criteria the good ones scored highly on and which ones turned out to predict nothing, and you rewrite the criteria for the next round. That is a quarterly loop, not a weekly one, and expecting it to behave like an operational metric is what makes teams give up on measuring it at all.
The proxies you can use meanwhile
Probation-period retention. The percentage of hires in a cohort who reach the end of probation, are confirmed, and are still there. This is the cheapest, hardest signal available. It is binary, it is unambiguous, and it arrives in three months rather than twelve. If it is low, something in your process is telling candidates something untrue — about the role, the hours, the manager, or the work.
Hiring manager satisfaction. Two questions, sent at day 30 and again at day 90. "Is this person doing the job you hired them for, on a scale of one to five?" and "Knowing what you know now, would you make the same hire?" That is the whole survey. Keep it two questions and people will answer it; make it ten and they will not.
Early ramp milestones. Agree with the hiring manager, before the role is posted, on one concrete thing the person should be doing unsupervised by day 60. Then check whether they are. This is more work than the other two, and it is the one that most reliably exposes a role that was never clearly defined.
Interview-to-performance consistency. For each hire, compare the score they got at screening with the day-90 manager rating. You are not looking for a correlation coefficient — the numbers are far too small for that. You are looking for the obvious cases: the candidate who screened brilliantly and is struggling, and the one who barely passed and is excellent. Both are worth an hour of thought about which criteria are doing real work.
The trap
Two of them. First, you only see the people you hired. You will never know how the candidates you rejected would have performed, which means quality of hire can only tell you about false positives, never about false negatives. A process that rejects excellent people and hires safe mediocre ones will produce a perfectly respectable quality of hire number. This is the single strongest argument for keeping a record of why each rejection happened, and for occasionally reviewing rejected candidates against what you later learned the role needed.
Second, hiring manager satisfaction measures the manager as much as the hire. A manager who onboards badly gets worse hires, permanently, and the metric will keep pointing at recruitment. If one manager's satisfaction scores are consistently below everyone else's across several hires, the finding is about them.
The action it should trigger
Low probation retention triggers a review of what candidates were told, in writing, at each stage — the ad, the screening call, the interviews — against what the job actually is. Low manager satisfaction with high screening scores triggers a criteria review: you are measuring the wrong things well. Both are quarterly actions. Neither is something you fix on Tuesday.
A worked example: one role, all the way through
Everything below is invented. These are not benchmarks, not averages, and not data from any company. They exist to show the arithmetic and to show how the four metrics interact on a single role. Your own numbers will look nothing like these, and that is fine — the point is the method, not the values. Currency is written as plain units; substitute yours.
The role: one Customer Support Specialist, office-based, posted on a job board plus the company careers page and one internal referral push.
The funnel
| Stage | Entered | Advanced | Pass rate |
|---|---|---|---|
| Applications received | 240 | 228 readable and complete | 95% |
| CV screen against criteria | 228 | 34 | 15% |
| Invited to phone screen, screen held | 34 | 22 | 65% |
| Phone screen passed | 22 | 11 | 50% |
| Hiring manager interview held | 11 | 9 | 82% |
| Manager interview passed | 9 | 4 | 44% |
| Final stage to offer | 4 | 2 | 50% |
| Offer accepted | 2 | 1 | 50% |
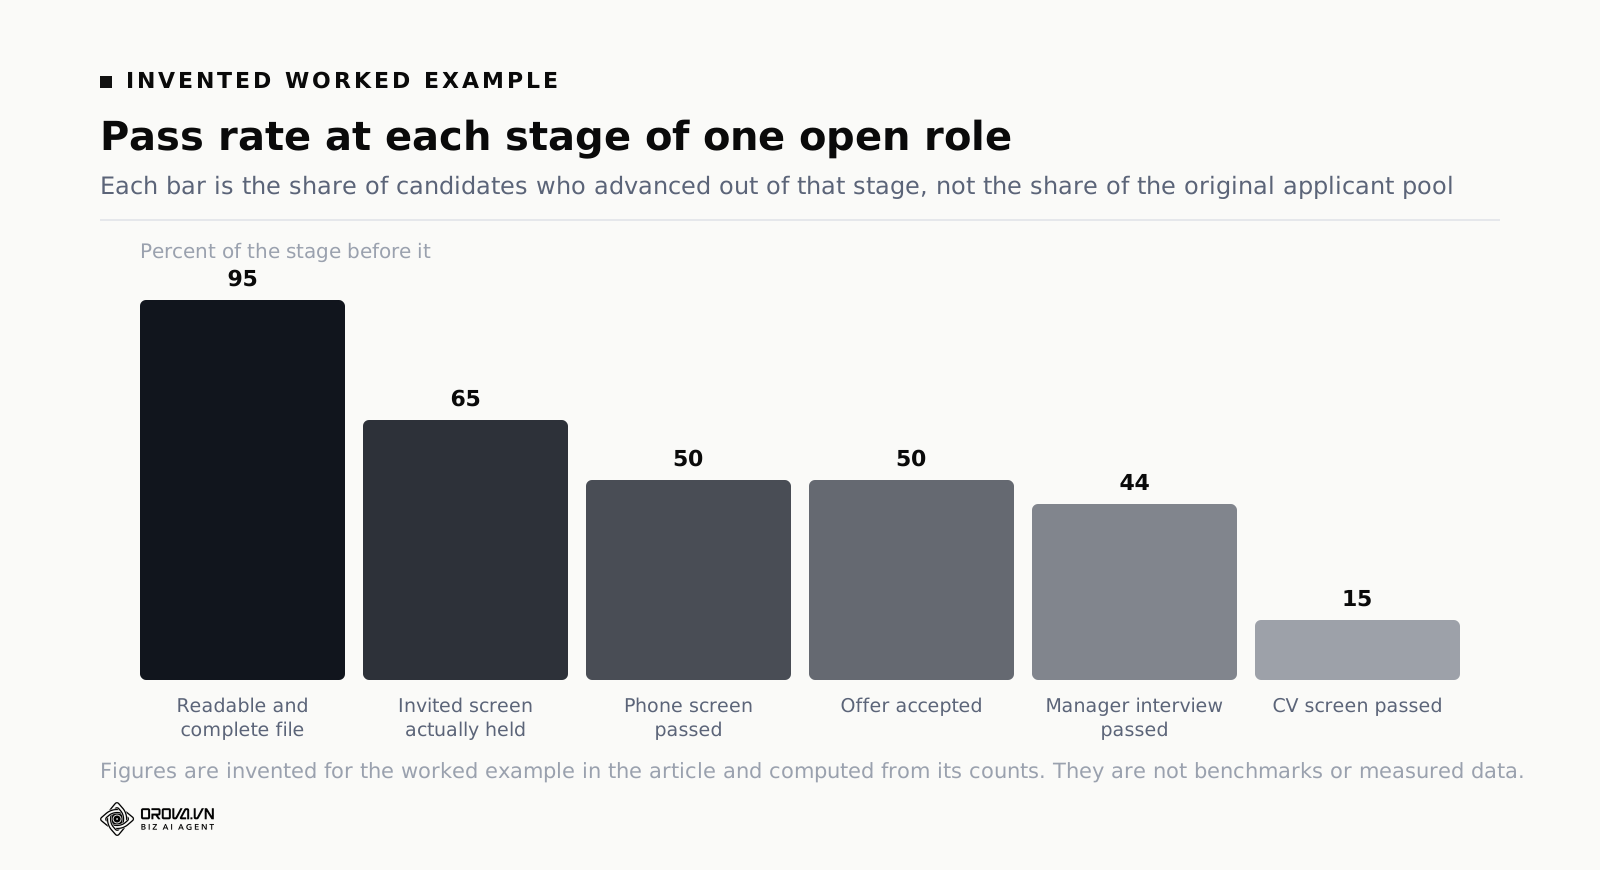
The clock
Day 0: headcount approved. Day 6: job description finalised and role posted — six days lost before a single candidate could apply, and those six days belong to time to fill, not time to hire. Day 13: first candidate sits in a phone screen, so time to first interview is 13 days from posting, 19 from approval. Day 24: first hiring manager interview. Day 38: first offer made, declined on day 40. Day 41: second offer made and accepted. Day 70: start date.
Time to hire for the accepted candidate, counted from their application on day 9 to acceptance on day 41, is 32 days. Time to fill, counted from approval to acceptance, is 41 days; counted to start date, 70 days. Three different defensible numbers for the same hire, which is exactly why you write the definition down once and never change it.
The cost
| Line item | Units |
|---|---|
| Job board posting and paid promotion | 1,200 |
| Referral bonus paid | 500 |
| Recruiter and HR time: 46 hours at 25 | 1,150 |
| Hiring manager and panel time: 19 hours at 40 | 760 |
| Background check and assessment | 90 |
| Allocated share of recruiting software | 120 |
| Total, one hire | 3,820 |
Cost per hire is 3,820 units. The interesting part is the split: 1,910 external and 1,910 internal, exactly half and half in this invented case. And inside the internal half, the 46 recruiter hours are dominated by one activity — reading 228 CVs. At a realistic three to four minutes each, that alone is somewhere between eleven and fifteen hours, which is roughly a third of all recruiter time spent on the role.
What the numbers tell you to do
Read together, this invented role has one obvious problem and one hidden one. The obvious one: 15% CV screen pass rate is fine, but 44% manager interview pass rate is not. More than half of the people who survived a phone screen failed at the manager stage, which says the phone screen and the manager are not applying the same standard. That is a conversation about criteria, not a process change.
The hidden one: six days between approval and posting, and thirteen more before the first interview. Nineteen days of a 70-day time to fill went by before a single candidate had been properly assessed. No amount of job board spend fixes that.
A diagnostic table: symptom to likely bottleneck
This is the table worth pinning above the desk. Find your symptom, check the likely cause before assuming the obvious one, and take the action.
| Symptom | Likely bottleneck | Check this first | Action |
|---|---|---|---|
| Time to first interview over two weeks | CV reading is unscheduled work | Days between application arriving and being dispositioned | Fixed screening slot every second morning, regardless of pile size |
| Long time to hire, short time to first interview | Calendar gaps between stages | Average days between each interview stage | Pre-book panel slots for the month before posting |
| CV screen pass rate under a tenth | Ad attracts wrong people, or criteria exceed market supply | Read ten rejected CVs: are they irrelevant or nearly-qualified? | Irrelevant means rewrite the ad; nearly-qualified means relax one criterion |
| CV screen pass rate over a third | Criteria are not discriminating | Whether must-have criteria are actually enforced as must-haves | Raise the threshold or add the criterion you have been assuming |
| Phone screen fails most shortlisted candidates | CV screen accepts unverified claims | Whether shortlist scores cite evidence from the file | Score against evidence, not against keywords appearing |
| Manager rejects most people you advance | You and the manager want different things | The weighted criteria list, jointly, in one sitting | Rewrite the criteria together and re-score five past candidates |
| Offers declined | Salary band, speed, or process experience | Ask the declining candidates directly, plainly | Fix the band or cut days out of the middle of the process |
| Good pass rates, poor probation retention | Process sells a role that does not match reality | What the ad and interviews promised versus the actual first month | Rewrite the ad and add one honest paragraph about the hard parts |
| Cost per hire rising with flat external spend | Internal hours are growing | Hours spent per stage, especially CV reading | Reduce reading hours before adding sourcing spend |
Why "applications received" is the most misleading number you track
Every recruiting dashboard leads with it, every job board sells against it, and it is almost pure noise.
The problem is that applications received measures the reach of your advertising and the ease of your application form, and nothing else. Both of those can be improved dramatically without improving your hiring at all. Turn on one-click apply and applications double. Post to three more aggregators and they double again. Loosen the title from "Senior" to nothing and watch them triple. None of that produced a single additional person worth interviewing.
Worse, high application volume actively damages the other metrics. Every additional application costs reading time, so internal cost per hire rises. The pile takes longer to work through, so time to first interview rises. And because human attention degrades across a long pile, the standard applied to CV number 180 differs from the standard applied to CV number 12, so your pass rates become less reliable at exactly the moment you have more data.
There is one legitimate use for the raw count: as a denominator. Applications received is the base for CV screen pass rate, and pass rate is the number that matters. A role that gets 40 applications and shortlists 8 is in dramatically better shape than one that gets 400 and shortlists 8, even though the second looks more impressive in every meeting.
If you want a single volume-related number that means something, use qualified applications: the count of candidates who cleared your CV screen. That figure responds to ad quality and to targeting, it is directly comparable across roles, and it cannot be inflated by making the form shorter. The trap is that it is only trustworthy if the screen itself was consistent, which brings us to the next section.
Consistent scoring is what makes pass rates comparable
Here is the thing that quietly invalidates most funnel analysis. A pass rate is a ratio between a count and a standard. Everyone measures the count carefully. Almost nobody measures the standard at all.
Consider two rounds of the same role, three months apart. Round one: 200 applications, 30 shortlisted, 15% pass rate. Round two: 200 applications, 45 shortlisted, 22.5% pass rate. The obvious reading is that the candidate pool improved. The other reading, at least as likely, is that round one was screened by someone who read carefully and round two by someone in a hurry, or that the first screener treated "three years experience" as a hard floor and the second treated it as a guideline.
You cannot tell these apart from the numbers, and that is the whole problem. The pass rate is a measurement of the screener as much as of the candidates.
What makes them comparable is having the criteria written down before screening starts, with weights, and having every candidate scored against the same list with evidence attached. Not "seems like a fit" but "criterion four, three years of B2B support: scored 70, CV states two years four months at a B2B SaaS support desk". Now a difference in pass rate between rounds means something, because the ruler did not change between measurements.
This is the same discipline that makes interview scores comparable — the reason a structured rubric beats an unstructured conversation is not that the questions are better, it is that two interviewers using the same rubric produce numbers you can put next to each other. We went through the mechanics of that for interviews in the piece on behavioral Interview Questions: Asking Is Easy, Scoring Is t, and the logic transfers directly to CV screening. Your criteria should come out of the job description itself rather than being invented separately, which is the argument in job Posting Template: Write One, Get a Hiring Scorecard Too.
Three practical rules that get you most of the way there:
- Write the criteria before you look at a single CV. Once you have seen candidates, your criteria start bending around the people you liked.
- Score every candidate on every criterion, including the ones you reject in ten seconds. A rejection with no score attached is a hole in your data, and holes in the early funnel are where bias lives.
- Attach evidence to each score. If a score cannot be traced to a line in the file, it is an impression wearing a number's clothing.
The monthly review that takes thirty minutes
None of this works as an occasional exercise. It works as a short, boring, repeated meeting. Here is a version that fits in half an hour.
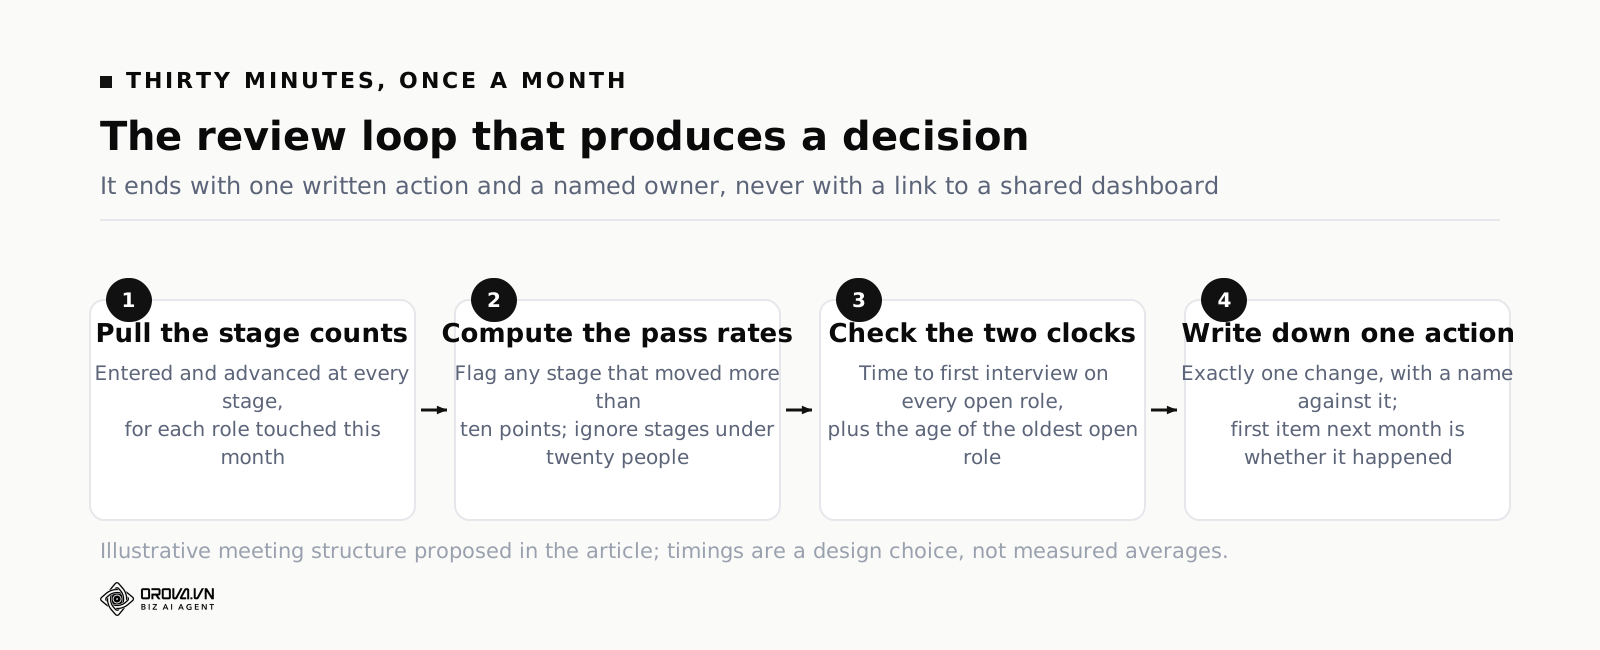
- Pull the stage counts for every role touched this month (about 10 minutes). Entered and advanced at each stage. If your system cannot give you this, count by hand — for a small team it takes minutes, and doing it by hand once tells you exactly which timestamps you are failing to record.
- Compute the pass rates and mark anything that moved more than about ten points from the previous round of the same role (5 minutes). Ignore stages with fewer than twenty candidates through them.
- Check the two clocks (5 minutes): time to first interview for every open role, and the age of the oldest open role. These two catch problems while they are still fixable.
- Pick exactly one thing to change and write it down with a name against it (10 minutes). One. A review that produces four actions produces zero. Next month, the first item on the agenda is whether last month's one action happened and what it did.
Once a quarter, add a fifth item: pull up the hires from four to six months ago, look at probation retention and the two-question manager survey, and compare those outcomes against the criteria scores those people got at screening. That is the loop that improves your criteria rather than your logistics, and it is the only one that touches quality of hire.
When a spreadsheet is enough, and when it stops being enough
For a long time, a spreadsheet is genuinely the right answer. One tab per role, one row per candidate, a column per criterion, a column for the stage they reached and the date they reached it. That gives you every metric in this article. It costs nothing, it forces you to define your stages, and nobody has to be trained on it.
It stops being enough at a fairly specific point: when the number of CVs to read per role exceeds what one person can read carefully in the time available. That is the moment the standard starts drifting inside a single round, and drift inside a round is worse than drift between rounds, because you cannot even see it. The thirtieth CV and the two hundredth CV get different readings from the same person on the same day, and every pass rate you compute afterwards inherits that.
The realistic options at that point are to split the reading across more people with a shared rubric (which reduces the drift but adds a between-reviewer difference), cut the volume at source with tighter targeting, or have software do the first read against your criteria and keep the judgement for yourself. If you go the software route, the thing to insist on is that every score comes back with the evidence it was based on, quoted from the file, and that the totals are computed from your weights rather than asserted by a model. That is what makes a machine-produced pass rate comparable to a human-produced one, and it is the design principle behind Orova Recruit, which turns a job description into weighted criteria and scores each CV against them with the supporting text quoted back — then keeps your own verdict in a second column beside the machine's, which is what makes the agreement rate below measurable at all. Whatever you use, the decision about who to interview stays with you — the tool is there to make the reading consistent, not to make the call. The broader question of which parts of the process a system can carry and which it cannot is covered in what an applicant tracking system actually does.
The metrics you can only collect if the loop lives in one place
Most articles about recruiting metrics stop at listing them. The reason teams do not measure is rarely that they do not know what to measure — it is that the data does not exist in a retrievable form. This section is about that gap.
Three data types, wildly different difficulty
Counts. Applications received, applications passed, interviews held, offers made. These almost always exist; they just need one place to live. If you are opening three systems to count, the problem is storage, not measurement.
Timestamps. Time from application to first response, from response to interview, from interview to decision. These only exist if every status change is recorded with a time. Spreadsheets rarely manage it, because people overwrite the status cell and the previous timestamp disappears with it.
Paired judgements. The most valuable and the rarest. Example: of the applications the machine marked pass, what share did the recruiter also mark pass? That single ratio measures the quality of your criteria. Collecting it requires the system to keep two verdict columns side by side rather than letting the later one overwrite the earlier one.
Five metrics worth having, ordered by how hard the data is to get
Stage conversion. Easiest. Track it per role, weekly. Aggregated across the company it is nearly useless, because anomalies in opposite directions cancel out.
Time to first response. Directly drives how many candidates remain in your pipeline at all, and it is the metric most improvable by pure process: attach the message to the status change instead of to somebody's memory.
Response coverage. The share of all applicants who received any reply. Rarely tracked, and it is the closest thing you have to a measure of your reputation as an employer. Note the denominator: every application received, not every application read.
Machine–human agreement. Needs the two verdict columns. A low agreement rate does not mean the machine is wrong; usually it means a criterion is written vaguely, or you are applying a criterion you never wrote down.
Question coverage in interviews. The rarest of all: of the questions prepared, what share were actually asked. If this is consistently low, either your interviews are too short for the set or the set was written for appearances. It is only computable if your rubric distinguishes "asked, scored low" from "never asked".
A cadence that survives a busy quarter
Weekly, look at the first three. Monthly, look at the last two. And adopt one rule that does more for data quality than any dashboard: close a role formally when it is filled, freeze its numbers, and only then open the next one. Metrics from a pipeline still in flight always look better than reality, because the people stuck in the middle have not yet become the denominator of anything.
Common questions about recruiting KPIs
How many recruiting KPIs should a small team track?
Four, which is what this article covers, and two of them only quarterly. If you are tracking more than six numbers with fewer than three hires a month, you are producing a report rather than running a process. Add a fifth only when you can state the decision it feeds and the threshold at which you would act.
What is a good time to hire?
There is no honest answer to this that is not role-specific and market-specific, and any single number quoted as a universal benchmark should be treated with suspicion. The useful comparison is against yourself: your own median for the same role family, three months ago. A team that cut its own time to first interview from 19 days to 8 has learned something real. A team that hit somebody else's published average has learned nothing.
Should cost per hire include the hiring manager's time?
Yes, and it will change the number substantially — usually more than any other single line item, because manager hours are the most expensive hours in the process. Include them, and be prepared for the total to look uncomfortable. That discomfort is the metric doing its job: it is what makes an unnecessary fourth interview round visible as a cost rather than as a free precaution.
How do you measure quality of hire without a performance review system?
Use probation-period retention plus the two-question manager survey at day 30 and day 90. Both work with no HR system at all. Retention is a yes or no from a payroll list; the survey is a message. Between them you catch the two failure modes that matter — the hire who leaves and the hire who stays but is not doing the job you hired for.
What is the difference between time to hire and time to fill?
Time to hire is measured per candidate, from their application to their acceptance, and it reflects how fast your process moves people. Time to fill is measured per role, from approval to acceptance or to start date, and it includes all the waiting before the role went live. Report both, label them clearly, and never let them be averaged together.
How often should these numbers be reviewed?
Pass rates and the two clocks, monthly. Cost per hire, quarterly or per role, never monthly at low volume. Quality of hire and its proxies, quarterly and always for a cohort of hires rather than individually. Anything reviewed weekly at small-team volume is being reviewed more often than it changes.
What to do this week
Do not build a dashboard. Do this instead, in about an hour.
Open a blank sheet. For every role you have open right now, write down four things: the date it was approved, the date it was posted, the date the first candidate sat in a first interview, and how many CVs are currently sitting unread. That last column is the one that will make you wince, and it is the one you can fix on Thursday morning.
Then for the last role you closed, count backwards through the stages and write the entered and advanced numbers for each. You will find at least one stage where the pass rate is not what you assumed, and you will probably find one stage where you cannot reconstruct the numbers at all — which tells you which timestamp to start recording from now on.
Finally, pick one number from the four and commit to it having an owner and a monthly slot. Not four. One. Time to first interview is the best candidate, because it is available while you can still act on it, it is cheap to measure, and the fix for a bad reading is entirely within your control. Get that one running for two months, then add the next.
Let AI read and score resumes against your JD
Orova Recruit turns your job description into weighted criteria and scores every CV with evidence quoted from the file.
Try it free