
What Is Looker Studio? A Practical Guide to Dashboards and Reports

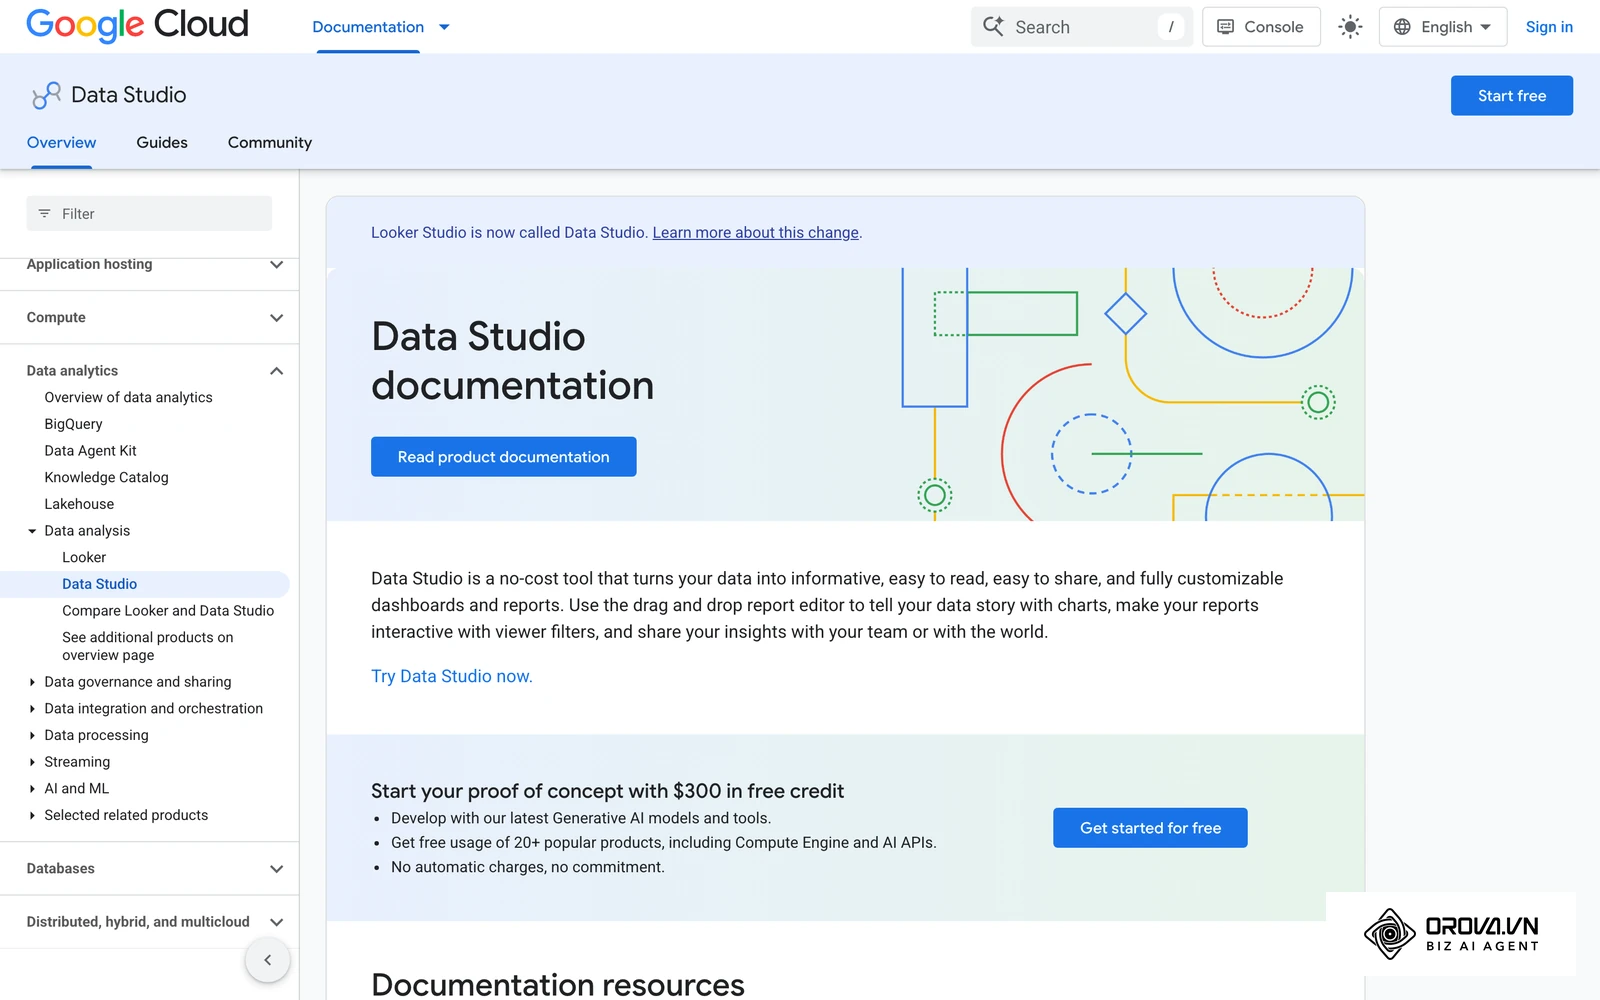
Looker Studio is Google's free, browser-based tool for turning data from sources like Google Analytics, Google Ads, Search Console, and Google Sheets into interactive dashboards and reports that update on their own. Google has since changed the name again: its official documentation now says "Looker Studio is now called Data Studio," but most people still search for and talk about it as Looker Studio, so this guide uses that name. Many professionals still spend hours manually downloading CSV files and pasting data into spreadsheets just to understand their weekly performance. This repetitive cycle often leads to outdated reports, human errors, and critical insights buried under mountains of rows. If you are struggling to make sense of your data streams, understanding what looker studio is will fundamentally change your workflow. While older methods treat reporting as a tedious administrative task, modern workflows treat it as a continuous, automated process. This guide provides a deep dive into the platform, showing you exactly how to connect your data, bypass common errors, and build dashboards that actually drive business decisions.
If you would rather not start from a blank page, Looker Studio also includes a built-in template gallery: open the product, browse the templates, and make a copy of one that matches your data source.
What is Looker Studio?
Looker Studio is a free, cloud-based data visualization tool by Google that transforms raw data into interactive, customizable dashboards and reports. Google also sells a paid edition, now called Data Studio Pro (previously Looker Studio Pro), that adds team and administration features on top of the free version. It is used to consolidate metrics from various sources into unified views, differing from traditional spreadsheet software by offering dynamic data connections rather than static data entry.
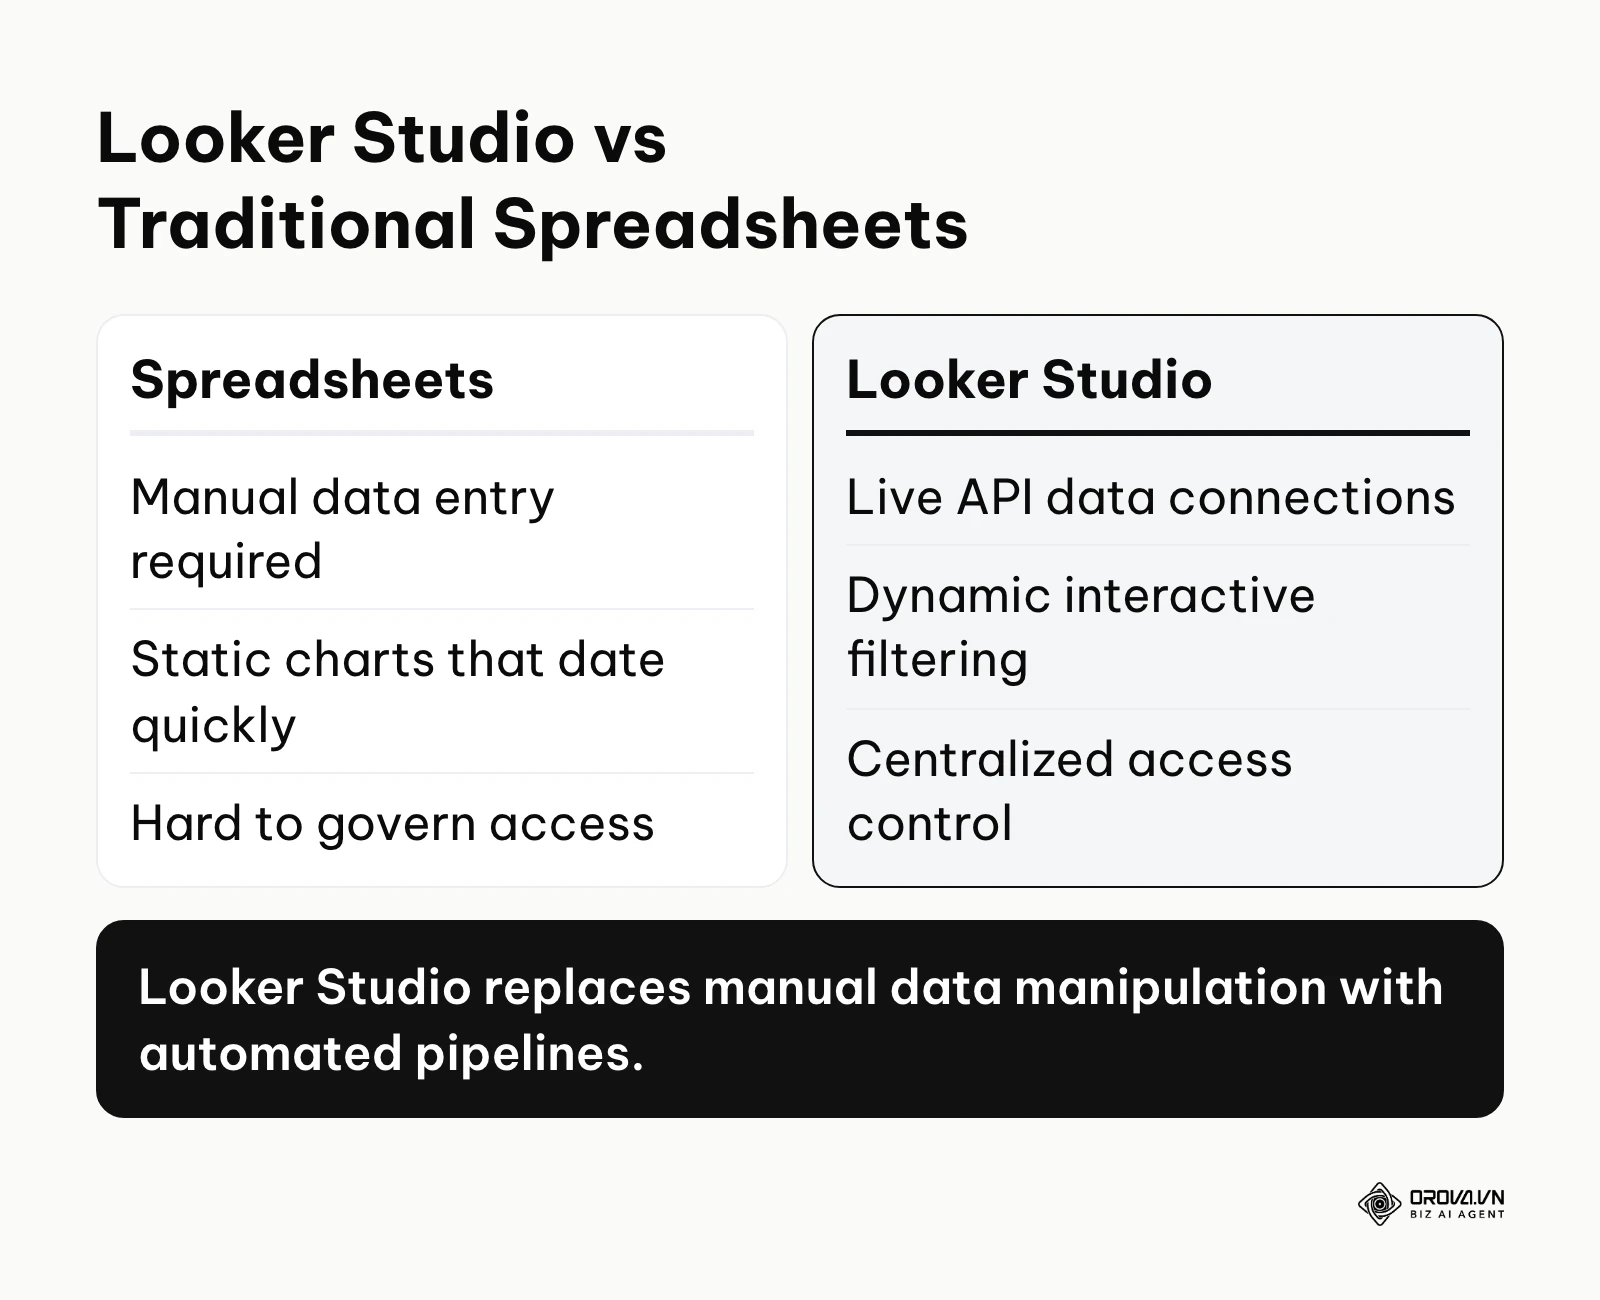
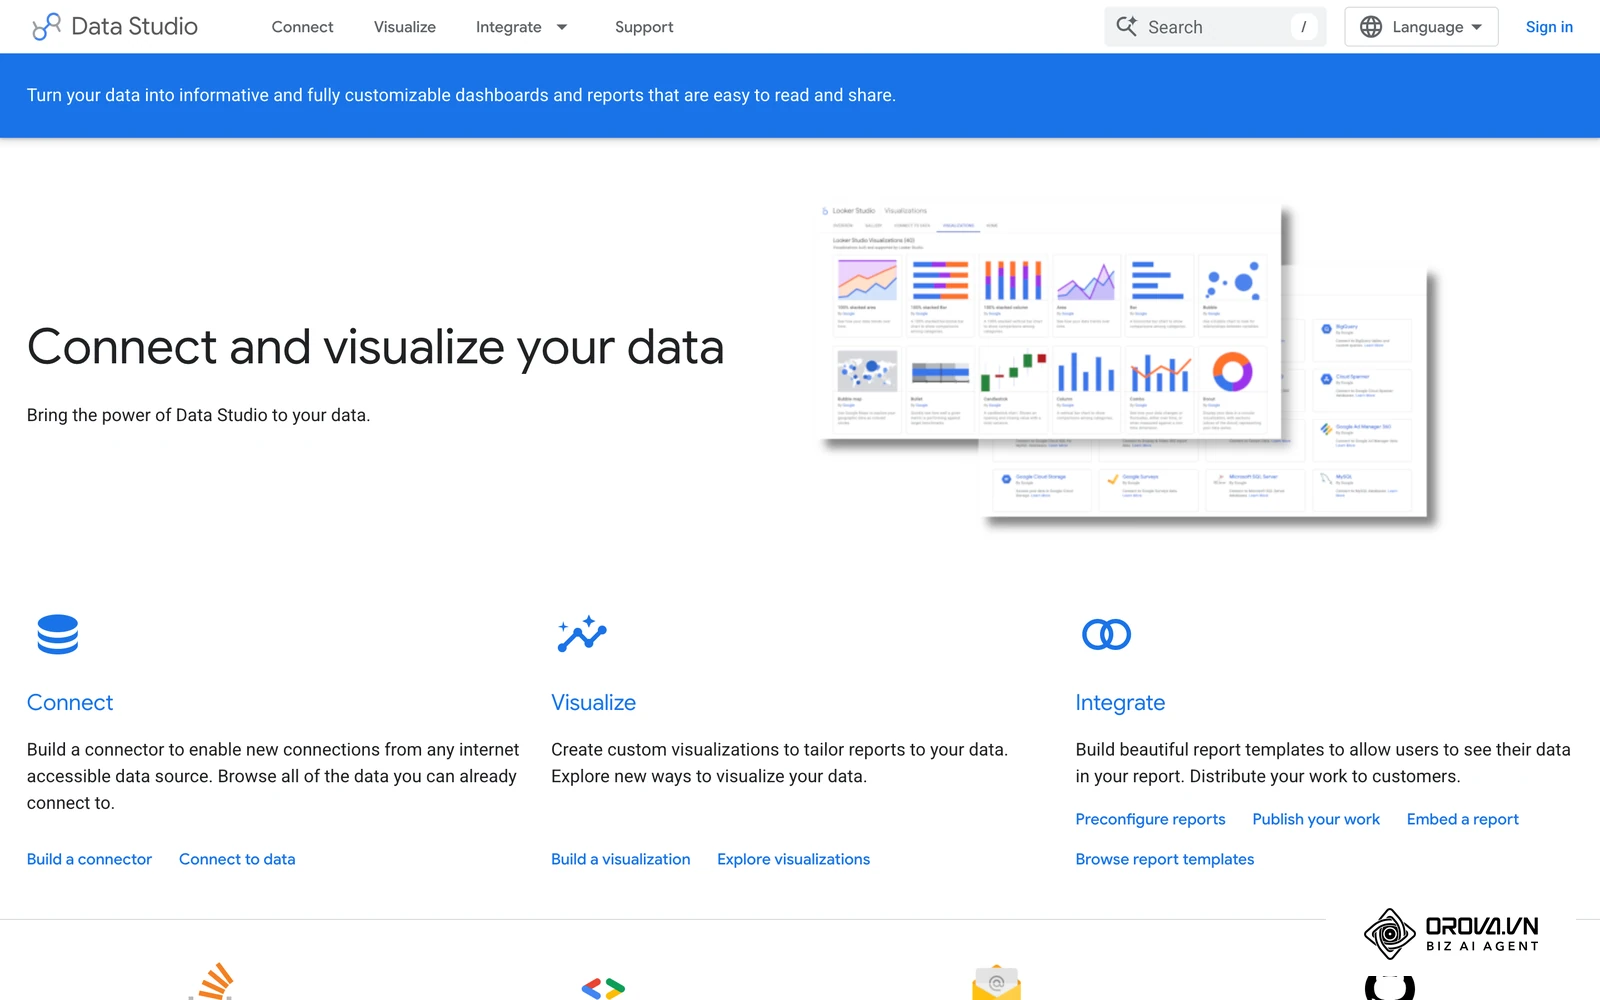
Originally launched as Google Data Studio, the product was renamed Looker Studio to bring it under the brand of Looker, the enterprise business intelligence platform Google had acquired, and Google has since switched the name back to Data Studio. Despite the name change, the free version retains its core mission: democratizing data visualization for users who do not know how to write complex code or query databases directly. It serves as the visual presentation layer that sits on top of your existing data infrastructure.
Looker Studio is often confused with other tools in the market. To clarify its position, here is a breakdown of how it differs from its closest alternatives:
| Concept | How it differs | Example |
|---|---|---|
| Microsoft Excel / Google Sheets | Looker Studio does not store data; it only visualizes it. Spreadsheets require manual data manipulation. | Using Sheets to calculate formulas, and Looker Studio to display the final bar chart. |
| Microsoft Power BI | Looker Studio is fully web-based and generally simpler, while Power BI offers deeper data modeling and desktop applications. | A small agency uses Looker Studio; an enterprise uses Power BI for complex on-premise data. |
| Google Analytics 4 (GA4) | GA4 collects and processes website behavior data. Looker Studio pulls that data to create custom visual reports. | You track a button click in GA4, but visualize the monthly trend of that click in Looker Studio. |
A common real-world example of using Looker Studio is a marketing manager who needs to show their CEO a daily update on website traffic and advertising spend. Instead of logging into Google Analytics and Google Ads separately every morning, they build one Looker Studio link. Whenever the CEO opens that link, the charts automatically fetch the latest numbers from both platforms, displaying a unified view of performance.
The Purpose of Looker Studio in the Data Ecosystem
Looker Studio exists to solve a specific problem: the fragmentation of data. Modern businesses operate across dozens of platforms. Your website traffic lives in one tool, your advertising spend in another, and your customer database in a third. If you want to understand the full customer journey, you must bring these isolated metrics together. Looker Studio acts as the universal translator, reaching into these different systems, extracting the relevant numbers, and displaying them on a single, coherent canvas. It is designed primarily for marketers, analysts, and business owners who need to communicate performance without getting bogged down in database engineering.
In the broader data ecosystem, Looker Studio occupies the very end of the pipeline. The ecosystem typically follows a specific order: first comes data collection (like tracking pixels or CRM inputs). Second comes data storage (like Google BigQuery or cloud databases). Third comes data modeling (structuring the raw data into usable formats). Finally, Looker Studio steps in at the fourth stage: visualization and presentation. It is the surface-level interface that stakeholders actually see and interact with.
More and more teams expect self-service visualization instead of waiting on analysts. If you choose to ignore Looker Studio or similar platforms, you risk losing transparency. Without automated dashboards, organizations suffer from data silos, where only technical personnel have the access and skills to pull reports. This creates a bottleneck that slows down decision-making and obscures critical trends that could have been identified through visual patterns.
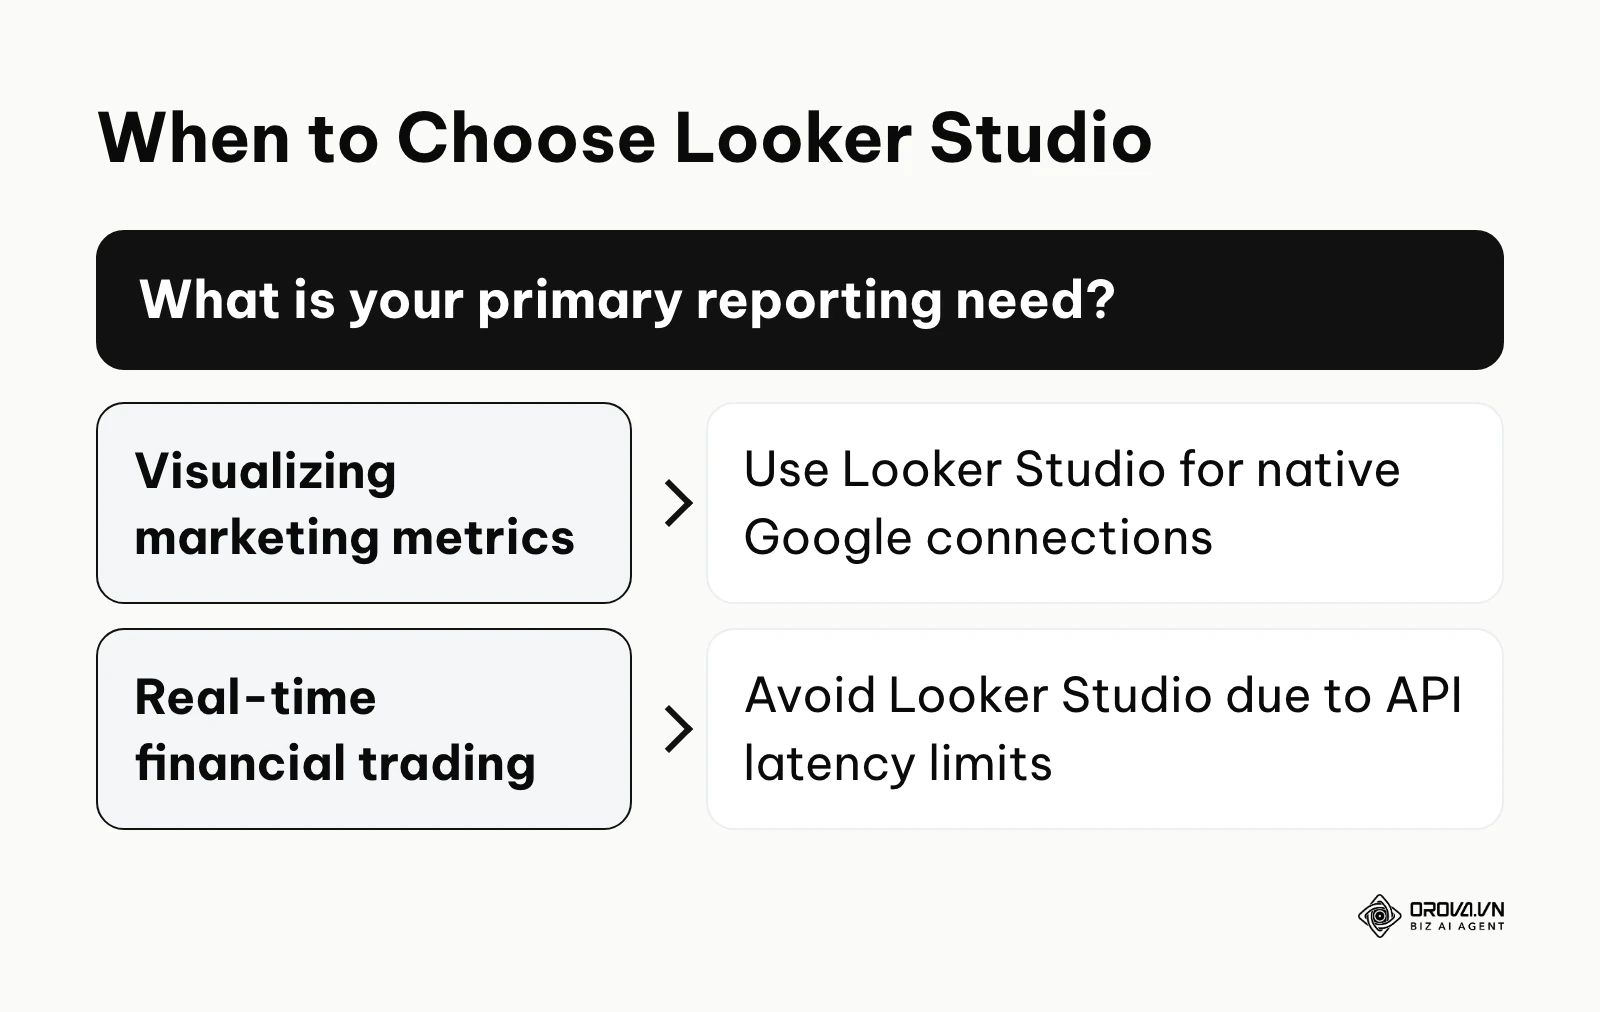
However, Looker Studio is not a universal solution for every data problem.
Looker Studio is not the right choice for complex data warehousing or machine learning modeling. If your organization requires real-time, sub-second data streaming for financial trading, the inherent API latency will cause unacceptable delays. Additionally, if you need on-premise deployment due to strict military or healthcare compliance, this cloud-only tool falls short. In these cases, enterprise solutions like Power BI deployed on local servers, or dedicated data science platforms running custom Python environments, are the necessary alternatives.
The Business Value and User Benefits of Looker Studio
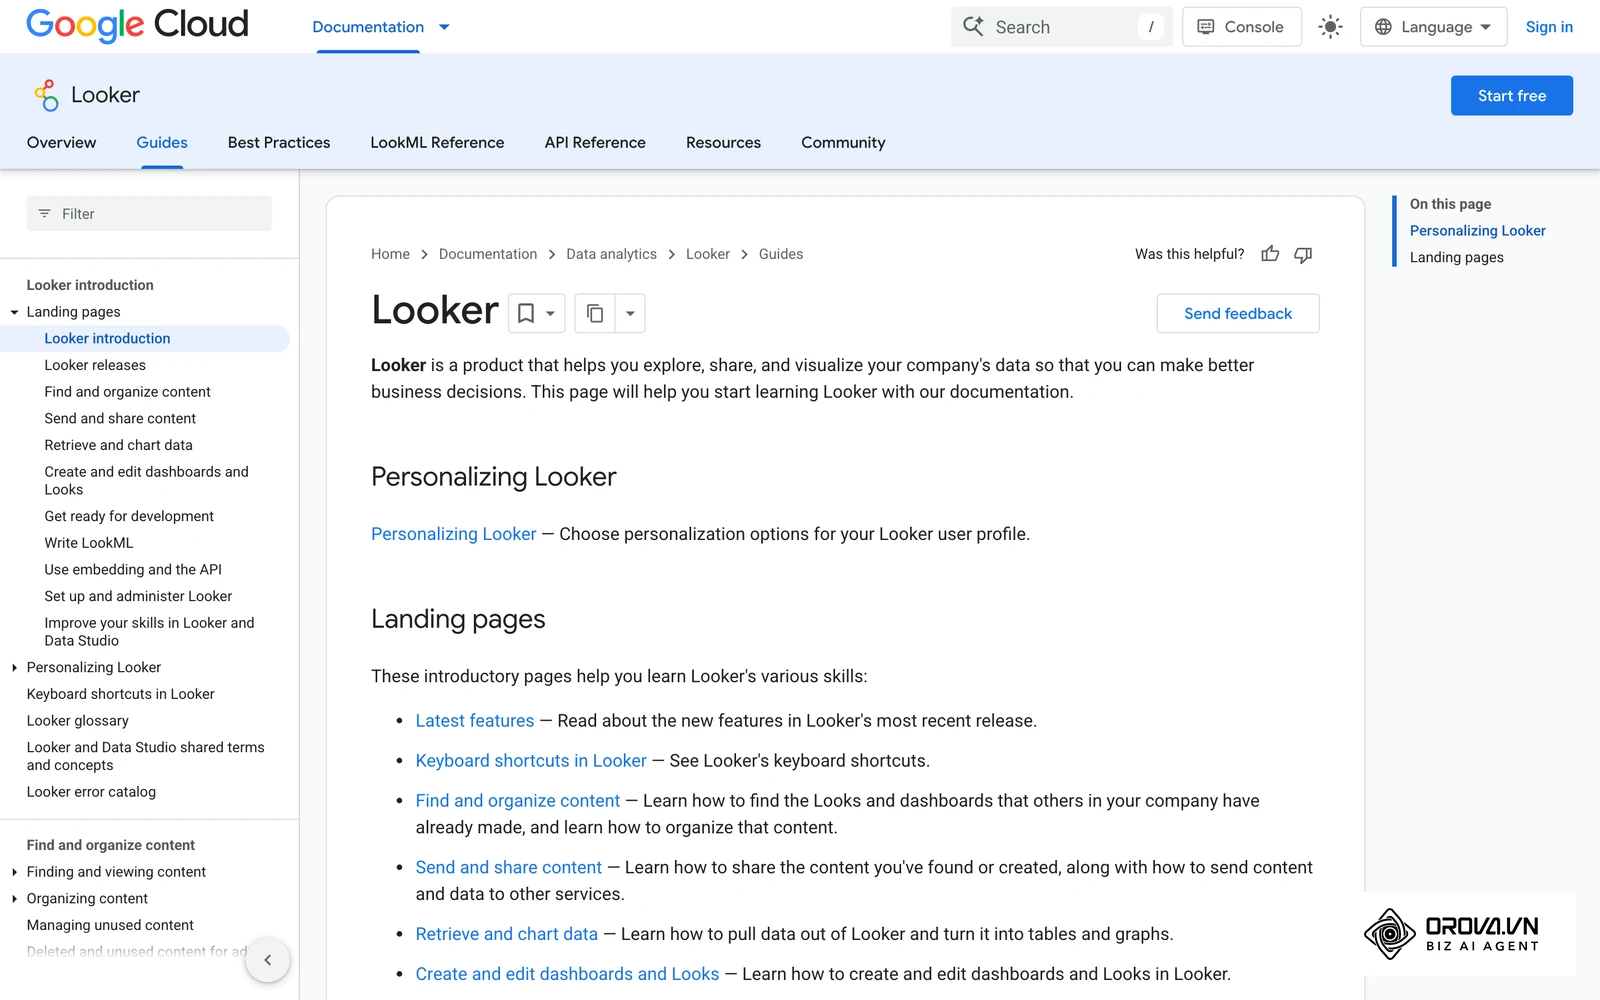
The impact of adopting Looker Studio can be divided into two distinct layers: the macro-level value for the overall business, and the micro-level benefits for the employees who build and use the reports daily.
Business-Level Value: Cost, Risk, and Transparency
From a business perspective, the primary value is operational efficiency. Looker Studio eliminates the repetitive labor costs associated with manual reporting. When data is pulled automatically via APIs, the risk of human error—such as pasting the wrong cell in a spreadsheet or miscalculating a formula—is drastically reduced. Furthermore, it creates organizational transparency. When everyone from the intern to the CEO looks at the exact same dashboard, arguments over whose data is correct disappear. This unified truth accelerates strategic alignment.
Example scenario: A mid-sized retail agency managing 20 client accounts needed a way to consolidate reporting. Previously, the team manually exported CSV files from multiple advertising platforms every Monday. They connected these sources to Looker Studio using native connectors to automate the data retrieval. The main hurdle was handling disparate date formats across platforms, which they fixed by standardizing the date dimensions using calculated fields. The result was an automated weekly reporting system that completely eliminated manual data entry, shifting the team's focus entirely to strategy.
Direct Benefits for Marketing and Analytics Teams
For the individuals doing the work, Looker Studio provides immense autonomy. You do not need to submit a ticket to the IT department to get a new chart. You can drag and drop elements yourself, which removes a common bottleneck between the people asking questions and the people who can pull the numbers. It also allows for dynamic storytelling; instead of a static slide deck, you can interact with the data during a presentation, answering questions on the fly by adjusting date filters or segmenting audiences.
The benefits can be tracked and measured across various dimensions:
| Benefit | Measured by which metric | Time to see results |
|---|---|---|
| Time Savings | Hours spent generating reports per week | 1-2 weeks (after initial setup) |
| Error Reduction | Number of data discrepancy complaints per month | Immediately |
| Decision Speed | Days taken to identify and react to a campaign anomaly | 2-4 weeks |
If building dashboards from scratch feels like a project of its own, Orova Insight is a simpler path. Connect GA4, Search Console, Google Ads, Meta, TikTok, YouTube, LinkedIn and more, then ask questions in plain language and let AI build the charts. You get a drag-and-drop dashboard with versioning, sharing and scheduled reports to keep your team aligned.
How Looker Studio Works: The Core Anatomy and Practical Guide
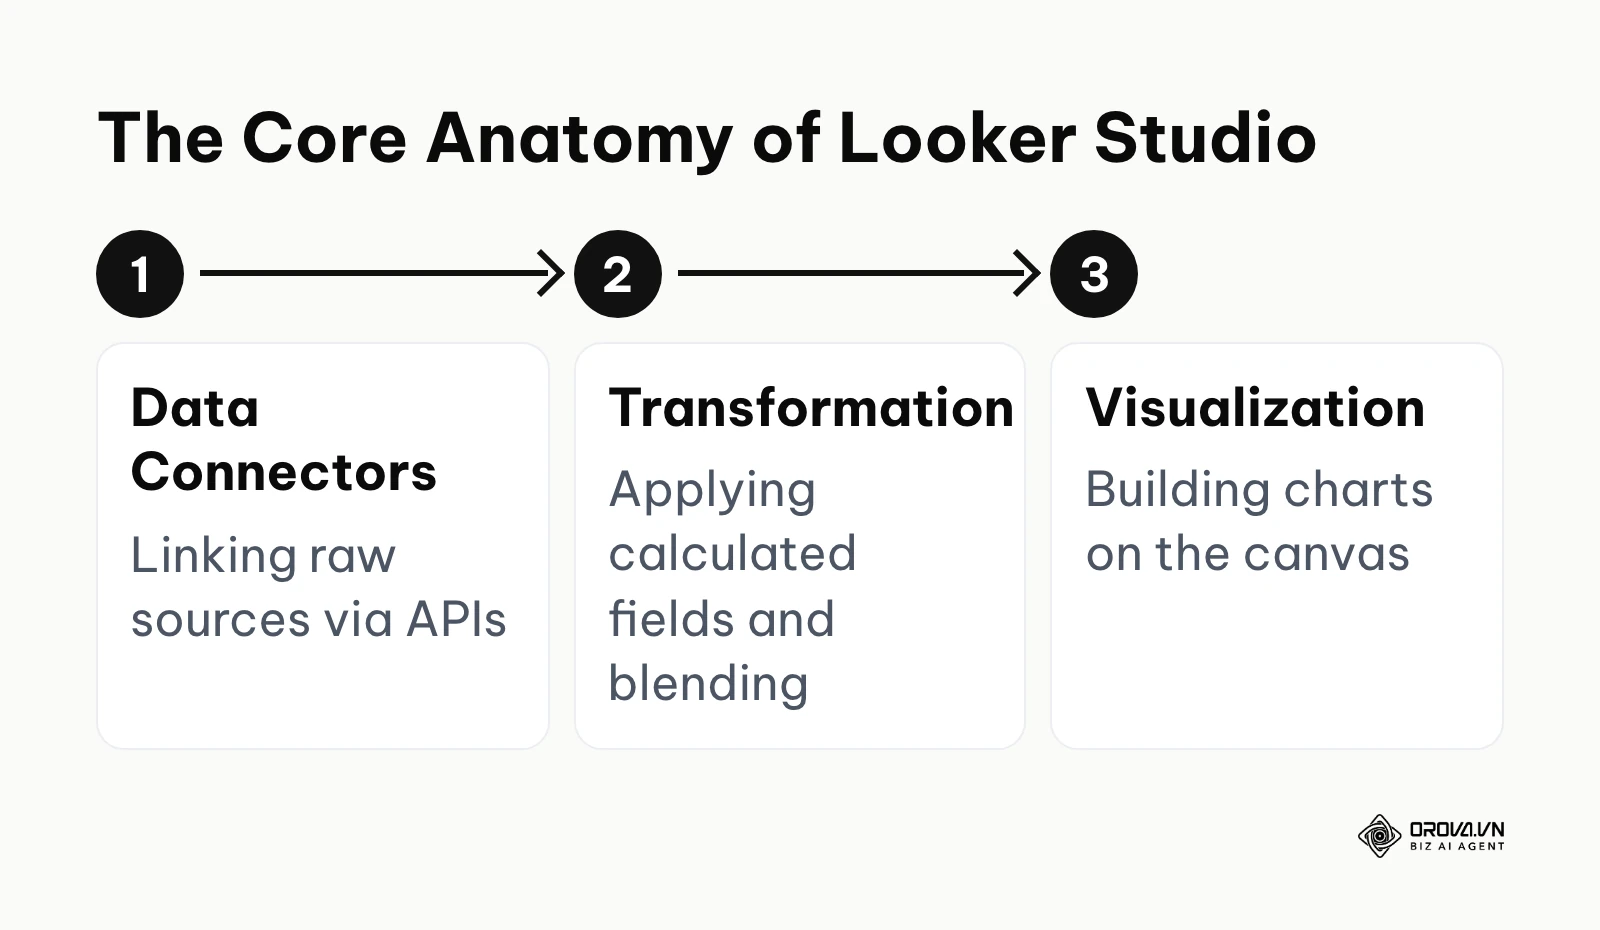
To master Looker Studio, you must understand its anatomy. The platform functions through a series of interconnected layers, each responsible for a specific part of the data journey.
Data Connectors (The Input Layer)
Connectors are the bridges between Looker Studio and your data sources. When you start a report, you must first authorize a connector. Google provides native, free connectors for its own ecosystem, including Google Analytics, Google Ads, and BigQuery. For external platforms like Facebook Ads or Salesforce, you generally rely on Partner Connectors built by third-party companies, which often require a paid subscription. The input is your account credentials; the output is a "Data Source" inside Looker Studio containing all available dimensions (categorical data like 'City') and metrics (quantitative data like 'Clicks'). This layer breaks most frequently when API passwords change or platforms update their permission structures.
The Canvas and Visualizations (The Presentation Layer)
The canvas is the blank grid where you design your report. Here, you drag and drop various visualization elements such as time series charts, pie charts, and geo maps. You link each visual to a specific Data Source. The input here is the raw data stream; the output is a styled, readable chart. This layer is highly customizable, allowing you to change colors, fonts, and conditional formatting to match brand guidelines. It usually breaks when you try to force an incompatible dimension and metric together, resulting in a user-facing error message on the chart.
Calculated Fields and Data Blending (The Transformation Layer)
Often, your raw data is not perfectly formatted. Looker Studio allows you to create Calculated Fields using mathematical formulas and functions to manipulate the data directly within the tool. Furthermore, Data Blending allows you to join multiple data sources together based on a common key (like a shared date or URL). For example, visualizing the results of your SEO content writing initiatives is critical for long-term growth, and blending organic traffic data with conversion data helps prove that value.
Here is a quick cheat sheet for common Calculated Fields:
| Objective | Formula Example | Use Case |
|---|---|---|
| Create a custom metric | SUM(Revenue) / SUM(Clicks) | Calculating Revenue per Click when the native platform does not provide it. |
| Grouping text values | CASE WHEN Source = "google" THEN "Organic" ELSE "Other" END | Cleaning up messy UTM source tags into clean, readable categories. |
| Formatting dates | FORMAT_DATETIME("%Y-%m", Date) | Converting daily date strings into clean Year-Month formats for high-level charts. |
| Return on ad spend | SUM(Conversion value) / SUM(Cost) | Showing ROAS per campaign when blending ad cost with revenue data. |
If you build that last metric, double-check the definition your team uses; this guide to the ROAS formula explains the common variations.
Looker Studio supports various types of dashboards depending on your needs:
| Type of Dashboard | Characteristics | Best Suited For |
|---|---|---|
| Executive Overview | High-level scorecards, minimal filtering, focused on ROI. | C-suite leaders who need quick health checks. |
| Operational Deep Dive | Highly granular tables, extensive date and category filters. | Specialists analyzing daily campaign performance. |
| Public Data Portal | Embedded on a website, stripped-down navigation, anonymous access. | Organizations sharing open data with the public. |
Step-by-Step Project: Building an SEO Dashboard from Scratch
To truly understand how it works, let us walk through building a practical project: an SEO dashboard tracking search performance.
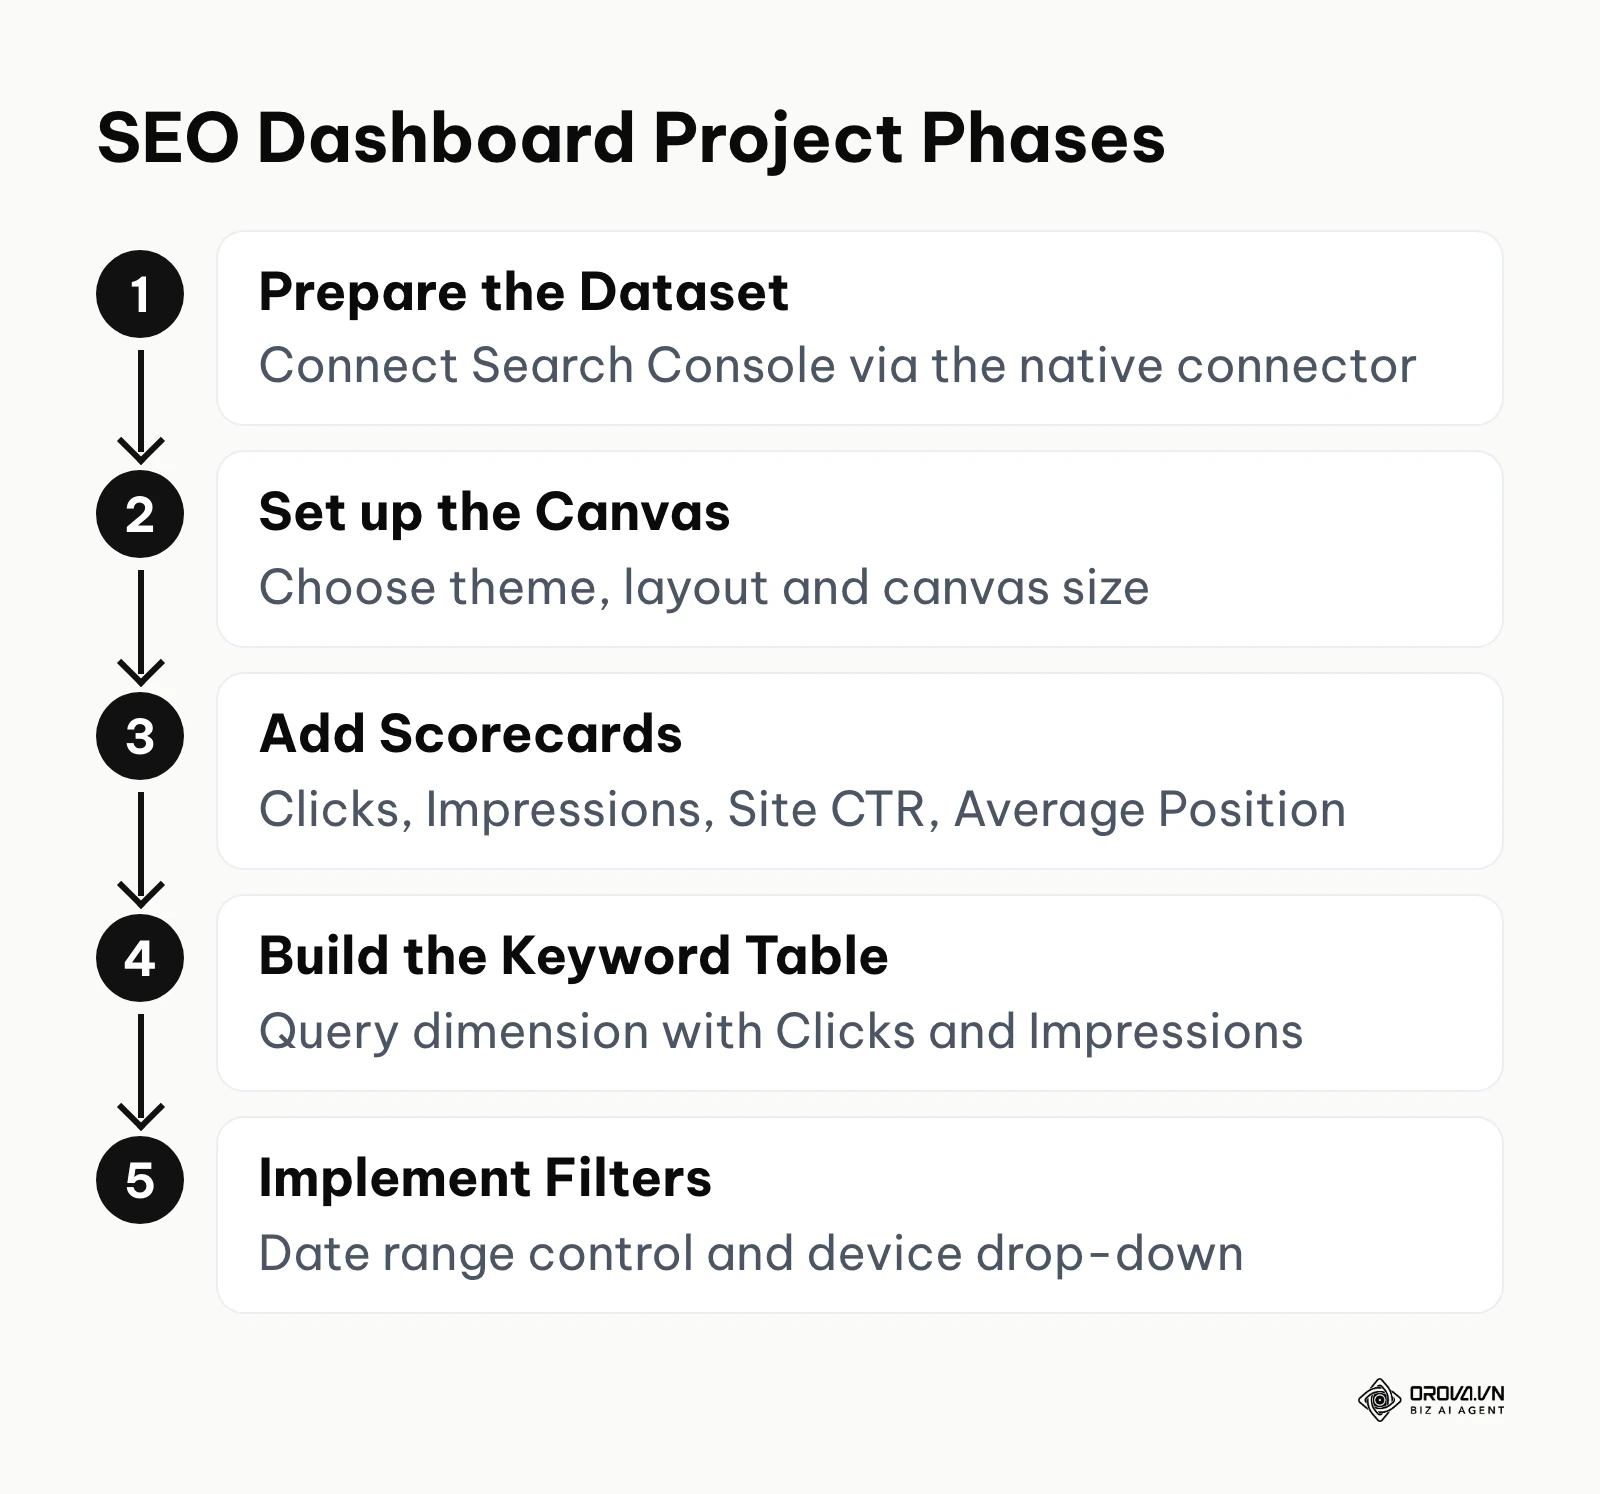
Step 1: Prepare the Dataset Navigate to Looker Studio and click "Create Data Source." Search for the "Google Search Console" native connector. Authorize your account and select your website property. You will be prompted to choose a table: select "Site Impression" to track overall domain performance, or "URL Impression" to track specific page performance. Click "Connect" in the top right corner.
Step 2: Set up the Canvas You will be dropped onto a blank canvas. Go to "Theme and Layout" on the right sidebar. Under Layout, set the canvas size to 1920 x 1080 to fit modern screens perfectly. Choose a dark or light theme based on your preference.
Step 3: Add the Scorecards Click "Add a chart" in the top toolbar and select "Scorecard." Place it at the top of the canvas. In the data panel, set the metric to "Clicks." Copy and paste this scorecard three times, changing the metrics of the copies to "Impressions," "Site CTR," and "Average Position." Scroll down in the data panel to "Comparison date range" and set it to "Previous period" so you can see growth trends immediately.
Step 4: Build the Keyword Table Click "Add a chart" again and select a "Table with bars." Place it below your scorecards. Set the Dimension to "Query" (which represents the keywords users searched for). Set the Metrics to "Clicks" and "Impressions." This creates a clean, sortable list of your top-performing keywords.
Step 5: Implement Filters A static dashboard is useless. Click "Add a control" and choose "Date range control." Place it in the top right corner. Click "Add a control" again and choose "Drop-down list." Set the control field to "Device Category." Now, when a viewer changes the date or selects "Mobile," every chart on the page will automatically update to reflect those constraints. You have successfully built a functional dashboard.
Troubleshooting Common Errors in Looker Studio
When building advanced dashboards, you will inevitably encounter errors. Here is how to fix the most common ones.
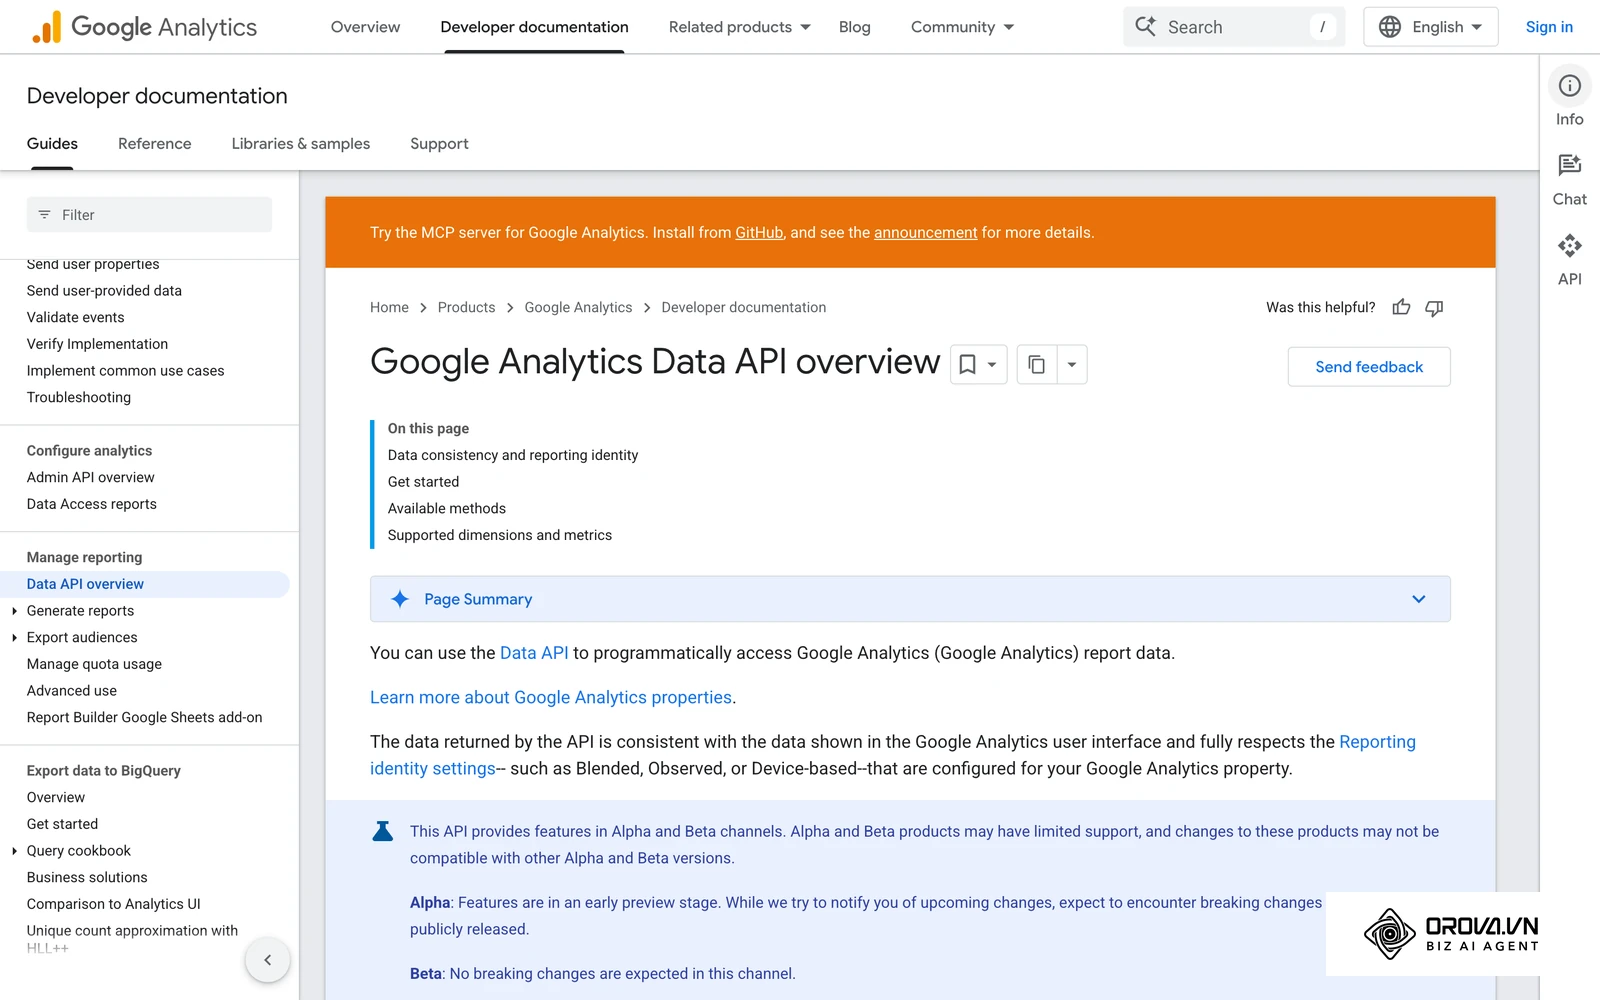
The most notorious issue is the GA4 quota error. The Google Analytics Data API limits how many tokens each property can use over a given period. If your dashboard has many charts, or if multiple people view it simultaneously, you will exhaust these tokens, causing charts to display a grey error box. To fix this, you must optimize how data is queried.
Example scenario: An in-house marketing team for a software company experienced broken charts with "Quota Exceeded" errors after new API limits were introduced. They were pulling high-cardinality event data directly into complex tables that updated continuously. They audited their dashboard to remove unnecessary dimensions and applied the Looker Studio Extract Data connector to snapshot the data once daily. The hurdle was training stakeholders to accept daily snapshots instead of live updates, which they resolved by clearly documenting the API limitations. The result was a noticeably faster dashboard that stopped running into quota errors during normal use.
If a community connector breaks, it usually means the third-party API key has expired. Navigate to your data source settings, click "Edit Connection," and re-authenticate your credentials. Finally, if data blending returns empty rows, check your join keys. Both data sources must have the exact same format for the key (e.g., both must be formatted as YYYY-MM-DD dates) for the blend to work.
Performance Optimization: Making Looker Studio Load Faster
Looker Studio can become painfully slow if not optimized, and the fixes are mostly about sending fewer, simpler queries to your data sources.
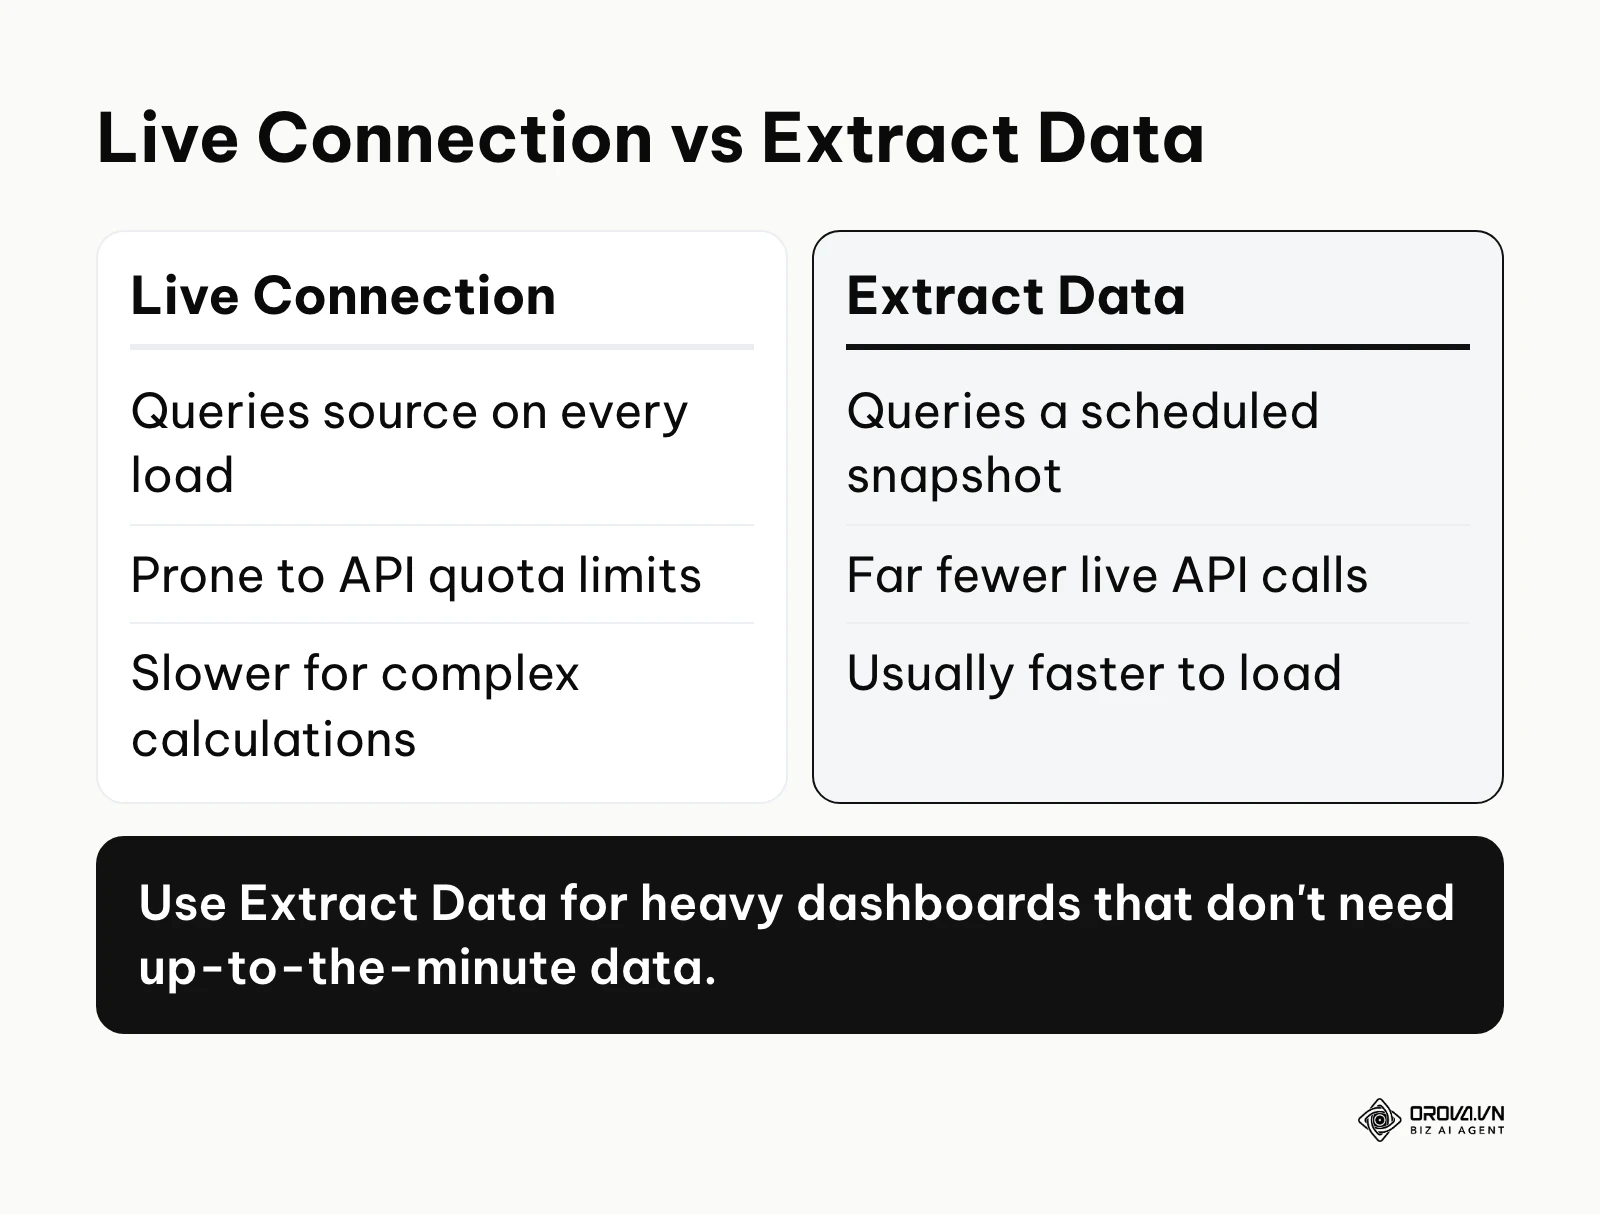
The most effective way to speed up a dashboard is using the "Extract Data" connector. Instead of querying the live API every time someone changes a filter, Extract Data pulls a snapshot of the fields you choose and refreshes it on a schedule you set (for example, once every morning). This sharply reduces live API calls and usually makes the report load much faster. Extracts have a size limit, so keep only the dimensions and metrics the report actually uses.
Additionally, reduce the complexity of your pages. A single page with thirty charts will struggle to render. Break your dashboard down into multiple pages using the left-hand navigation menu. Ensure that any complex calculations are done at the database level (like in BigQuery or Google Sheets) before the data ever reaches Looker Studio.
How to Adapt and Start with Looker Studio
Adopting a new data visualization tool requires a strategic approach depending on your role within the organization.
The Small Business Owner
For a small business owner, the goal is clarity without complexity.
- Identify your most critical metric (e.g., daily sales or leads).
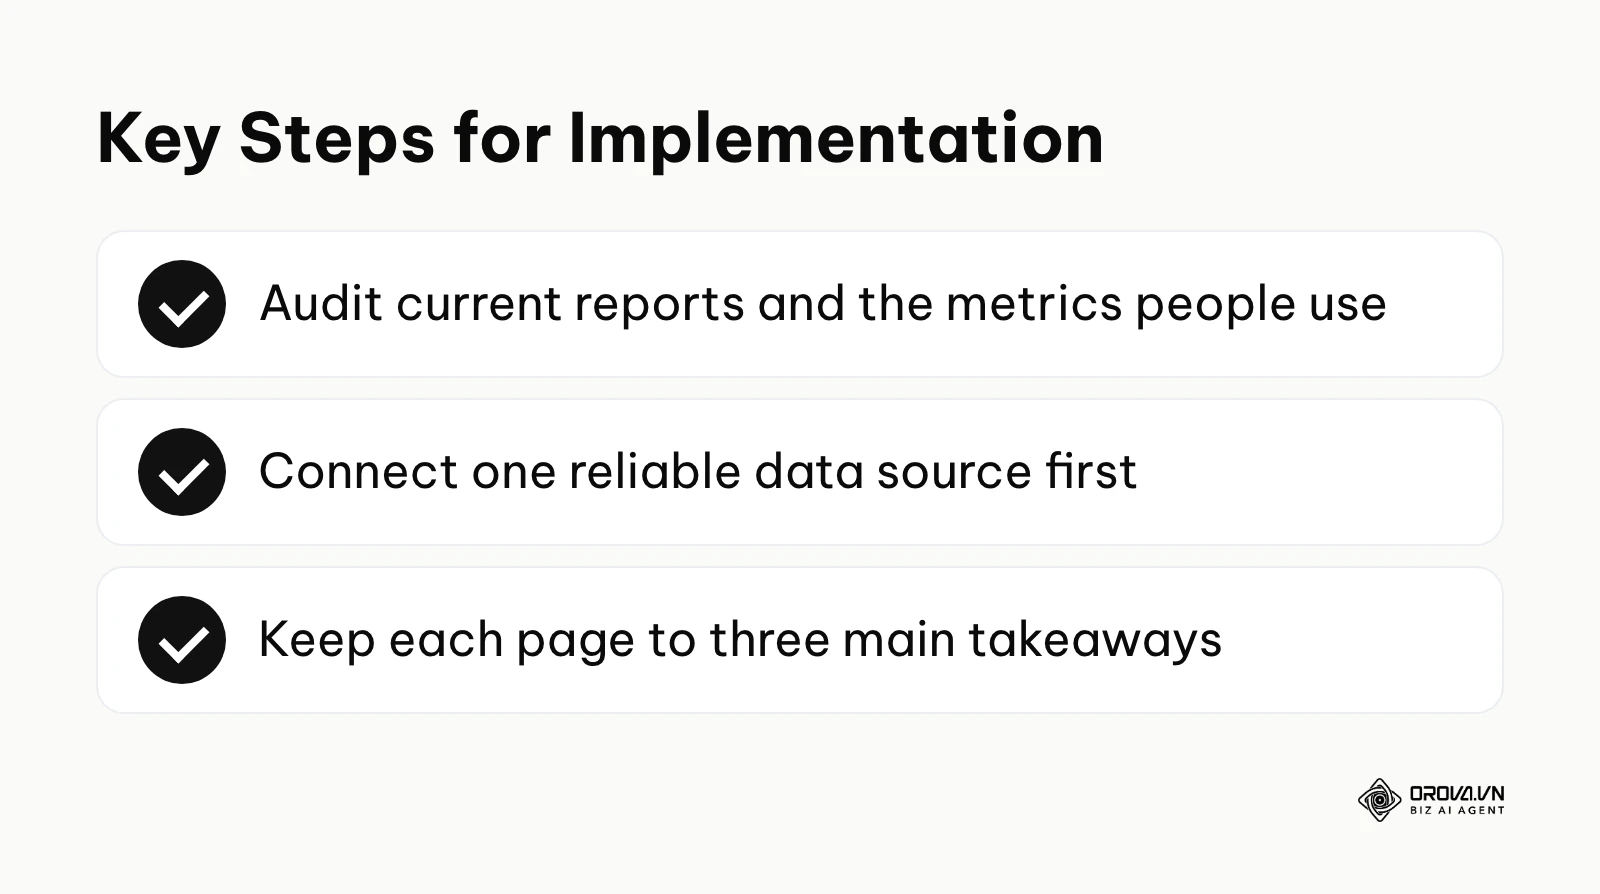
- Connect a single, reliable data source, like a basic Google Sheet where you track revenue.
- Build one simple scorecard and one line chart.
- Bookmark the link and review it every morning with your coffee.
The In-House Marketing Manager
For the marketing manager, the goal is alignment and reporting efficiency. Looker Studio does not replace dedicated SEO tools for rank tracking or audits, but it is flexible enough to put organic and paid data side by side in one report.
- Audit your current manual reports and identify the metrics your boss actually cares about.
- Set up automated connections for Google Analytics and Google Ads.
- Replicate your existing spreadsheet report inside Looker Studio.
- Schedule an automated weekly PDF email delivery to your stakeholders to ensure they see the data.
The Agency or Freelancer
For agencies, the goal is scalable client communication.
- Build a comprehensive "Master Template" dashboard.
- Use the "Make a copy" feature for each new client, simply swapping out their specific data sources.
- Implement report-level themes to quickly change colors and fonts to match the client's branding.
- Embed the dashboard directly into your agency's client portal website using the iframe embed code.
Example scenario: A freelance consultant managing five local business clients struggled to communicate the value of their monthly retainers. They relied on overwhelming spreadsheets that clients rarely opened. They created a master Looker Studio template connecting Google Search Console and local business data. The initial hurdle was styling the reports to match different client brand guidelines without rebuilding from scratch, which they solved by utilizing report-level theme extraction. The result was a standardized, branded client portal that improved client comprehension and secured long-term contract renewals.
When adapting to the platform, many users fall into predictable traps:
| Common Mistake | Consequence | How to Avoid It |
|---|---|---|
| Adding too many charts on one page | The dashboard becomes slow, cluttered, and impossible to read. | Stick to the "rule of three": maximum three main takeaways per page. |
| Forgetting to set date ranges properly | Viewers see lifetime data instead of recent trends, skewing decisions. | Always apply a default "Last 30 Days" date range to the report level. |
| Ignoring data source permissions | When you share the report, viewers see empty charts because they lack data access. | Set data credentials to "Owner's Credentials" rather than "Viewer's Credentials." |
Want marketing numbers and CRM data in one place? Orova Insight lets you bring in your own CRM or other sources through API, webhooks or Google Sheets, alongside your ad and analytics channels. Present dashboards in presentation mode with role-based access, and track custom metrics your team defines. It is free until July 7, 2027, with no card required.
Where Looker Studio is heading in the next few years: the author's take
These are my opinions, not announcements from Google. Each one starts from a signal I can see today and ends with what I would prepare for.
The Integration of Generative AI for Automated Insights
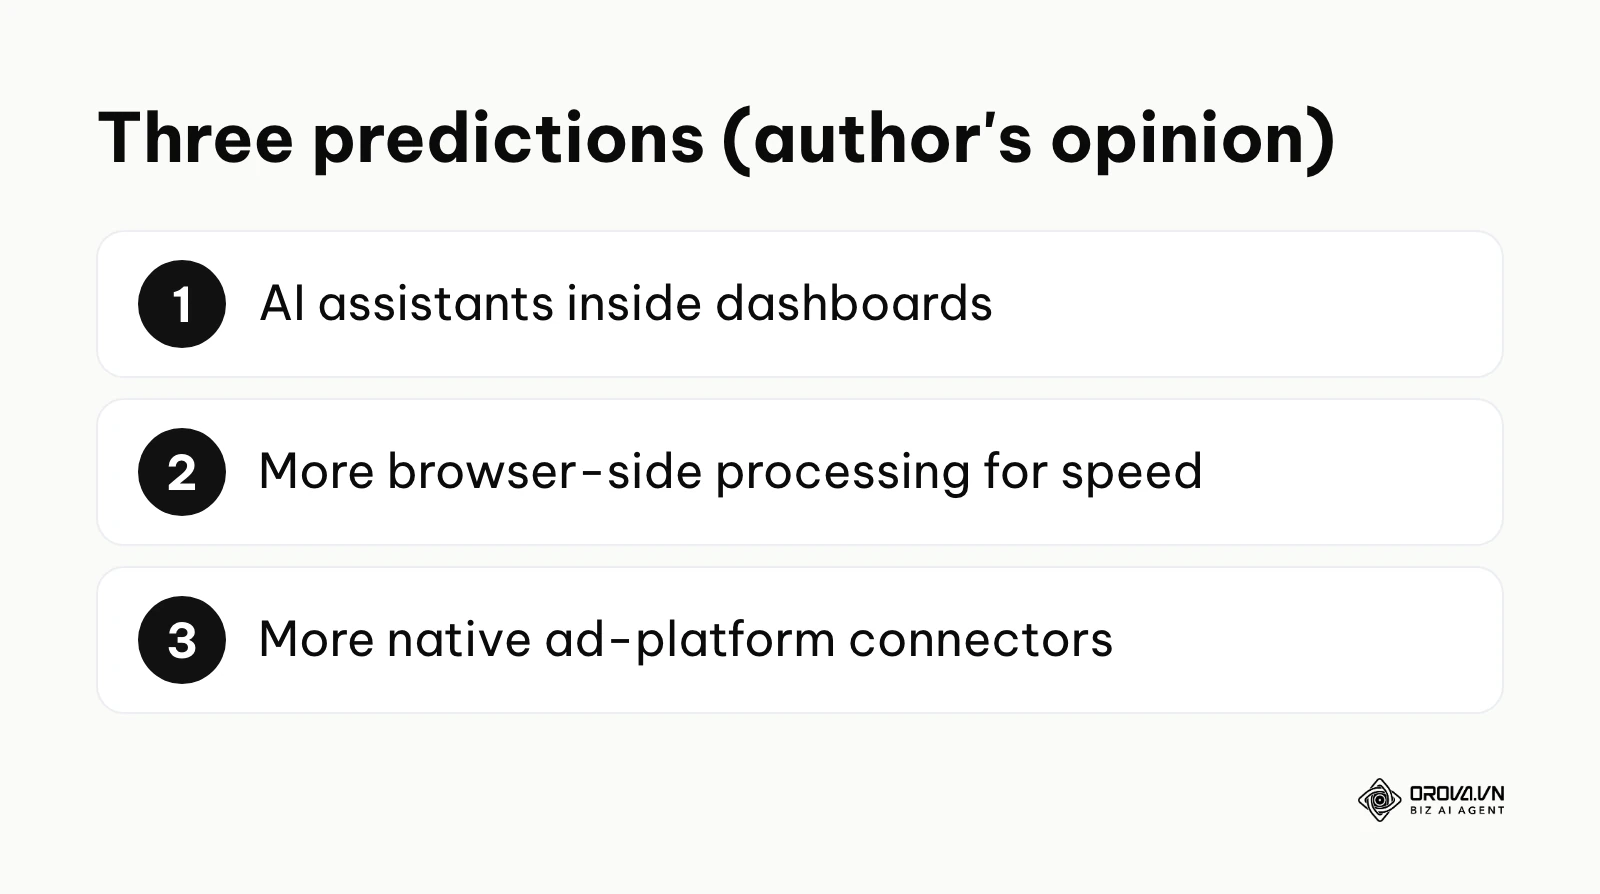
As of 2026, AI assistants are already appearing inside BI tools, including early conversational features in the Google ecosystem. I believe that in the next two to three years, Looker Studio will feel more like an analytical assistant than a passive display board. Because large language models keep getting better at interpreting structured data, asking a dashboard a plain-language question could become a normal part of everyday reporting. Readers should prepare by ensuring their underlying data models and naming conventions are extremely clean, as AI relies heavily on clear semantic structures to function correctly. This prediction could be wrong if Google decides to keep Looker Studio strictly as a visualization layer and pushes all AI capabilities into their paid Looker enterprise tier.
The Shift Towards Browser-Side Processing for Faster Rendering
Currently, heavy dashboards can feel slow. My read is that Looker Studio will lean more on caching and browser-side processing to render visualizations. Because web technologies like WebAssembly are maturing, more of the data processing load can be shifted to the user's local machine rather than Google's servers. You should prepare by learning how to structure data extracts efficiently rather than relying purely on live API connections. However, if browser security policies become too restrictive, this local processing shift might not fully materialize.
More Native Connectors for Major Ad Platforms
Right now, users rely heavily on third-party connectors for non-Google platforms. I think pressure will grow on Google to offer more native connectors for major ad platforms like Meta and TikTok, because ad teams want paid social and search data in one view without extra pipelines. Because the value of a BI tool depends so much on how easily it connects to data, this would make Looker Studio even more attractive to small businesses. You should start auditing your current third-party connector costs and be ready to switch if native options appear. Of course, Google may decide to leave this space to its partner ecosystem.
Frequently Asked Questions About Looker Studio
Is Looker Studio completely free?
The standard version of Looker Studio is free to use. You do not pay for the platform itself, the canvas, or the native Google connectors. Google also offers a paid edition, Data Studio Pro (previously Looker Studio Pro), aimed at teams that need extra administration and collaboration features. In addition, if you need to pull data from non-Google sources like Facebook Ads, you will likely need to pay a subscription fee to a third-party connector provider.
Is Looker Studio still needed with AI?
Yes, absolutely. While AI is excellent at generating insights from data, humans still need structured, visual interfaces to monitor daily performance at a glance. AI will enhance Looker Studio by allowing you to generate charts via text prompts, but the dashboard format remains the most efficient way to display standardized, recurring metrics to a team. Integrating server-side tracking via the conversion API ensures your data remains accurate before it even reaches Looker Studio, providing a solid foundation for both AI and human analysis.
Can Looker Studio connect to my internal database?
Yes, Looker Studio supports direct connections to PostgreSQL, MySQL, SQL Server, and Google BigQuery. If your internal data is housed in these environments, you can query it directly. If your database is behind a firewall, you will need to whitelist Google's IP addresses to allow the connection.
How secure is the data in Looker Studio?
Data security relies on Google's cloud infrastructure. Looker Studio is not a data warehouse; in most setups it queries your sources when a report is viewed (with caching), while extracts keep a limited snapshot. You can tightly control access using Google Workspace permissions, ensuring only specific email addresses can view or edit the reports.
What is the difference between Looker and Looker Studio?
Looker is a paid, enterprise-grade business intelligence platform built around a modeling layer (LookML) that data teams usually set up and maintain. Looker Studio is the free, drag-and-drop visualization tool intended for individual users and small to medium businesses who need quick reporting without engineering overhead.
Where to Start Right Now
Taking the first step with data visualization can feel daunting. Your immediate action depends entirely on your current situation.
If you are in a situation where you have nothing set up and rely entirely on gut feelings, your first step is to simply create a Google account and connect Google Analytics to a blank Looker Studio canvas. Do not worry about design; just pull your total website traffic into a single scorecard to establish a baseline of visibility. This single action breaks the inertia of not tracking data.
If you already have data but it is fragmented across ten different platform logins, your first step is to list all your critical metrics on a piece of paper and identify the free connectors available in Looker Studio. Choose just two platforms, such as Google Ads and Google Search Console, and connect them onto one page to experience the value of unified reporting without getting overwhelmed by complex blending setups.
If you have implemented dashboards before but are not measuring their impact on your business decisions, your first step is to schedule a weekly automated email delivery of your most important dashboard directly to your decision-makers' inboxes. By forcing the data into their regular workflow, you shift the tool from being a passive repository to an active driver of strategic conversations. Understanding exactly what looker studio is allows you to transform raw data into a decisive competitive advantage.
About the author

Builder of Orova
Nguyễn Đỗ Trọng Ân has 8 years of experience in marketing, including 6 years managing market development across Asia. He builds Orova, a Biz AI Agent that never sleeps: it plans, runs and optimizes work for businesses.
Run your business with AI Agents
Orova is the always-on Biz AI Agent — it plans, runs, and optimizes the work for you.
Save time, unlock productivity.