
Analysis Instagram: how to audit your account in 7 steps (2026)

Executing a structured analysis instagram audit is the most effective way to transform vanity metrics like follower counts into compounding organic reach and revenue. By the end of this guide, you will possess a complete 90-day performance baseline, an automated content scoring sheet, a decoded Reels retention diagnostic, and a repeatable weekly audit routine that eliminates content guesswork.
Before beginning, ensure you have an active Instagram Creator or Business account, administrative access to desktop Meta Business Suite, Google Analytics 4 connected to your website, and approximately 45 minutes of focused working time. If you manage a strictly personal profile with no desire to grow an audience, build brand equity, or drive business conversions, you do not need to follow this guide.
What Is an Analysis Instagram Audit and Why It Matters in 2026
An analysis instagram audit is the systematic evaluation of your account distribution, content engagement quality, and audience behavior to uncover what drives business growth. The complete workflow spans seven steps and takes roughly 45 minutes to set up, unlocking predictable organic distribution instead of blind posting.
At its core, professional Instagram analysis looks past surface vanity metrics such as total follower count. Instead, it examines algorithmic ranking signals: the ratio of non-follower reach, completion rates on short-form video, active saves, direct message shares, and qualified website referrals. Without regular diagnostic audits, social media managers risk pouring production hours into creative formats that Meta algorithms quietly suppress.
Prerequisites to Prepare Before Starting Your Instagram Analysis
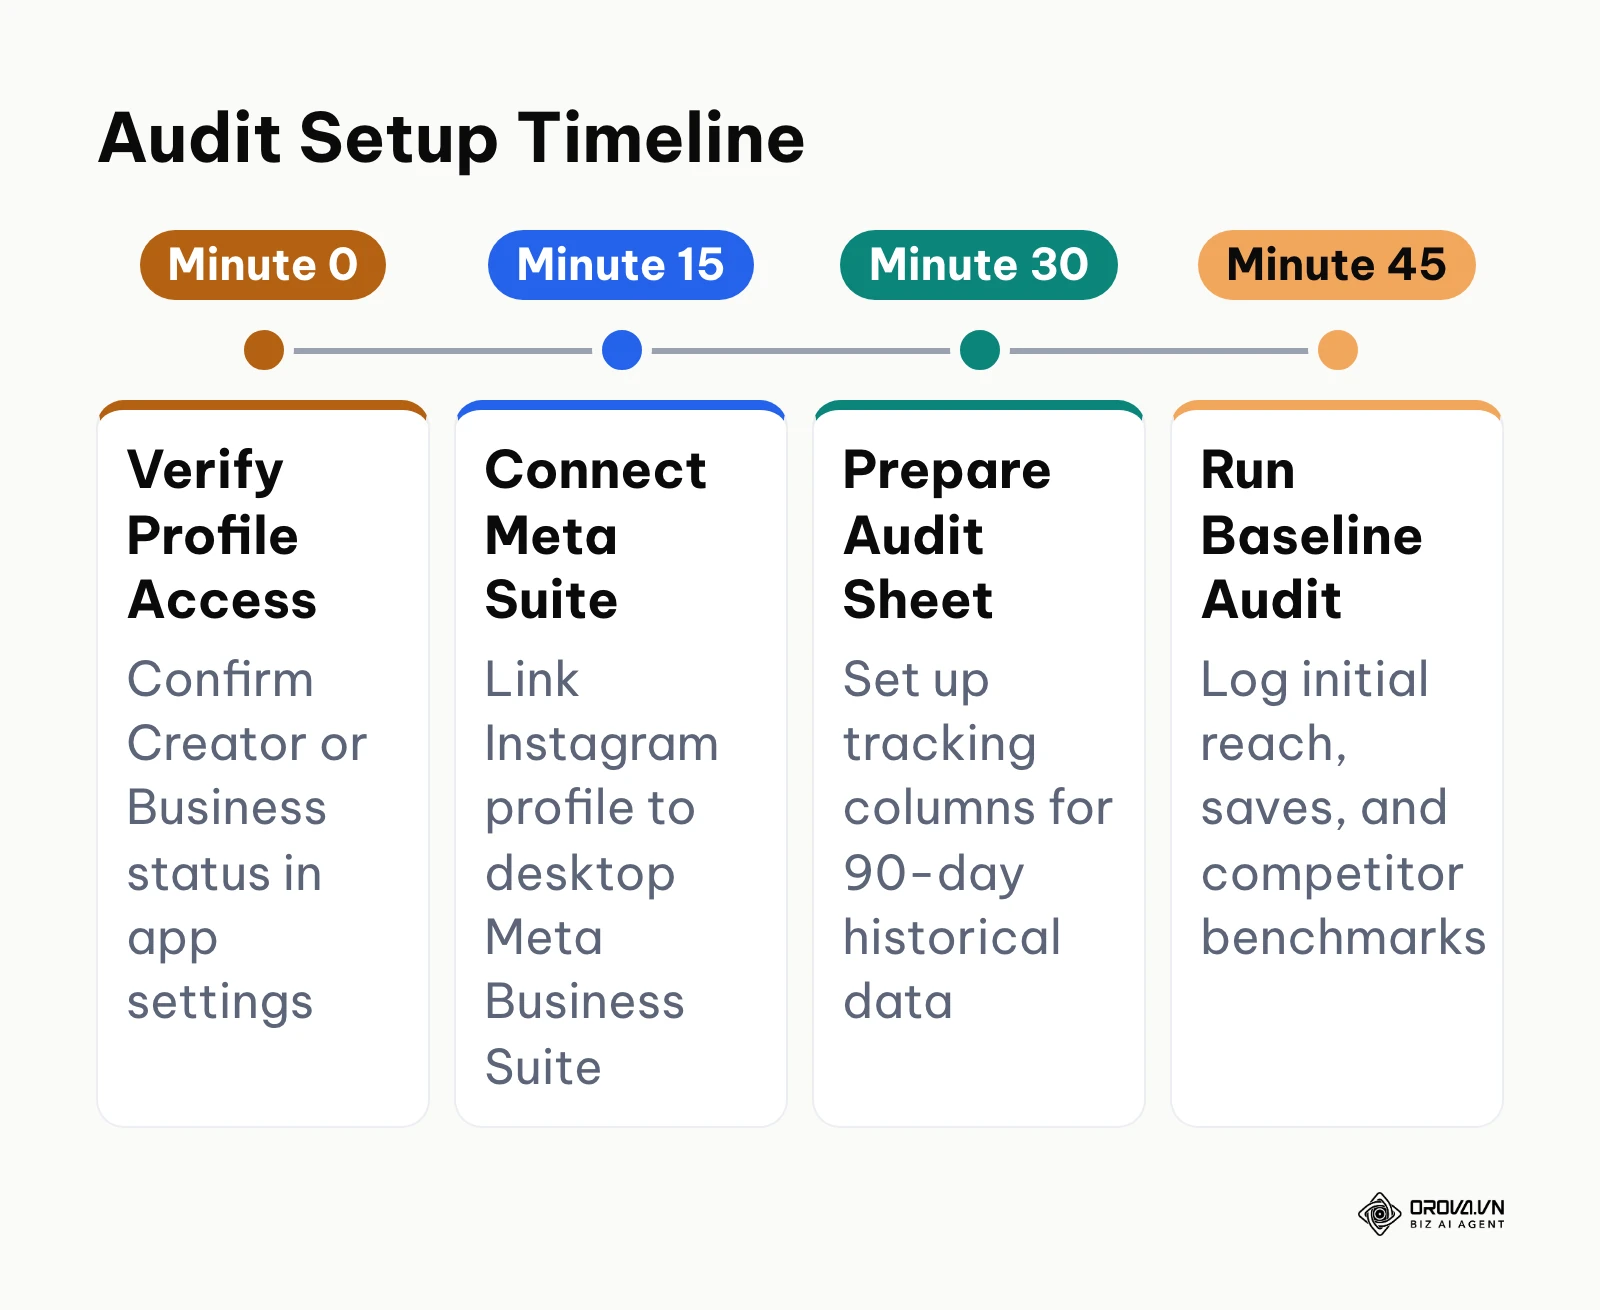
Before diving into native dashboards, gather your analytical assets. Attempting to audit your channel without baseline access credentials or attribution parameters leads to fragmented observations that fail to inform strategic decisions. The timeline below summarizes the initial setup milestones before you review data.
| Prerequisite Item | Where to Retrieve It | Estimated Setup Time | Consequence If Missing |
|---|---|---|---|
| Instagram Professional Profile | Mobile app: Settings and privacy > Account type and tools | 2 minutes | Native Insights remain completely inaccessible on personal accounts. |
| Meta Business Suite Access | business.facebook.com via desktop browser | 5 minutes | Cannot export detailed CSV rows or view long-term retention curves. |
| Google Analytics 4 Property | analytics.google.com > Reports > Traffic acquisition | 10 minutes | Cannot measure referral traffic, conversions, or revenue from bio links. |
| Spreadsheet Audit Template | Google Sheets or Microsoft Excel | 15 minutes | Cannot calculate weighted engagement rates or compare cross-post trends. |
| Meta Ad Library Bookmark | facebook.com/ads/library | 1 minute | Inability to separate competitor organic engagement from paid ad spend. |
Ensure your desktop browser is logged into the Meta Business Manager profile connected to your primary Instagram account before proceeding to Step 1.
Step 1: Switch to a Professional Account and Audit Account Status for Instagram Analysis
The primary objective of this step is to unlock professional analytics and confirm that your profile is fully eligible for algorithmic distribution.
Accessing Professional Settings and Verifying Profile Type
To access your settings, open the Instagram mobile app, navigate to your profile tab, and tap the hamburger menu (three horizontal lines) in the upper right corner. Scroll down to the section labeled "For professionals" and tap "Account type and tools". If your account is currently personal, select "Switch to professional account", choose between "Creator" (best for personal brands, influencers, and solo content producers) or "Business" (best for retailers, local services, and multi-member organizations), and follow the on-screen category prompts.
Once switched, return to the main menu and scroll to "More info and support". Tap Account Status (the shield icon). This screen displays your standing across four operational criteria: Removed content, What can't be recommended, Features you can't use, and Monetization.
Visual Verification and Error Handling
You know this step is completed correctly when your profile displays the "Professional dashboard" button directly below your bio, and your Account Status screen displays green checkmarks across all four operational categories.
A common error at this stage occurs when an account displays an orange warning badge under "What can't be recommended". This indicates that past content violated Meta community guidelines, preventing your posts from appearing on the Explore page or Reels recommendation feeds. To resolve this, tap into the flagged item, read the specific guideline cited, and either tap "Delete post" or submit an in-app request for review if the post was flagged in error.
Step 2: Establish Baseline Metrics and Industry Benchmarks in Your Instagram Analysis
The objective of this step is to establish your trailing 90-day baseline numbers and compare them against realistic industry standards rather than platform-wide averages.
Extracting 90-Day Metrics in Meta Business Suite
Open Meta Business Suite on your desktop, select your Instagram profile in the top-left dropdown, and click Insights in the left sidebar menu. In the date range selector at the top right, choose "Last 90 days". Record five core foundational metrics in your spreadsheet: Total Accounts Reached, Accounts Engaged, Total Content Interactions, Non-Follower Reach Percentage, and Net Follower Growth Rate.
Next, compute your baseline Engagement Rate by Reach (ERR). Avoid calculating engagement against total followers, as follower counts contain inactive users and bot profiles that distort performance reality. Use this standard formula: divide total interactions (likes, comments, saves, and shares) by total reach, then multiply by 100.
According to the Social Media Industry Benchmark Report (2024) by Rival IQ, the median Instagram engagement rate across all industries was 0.43% per post. Note that Rival IQ divides by followers, not reach, so that figure is not directly comparable with the reach-based rate you calculate here. Results also vary widely by vertical and follower tier. The matrix below gives illustrative starting targets for engagement rate by reach (not published benchmarks); replace them with the real numbers you collect from three peer accounts in Step 5.
| Industry Sector | Follower Tier | Illustrative Engagement Rate by Reach | Illustrative Saves-to-Reach Target |
|---|---|---|---|
| B2B / SaaS / Professional | Nano (<10k) | 4.2% – 6.5% | 1.2% – 2.0% |
| B2B / SaaS / Professional | Micro (10k–50k) | 2.5% – 3.8% | 0.8% – 1.4% |
| B2B / SaaS / Professional | Mid-tier (50k–200k) | 1.4% – 2.2% | 0.5% – 0.9% |
| B2B / SaaS / Professional | Macro (>200k) | 0.8% – 1.3% | 0.3% – 0.6% |
| Fashion & Apparel | Nano (<10k) | 3.8% – 5.4% | 0.6% – 1.1% |
| Fashion & Apparel | Micro (10k–50k) | 2.1% – 3.2% | 0.4% – 0.8% |
| Fashion & Apparel | Mid-tier (50k–200k) | 1.2% – 1.9% | 0.3% – 0.5% |
| Fashion & Apparel | Macro (>200k) | 0.7% – 1.1% | 0.1% – 0.3% |
| Food & Beverage | Nano (<10k) | 5.1% – 7.8% | 1.5% – 2.5% |
| Food & Beverage | Micro (10k–50k) | 3.2% – 4.6% | 1.0% – 1.8% |
| Food & Beverage | Mid-tier (50k–200k) | 1.8% – 2.7% | 0.6% – 1.2% |
| Food & Beverage | Macro (>200k) | 1.0% – 1.5% | 0.4% – 0.7% |
| Education & Coaching | Nano (<10k) | 4.8% – 7.2% | 1.8% – 3.0% |
| Education & Coaching | Micro (10k–50k) | 2.9% – 4.4% | 1.2% – 2.2% |
| Education & Coaching | Mid-tier (50k–200k) | 1.6% – 2.5% | 0.8% – 1.5% |
| Education & Coaching | Macro (>200k) | 0.9% – 1.4% | 0.5% – 0.9% |
| Beauty & Cosmetics | Nano (<10k) | 4.0% – 5.9% | 0.8% – 1.5% |
| Beauty & Cosmetics | Micro (10k–50k) | 2.4% – 3.5% | 0.5% – 1.0% |
| Beauty & Cosmetics | Mid-tier (50k–200k) | 1.3% – 2.0% | 0.3% – 0.6% |
| Beauty & Cosmetics | Macro (>200k) | 0.8% – 1.2% | 0.2% – 0.4% |
| Real Estate & Property | Nano (<10k) | 3.5% – 5.0% | 0.7% – 1.3% |
| Real Estate & Property | Micro (10k–50k) | 1.9% – 2.8% | 0.4% – 0.8% |
| Real Estate & Property | Mid-tier (50k–200k) | 1.0% – 1.6% | 0.2% – 0.5% |
| Real Estate & Property | Macro (>200k) | 0.5% – 0.9% | 0.1% – 0.3% |
Visual Verification and Error Handling
You have completed this step when your spreadsheet contains your verified 90-day baseline figures placed alongside the benchmark range for your vertical and follower tier.
A common pitfall is calculating engagement using raw follower counts exported from legacy tools. If your spreadsheet returns an engagement rate below 0.2%, double-check your denominator: replace follower count with total unique accounts reached to reveal your true audience responsiveness.
Step 3: Decode Reels Retention Graphs and Watch Time in Instagram Analysis
The objective of this step is to dissect the exact drop-off moments within your vertical video content to optimize opening hooks and editorial pacing.
Decoding the Reels Retention Graph: 3-Second Hooks and 15-Second Pacing
In the Instagram mobile app, open any Reel published in the last 30 days, tap the three dots icon, and select View Insights. Scroll past the initial interaction counts to the section titled Retention graph. The diagram below illustrates how viewer drop-off curves separate high-performing videos from stagnant ones.
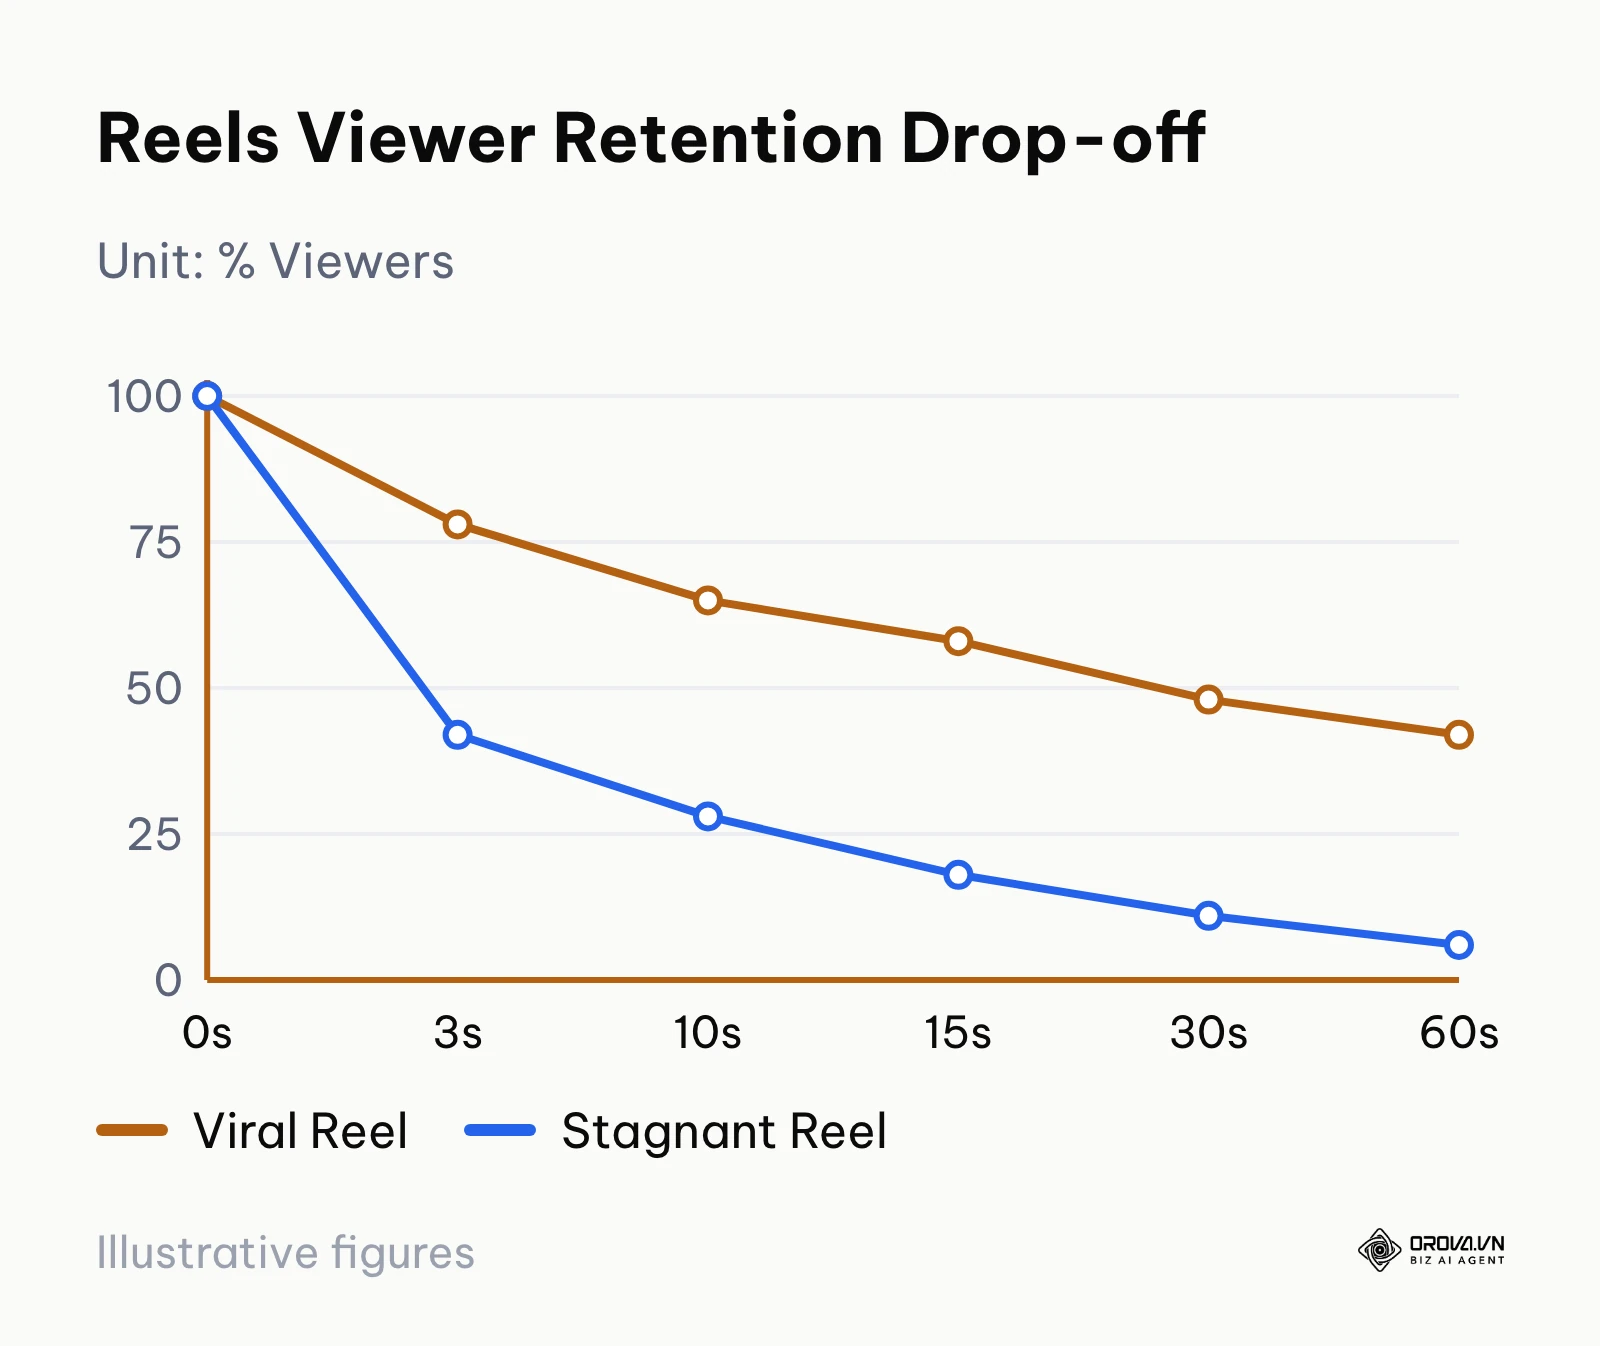
The horizontal axis represents video duration in seconds, while the vertical axis shows the percentage of viewers still watching. Focus your audit on two critical inflection points:
- The 3-Second Hook Point: Meta's creator guidance repeatedly stresses that the first seconds of a Reel decide whether people keep watching. Compare the 3-second point across your own Reels: if one curve falls much faster than your account average in the first three seconds, the visual hook or opening audio failed to stop the scroll.
- The 15-Second Pacing Drop: A steep drop around 12 to 15 seconds indicates structural narrative fatigue. Common causes include unedited pauses, slow verbal explanations, or a static visual frame lacking cuts or b-roll transitions.
Optimizing Watch Time and Rewatch Loops
Scroll further down in the Reel insights panel to locate Average watch time and Total watch time. If your average watch time exceeds 85% of total video length, or surpasses 100% (indicating repeat loops), the algorithm registers intense viewer interest.
Next, calculate your Shares-to-Reach Ratio by dividing total shares by total reach. Instagram has said publicly that sends (shares by direct message) are one of the strongest signals for reaching people who do not follow you yet. Track the ratio over time and compare each Reel against your own median: the Reels with the highest Shares-to-Reach ratio are usually the ones that pull the most non-follower reach.
Illustrative example:
- Context: A B2B software consultancy with 14,200 followers managed by a solo content lead.
- Steps taken: The lead exported 30 days of Reels retention data from Meta Business Suite, isolated the 3-second drop-off points across 12 product breakdown clips, and restructured the first two seconds by replacing the static logo bumper with an on-screen problem statement while trimming verbal breath pauses.
- Roadblock and fix: Retention at the 3-second mark initially remained depressed because the on-screen caption was too small to read on mobile viewports. The lead increased font size by 30% and applied high-contrast background banners to the text overlays.
- Tangible visual result: The retention curve on subsequent videos flattened visibly, sustaining 68% viewer retention at second 3 on the Meta Business Suite graph compared to the earlier 34% drop-off line.
Visual Verification and Error Handling
You know this step is complete when you have cataloged the 3-second retention percentage and average watch time for your top ten and bottom ten Reels over the past quarter. Use a simple log like the one below; the first row is an illustrative example:
| Reel (date and topic) | Length | 3-Second Retention | Average Watch Time | Shares-to-Reach | Next Action |
|---|---|---|---|---|---|
| 12 May, pricing myth | 28s | 68% | 19s | 2.1% | Keep the hook, cut the pause at 14s |
A frequent error is evaluating Reels purely on total views. A Reel with 50,000 views driven by broad non-targeted audio might exhibit a 15% completion rate and zero profile visits, yielding negligible brand value. Always treat completion percentage and shares as primary success indicators over gross play counts.
Step 4: Evaluate Feed Posts and Carousels for Instagram Analysis
The objective of this step is to evaluate static image and carousel performance using a weighted formula that prioritizes active intent over passive consumption.
Weighted Post Scoring Model for Accurate Content Ranking
Standard engagement formulas treat a passive double-tap like identically to an intentional bookmark save or direct message share. In reality, modern recommendation systems heavily weight saves and shares as high-intent utility signals.
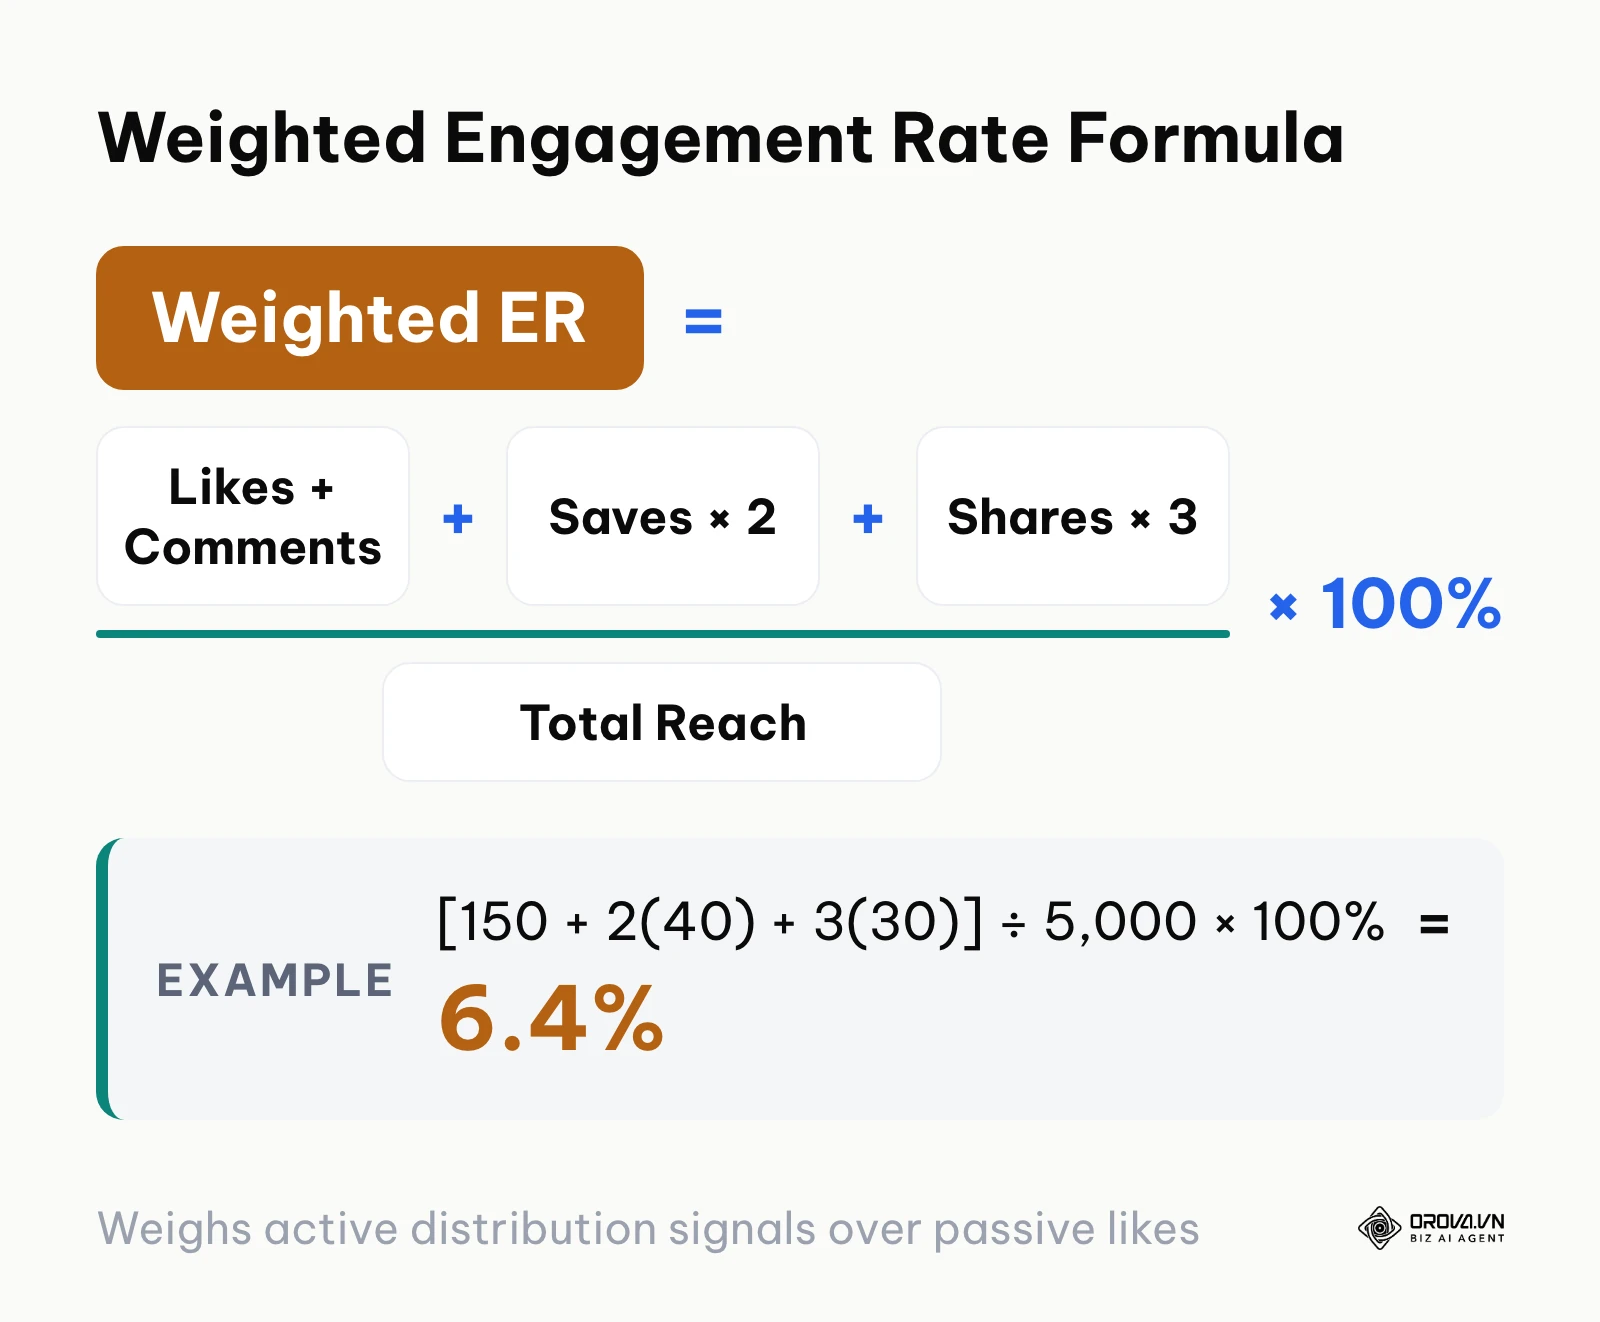
To reflect this reality, implement a weighted scoring model inside your tracking sheet. The formula below calculates your custom weighted engagement metric.
In your spreadsheet, configure the following formula for each post row:
=(([Likes] + [Comments]) + (2 * [Saves]) + (3 * [Shares])) / [Reach] * 100
Assigning a multiplier of 2 to saves and 3 to shares rewards content that viewers either preserve for future reference or distribute within their private networks. Worked example: a post with 150 likes and comments combined, 40 saves, 30 shares and a reach of 5,000 scores (150 + 2 × 40 + 3 × 30) ÷ 5,000 × 100 = 320 ÷ 5,000 × 100 = 6.4%. The weights are a starting point, not an official Meta formula; keep them identical across posts so the ranking stays comparable.
Carousel Slide Fatigue and Swipe-Through Velocity
Carousels offer a unique behavioral metric: swipe-through depth. Navigate to Meta Business Suite > Insights > Content, filter by "Carousels", and examine interaction density.
If your carousels generate substantial initial impressions but low saves, inspect your penultimate and final slides. High-performing educational carousels distribute concise, high-value summaries across slides 7, 8, and 9, accompanied by a direct call to action reminding readers to bookmark the resource.
Illustrative example:
- Context: An indie skincare brand with 48,000 followers led by an in-house social media manager.
- Steps taken: The manager conducted a 90-day content audit classifying 45 feed posts into educational carousels, static product shots, and customer testimonials, then calculated the weighted engagement score for each format in a tracking sheet.
- Roadblock and fix: Carousels generated high total impressions but low saves because educational takeaways were buried in caption text rather than visualized on slides. The manager reformatted slides to display step-by-step ingredient combinations directly on slides 3 through 7.
- Tangible visual result: The post insights tab displayed a surge in the bookmark icon count, shifting average saves per post from 22 to 145 on educational carousel entries.
Visual Verification and Error Handling
This step is verified once your content audit sheet ranks all historical feed assets by Weighted Engagement Rate, highlighting your top 10% highest-yield assets.
A common issue occurs when older posts show missing reach metrics in third-party spreadsheets. This happens when accounts disconnect their Facebook Page link. If reach shows as zero, re-authenticate your Meta Business Suite credentials under Business Settings > Data Sources to restore historical API data pulls.
Once you identify high-performing content formats through audit data, scaling production becomes the next hurdle. Orova Social simplifies multi-platform distribution by letting you compose once and publish across 8 channels simultaneously. Use AI caption writing in your brand voice, generate on-brand visuals, and organize your release cadence on a day, week or month content calendar. Start optimizing your publishing workflow today.
Step 5: Uncover Competitor Tactics and Ad Strategy for Instagram Analysis
The objective of this step is to benchmark your content formats against direct industry peers while filtering out artificial reach generated by paid advertising campaigns.
The 4-Step Competitor Benchmarking Framework
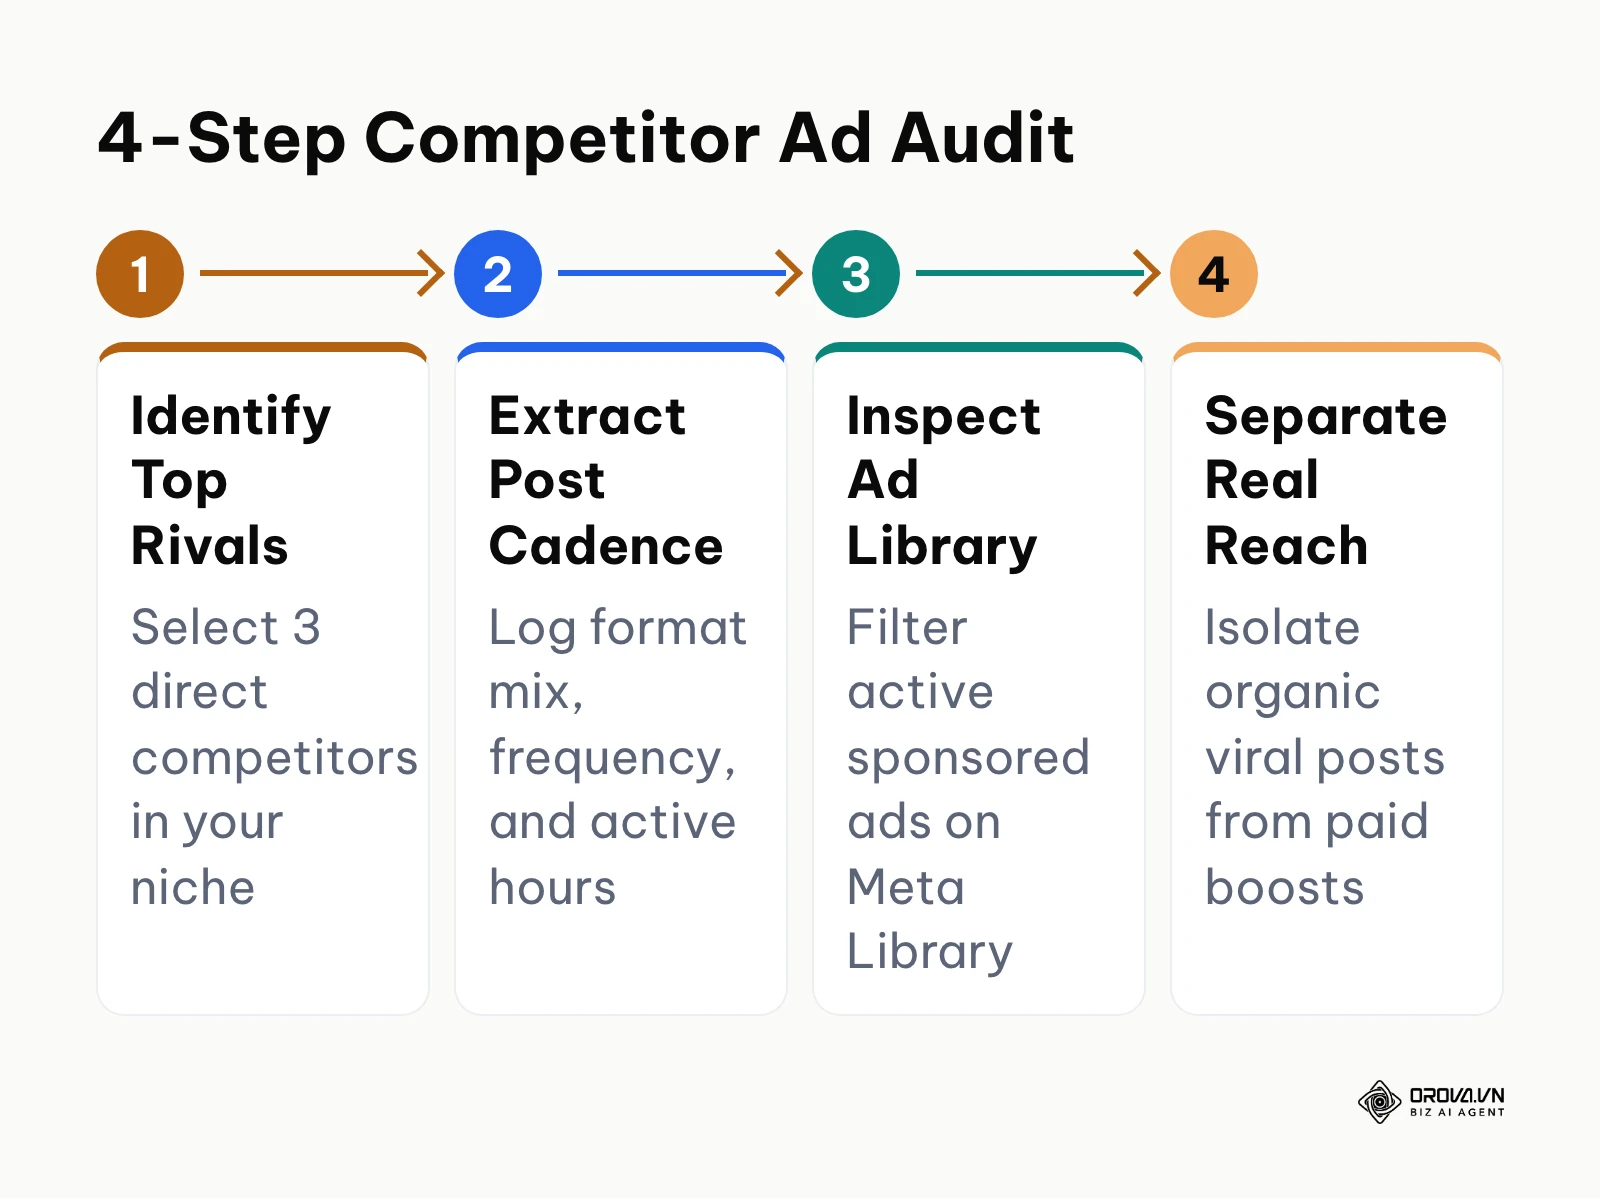
Auditing competitors provides context on formatting opportunities and audience expectations in your niche. Follow this 4-step framework:
- Select Three Direct Peers: Choose three active competitor accounts operating within your vertical and sharing a similar follower tier (avoid comparing a 10,000-follower account against a 5,000,000-follower global conglomerate).
- Catalog Posting Frequency and Cadence: Over a 30-day window, record their weekly posting volume, format split (percentage of Reels, Carousels, and single images), and active publishing windows. You can streamline this workflow by studying an established competitor site analysis framework to structure your competitive intelligence data.
- Calculate Public Engagement Rates: Because private reach is inaccessible on competitor profiles, calculate Public Engagement Rate (PER) across their last 12 organic posts: sum total likes and visible comments, divide by total follower count, and multiply by 100.
- Identify Format Outliers: Pinpoint posts achieving 2x to 3x their median public engagement. Examine the hook, structural pacing, audio track, and caption copywriting to determine what triggered viral distribution.
Unmasking Paid Ads with Meta Ad Library
A critical mistake in competitor analysis is attempting to replicate a competitor post that achieved massive engagement, unaware that thousands of dollars in ad spend fueled its reach.
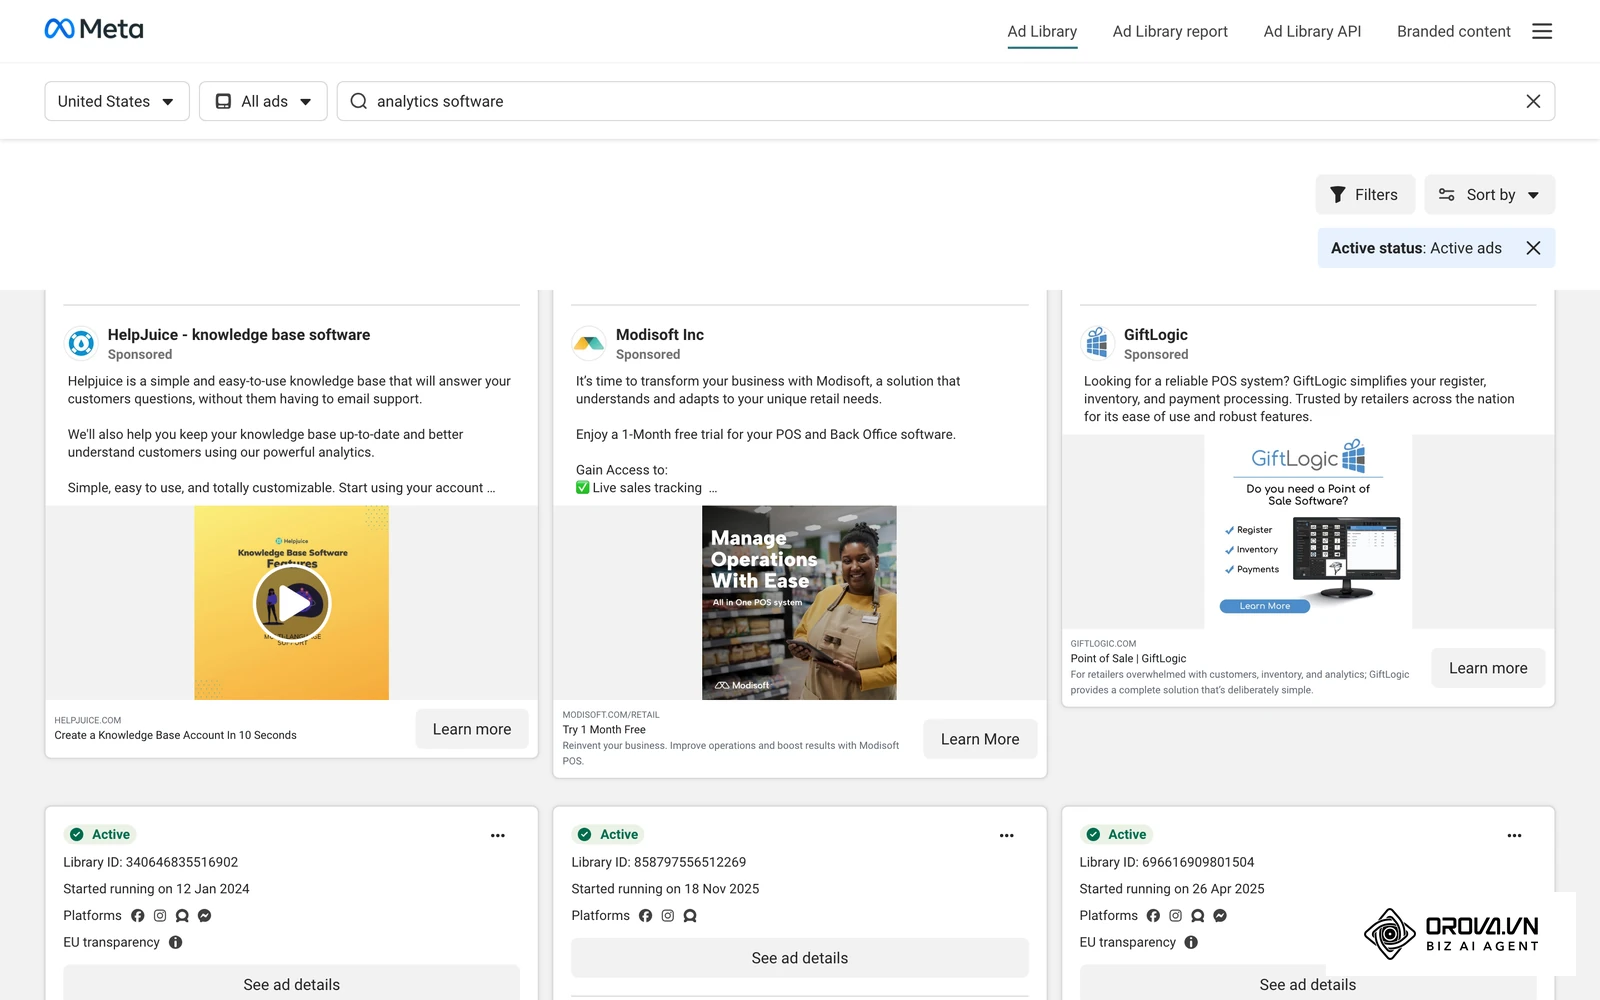
To verify whether a competitor post is organic or sponsored, open your browser and navigate to facebook.com/ads/library. In the search parameters, select "All Ads", set the country filter to "All", and enter the competitor's exact Instagram handle or brand name in the search bar.
Review their active ad inventory. If the viral post you observed on their grid appears in the Ad Library with an active status, its reach is heavily subsidized by paid ad spend. Isolate their purely organic posts to discern which creative concepts genuinely succeed without financial backing.
Visual Verification and Error Handling
You have completed this step when you possess a comparative dossier documenting three competitors, their organic post frequencies, estimated public engagement benchmarks, and an inventory of their active Meta ad creatives.
A frequent error is searching the Ad Library using an informal brand name rather than their verified Meta Page name. If search returns "No results found", check the competitor's Instagram profile bio or "About this account" menu to confirm the official legal entity name linked to their Meta advertising account.
Step 6: Track Traffic and Direct Conversions from Instagram Analysis
The objective of this step is to attribute qualified website visitors, leads, and transaction revenue back to specific Instagram content touchpoints.
Solving the Dark Social Attribution Dilemma
A pervasive tracking challenge is "dark social" attribution: users view a Reel or Story on mobile, do not click the link immediately, and later open a desktop browser or mobile Safari to search for your brand directly on Google. In standard analytics, these high-intent buyers appear under "Direct" or "Organic Search" rather than Instagram referral traffic.
To measure real impact, implement a multi-layered tracking protocol combining custom UTM campaign parameters, link-in-bio click analytics, and post-purchase customer attribution surveys.
Setting Up UTM Tags and GA4 Conversion Events
Never use generic website URLs in your Instagram bio link or Story link stickers. Use Google Campaign URL Builder to attach structured parameters:
- utm_source=instagram
- utm_medium=social_bio (or social_story, social_dm)
- utm_campaign=spring_audit_2026
- utm_content=reel_carousel_hook
In Google Analytics 4, navigate to Reports > Acquisition > Traffic acquisition. Filter the session source/medium table by instagram / social_bio and analyze session engagement rate, average engagement time, and event counts for primary conversion goals (such as form submissions or purchases).
Visual Verification and Error Handling
This step is verified when GA4 traffic acquisition reports display distinct rows for your tagged Instagram UTM campaigns, with recorded conversion events matched to inbound social sessions.
A common tracking breakdown occurs when external redirect services (short link tools) strip UTM parameters during the redirect chain. Always test your bio link by clicking it on a mobile device and verifying that the final landing page address bar preserves the full ?utm_source=instagram query string.
Step 7: Troubleshoot Sudden Reach Drops in Your Instagram Analysis
The objective of this step is to systematically diagnose and remediate sudden 50%+ drops in account reach using a standardized recovery protocol.
The 6-Step Drop Reach Troubleshooting Protocol
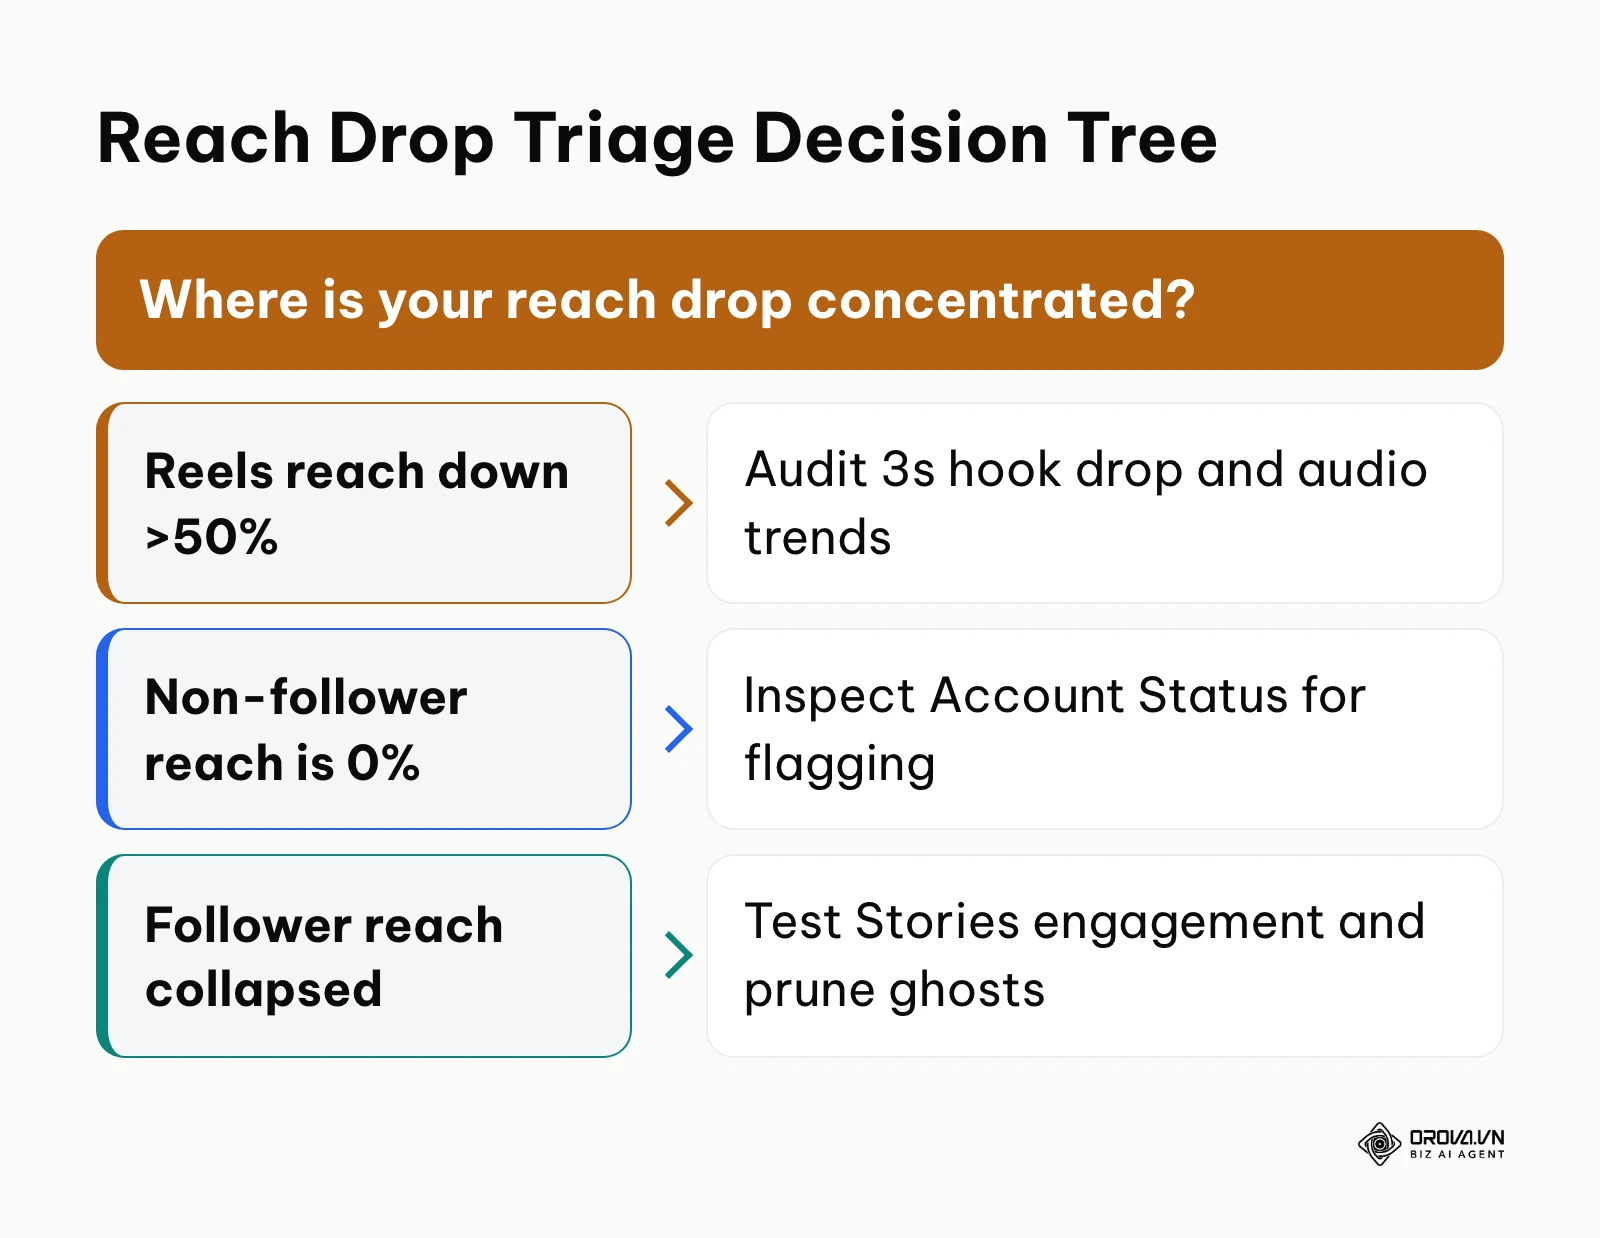
When your 30-day reach drops abruptly, avoid panicking or deleting your entire content library. Follow this diagnostic checklist:
- [ ] Step 1: Check In-App Account Status. Open Instagram Settings > Account Status. Verify all categories show green checkmarks. If non-follower recommendation is restricted, identify the flagged post and request a review or delete it immediately.
- [ ] Step 2: Isolate the Drop by Surface. In Meta Business Suite Insights, determine whether the decline affects Reels, Stories, or Feed Posts. A drop isolated entirely to Reels indicates hook or retention fatigue; a sitewide drop across all surfaces suggests distribution restrictions.
- [ ] Step 3: Audit Non-Follower Reach Ratio. Check your 30-day reach composition. If non-follower reach fell from 40% to 0%, the algorithm has restricted your content from recommendation feeds (Explore and Reels tab).
- [ ] Step 4: Check for Hashtag and Audio Flags. Ensure you are not repeatedly pasting identical blocks of 30 hashtags, which triggers automated spam filters. Inspect recent posts to verify licensed audio tracks have not been muted for regional copyright violations.
- [ ] Step 5: Inspect Follower Quality and Ghost Spikes. Review recent followers. If a sudden surge of automated bot profiles occurred (often following low-quality giveaways), engagement ratios will plummet because bots do not interact with new posts.
- [ ] Step 6: Execute a 14-Day Reset Plan. Fix the cause you found in Steps 1 to 5 first. Then publish one high-utility educational carousel and one native Reel every other day for 14 days. Focus entirely on prompts that drive saves and shares. Maintain consistency by preparing content in advance using a dedicated Instagram post scheduler to avoid erratic publishing spikes.
Illustrative example:
- Context: A boutique fitness apparel brand with 85,000 followers overseen by a digital marketing coordinator.
- Steps taken: When non-follower reach plummeted by 62% over two consecutive weeks, the coordinator opened the in-app Account Status menu, inspected the "Content that can't be recommended" tab, and audited the last 20 posts for copyrighted audio and sensitive wellness claims.
- Roadblock and fix: Three Reels had been flagged under Meta's sensitive health recommendation guidelines due to unverified statements in on-screen captions. The coordinator submitted in-app review appeals and archived the flagged posts immediately.
- Tangible visual result: The Account Status dashboard switched from an orange warning icon to four green checkmarks, and the non-follower reach percentage in the 30-day Insights overview recovered from 8% back to 47%.
15-Point Monthly Account Health & Algorithm Readiness Checklist
Perform this 15-point check on the first business day of every month. Copy the table into your audit sheet and add a Pass/Fail column for each month:
| # | Check | Where to look | Pass when |
|---|---|---|---|
| 1 | Account Status | Instagram app > Settings > Account Status | All four categories show green checkmarks |
| 2 | Login security | Instagram app > Accounts Center > Password and security | Two-factor authentication is on via an authenticator app |
| 3 | Business Suite connection | Meta Business Suite > Settings | Instagram account is connected and permissions are current |
| 4 | Bio link tracking | Profile bio link | Link opens with full UTM parameters intact |
| 5 | Non-follower reach | Insights > Accounts reached | Share of non-followers at or above last month's level |
| 6 | 3-second Reels retention | Reel insights > Retention graph | At or above your own 90-day average |
| 7 | Shares-to-Reach | Your audit sheet | Stable or rising month over month on top posts |
| 8 | Saves-to-Reach | Your audit sheet | Meets the target you set from peer accounts |
| 9 | Story completion | Insights > Stories | Most viewers reach the final frame |
| 10 | Publishing cadence | Content calendar | Weekly volume deviates by no more than one post |
| 11 | Audio and copyright | Recent Reels and grid posts | No muted audio or copyright warnings |
| 12 | Comment replies | Recent posts under 24 hours old | Most comments answered within a day |
| 13 | Follower quality | Recent followers list | Bot or inactive spikes documented and reported |
| 14 | Instagram traffic in GA4 | GA4 > Traffic acquisition | Instagram sessions growing month over month |
| 15 | Learnings applied | Next month's calendar | Top-performing formats are scheduled again |
Visual Verification and Error Handling
You know this step is complete when you have executed the diagnostic checklist, verified Account Status integrity, and logged your monthly health score across all 15 audit criteria.
If reach remains suppressed after clearing Account Status flags, do not delete existing posts in bulk; you lose the historical data your audit depends on. If you want to tidy the grid, archive underperforming content gradually instead.
Master Checklist for Your Instagram Analysis Workflow
The table below compiles the entire 7-step audit workflow into a operational reference table. Print or duplicate this table into your workspace to execute routine monthly audits.
| Step Number | Core Analytical Task | Visual Completion Signal | Estimated Time |
|---|---|---|---|
| Step 1 | Audit Professional Profile and Account Status | Professional Dashboard active; 4 green checkmarks in Account Status | 5 minutes |
| Step 2 | Establish 90-Day Baseline and Benchmark Metrics | Baseline ERR and saves ratio calculated against industry standards | 10 minutes |
| Step 3 | Dissect Reels Retention Curves and Watch Time | 3-second hook drop logged; Shares-to-Reach ratio calculated | 10 minutes |
| Step 4 | Calculate Weighted Feed and Carousel Performance | Content ranking spreadsheet populated with custom weighted scores | 10 minutes |
| Step 5 | Execute Competitor Audit and Meta Ad Check | Competitor matrix logged; organic posts separated from Ad Library ads | 10 minutes |
| Step 6 | Attribute Traffic and Conversions via GA4 | GA4 Traffic acquisition reports displaying filtered UTM campaign sessions | 10 minutes |
| Step 7 | Run Reach Drop Triage and Monthly Health Check | 15-point audit completed; 14-day recovery protocol scheduled if needed | 10 minutes |
Turn audit insights into consistent publishing without spending hours manually uploading content each week. With Orova Social, you can repurpose long-form video into captioned Reels, schedule multi-channel campaigns in minutes, and maintain complete brand consistency across your profiles. The platform is completely free through July 7, 2027. Sign up now and streamline your social workflow with zero credit card required.
Common Mistakes in Instagram Analysis and How to Fix Them
Even experienced marketing teams encounter cognitive biases and technical blind spots when interpreting social metrics. Avoid these widespread mistakes:
| Mistake | Common Operational Cause | Practical Fix |
|---|---|---|
| Chasing Gross Follower Growth | Viewing follower count as primary KPI rather than engaged reach | Pivot monthly reporting to unique accounts reached and qualified conversions. |
| Evaluating Engagement Against Followers | Calculating ERR using follower count rather than unique reach | Update spreadsheet denominators to use unique post reach exclusively. |
| Conflating Views with Completion | Assuming a high view count equates to video retention and message absorption | Prioritize average watch time percentage and 3-second retention graphs. |
| Treating Likes Equally to Saves | Relying on unweighted native interaction summaries | Implement the weighted engagement scoring formula prioritizing saves and shares. |
| Misinterpreting Competitor Ad Virality | Copying competitor posts without verifying paid backing | Search competitor handles in Meta Ad Library to identify sponsored promotions. |
| Ignoring Bio Link UTM Parameters | Relying on default social referral categorization in GA4 | Generate distinct UTM parameters for every bio link, Story sticker, and DM campaign. |
| Panicking During Normal Algorithm Tests | Treating minor week-to-week reach fluctuations as shadowbans | Compare 30-day moving averages rather than reacting to single post variances. |
Once your audit highlights high-converting formats, the challenge shifts to publishing those formats consistently. Two practical next reads: how to write Instagram captions with AI that match the hooks your audit rewarded, and how to manage all social media in one place when the same insights apply to several channels.
How to Measure Success After Your Instagram Analysis Audit
Evaluating the success of your audit process requires tracking operational behavioral changes alongside quantitative outcome metrics. In your spreadsheet, review metrics bi-weekly over 60 days following your initial audit.
First, track your Non-Follower Reach Percentage inside Meta Business Suite Insights (Content > Reach Overview). A successful audit and content adjustment should lift your non-follower share above the baseline you recorded in Step 2 within four to six weeks, as stronger hooks and higher completion rates earn more recommendations.
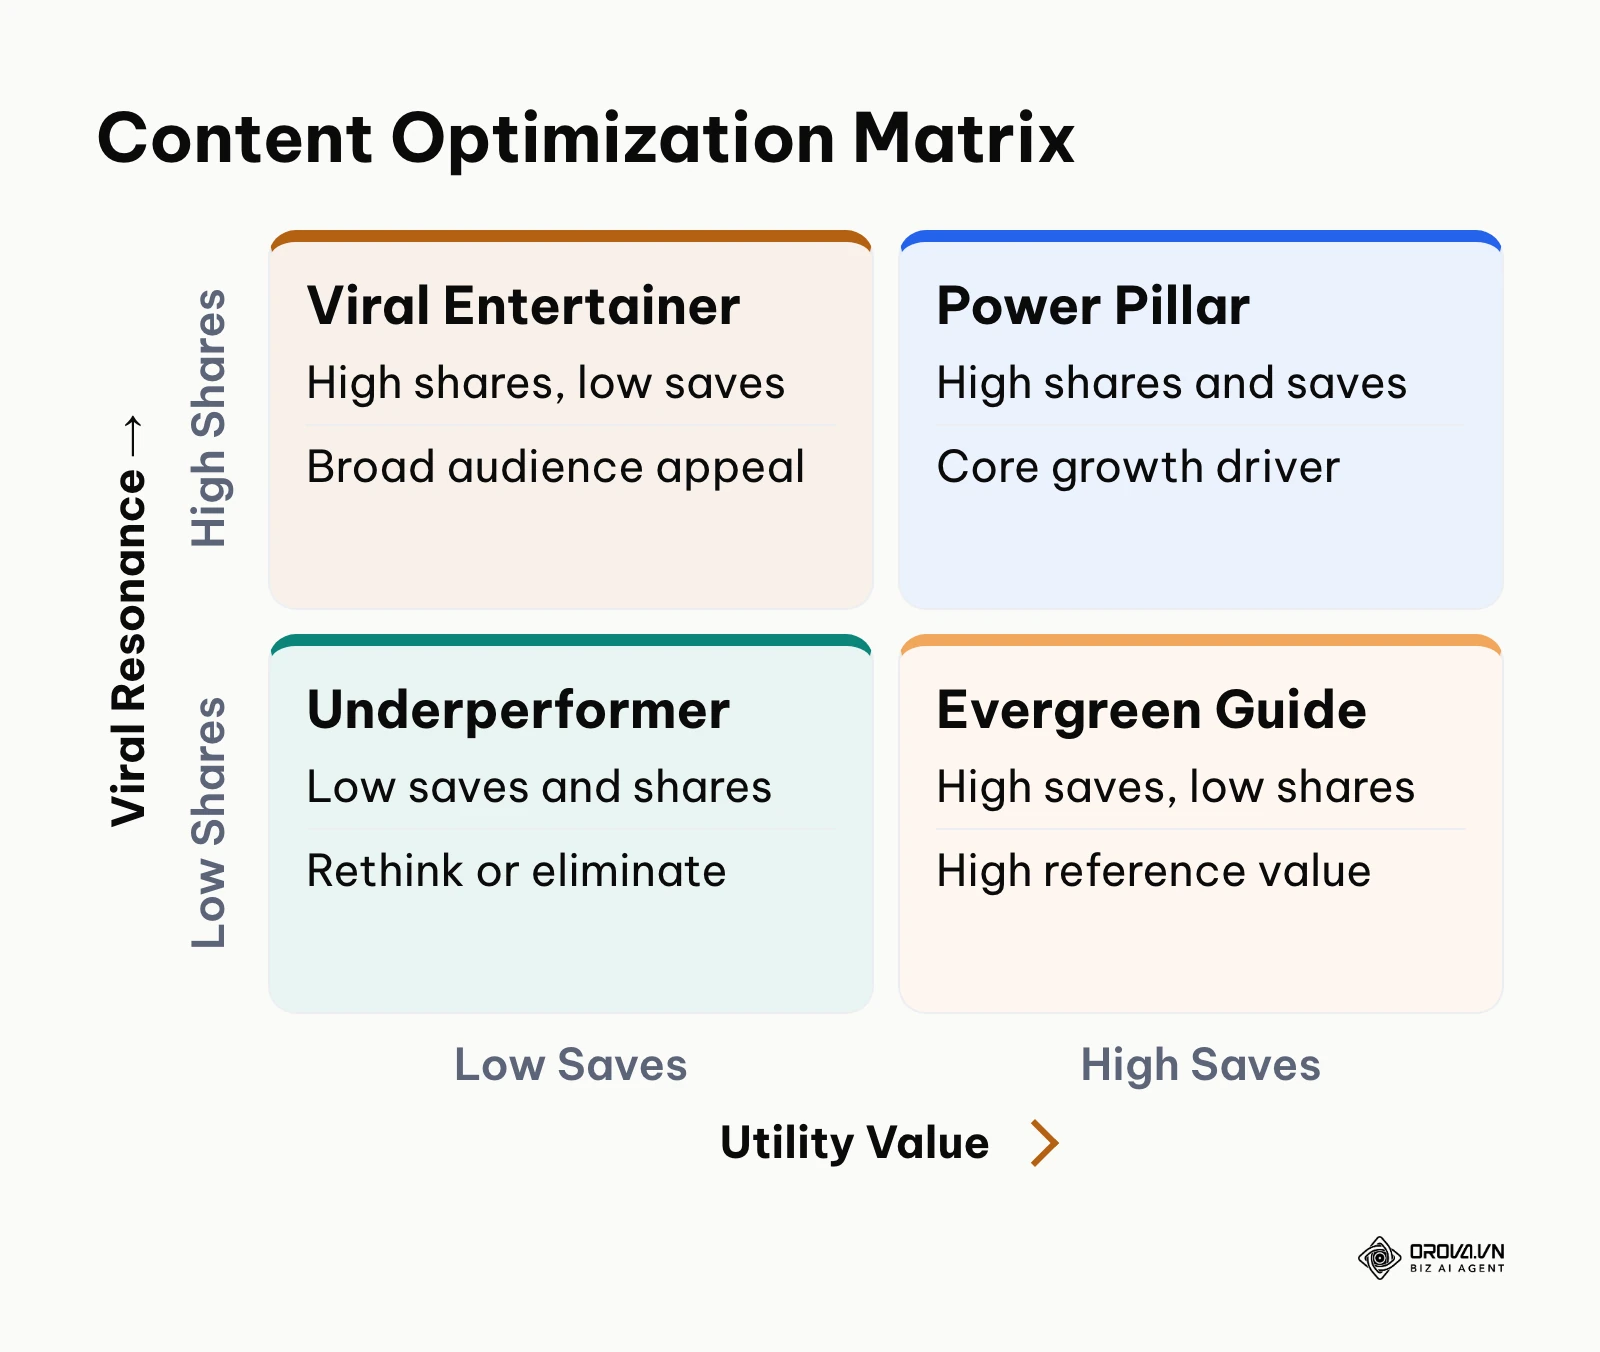
Second, monitor your Saves-to-Reach Ratio on educational carousel and Reel assets. Sustained improvements toward your target confirm your content addresses real audience pain points. To see where each post lands, sort it into one of four quadrants: high shares and high saves (power pillars to produce more of), high shares but low saves (viral entertainers), high saves but low shares (evergreen guides), and low on both (underperformers to rethink or drop).
Third, evaluate Qualified Inbound Traffic in Google Analytics 4 under Traffic acquisition. Growth in engaged sessions originating from your tagged social UTM links demonstrates that your social presence delivers tangible commercial value rather than vanity engagement.
Future Trends in Instagram Analysis: Author's Perspective
Looking at the trajectory of Instagram's architecture as of 2026, social data analysis is shifting fundamentally away from surface vanity metrics toward behavioral semantic modeling. Below are three key structural shifts I anticipate over the coming two to three years.
Semantic Intent and Search Indexing Over Hashtags
Today, we observe Instagram's search bar behaving increasingly like a semantic discovery engine, indexing spoken video transcripts, on-screen text, and caption vocabulary rather than reliance on traditional 30-hashtag blocks. In my view, hashtag metrics will matter less and less as Meta's systems categorize and distribute content based on what is actually said and shown in the post. Marketers should begin optimizing on-screen typography, audio transcript clarity, and precise conversational phrasing today to ensure visibility across algorithmic semantic clusters. Of course, this prediction could slow if Meta prioritizes private direct messaging distribution over public discovery feeds.
Automated Generative AI Content Audits
Currently, teams manually export CSV spreadsheets and build formulas to identify top-performing creative patterns. I believe that over the next few years, social media analysis will lean more and more on AI evaluation tools that ingest full-funnel video streams, identify visual hook fatigue at the frame level, and suggest script variations tailored to specific retention drop points. To prepare, social media managers should focus on developing higher-level data interpretation skills and strategic positioning rather than spending hours manually formatting spreadsheet cells. This shift could face headwinds if platform API restrictions limit access to raw granular frame-level retention data.
Direct Message Privacy and Dark Social Primacy
We are already seeing public comment sections stagnate across mature accounts while private direct message sharing keeps growing. I suspect that over the next few years, public grid engagement rates will keep sliding across most industries, with a growing share of meaningful brand interactions occurring in private DMs and closed group broadcasts. Brands must prepare by building conversational tracking protocols, dedicated DM automation workflows, and community-centric distribution strategies rather than relying exclusively on public feed engagement to judge channel vitality. If Meta decides to deprioritize private messaging in favor of aggressive ad-supported public feed formats, this trend could take longer to materialize.
Frequently Asked Questions About Analysis Instagram
How often should you conduct a comprehensive Instagram analysis?
A standard analysis instagram audit should be executed on two distinct timeframes: a lightweight 15-minute weekly review to monitor post-level retention and identify top performers, paired with a comprehensive 45-minute monthly audit to calculate weighted engagement rates, review GA4 attribution, and perform the 15-point account health check.
What is the most critical metric in Instagram analysis for organic growth?
For organic audience expansion, the two most influential metrics are the 3-second Reels completion percentage and the Shares-to-Reach ratio. Instagram has stated that watch time and sends (shares by direct message) are among the strongest signals for recommending Reels to non-followers, so compare these two numbers against your own account median rather than a universal threshold.
How does AI impact Instagram analysis and content optimization?
AI models accelerate the analysis instagram workflow by automatically scanning historical performance data, isolating script phrasing correlated with high save rates, and detecting visual hook fatigue before engagement drops occur. Creative teams can use AI tools to generate data-driven caption iterations and script variations based on historical audit findings rather than relying on creative guesswork.
Why does my Instagram reach suddenly drop despite high follower count?
Sudden reach drops usually stem from one of three factors: restrictions flagged under in-app Account Status that disqualify content from recommendation feeds, a steep drop in initial hook retention compared with your usual curve, or audience fatigue caused by repetitive posting angles. Review your Account Status first, then analyze non-follower reach percentages to isolate whether the issue is technical or creative.
How do I accurately track website sales from Instagram in Google Analytics 4?
To track direct sales accurately, combine custom UTM campaign tags on all bio and Story links with Google Analytics 4 conversion event tracking. Navigate to GA4 Reports > Acquisition > Traffic acquisition, filter by your specific utm_source=instagram campaign, and analyze session-based conversion rates alongside self-reported customer attribution surveys at checkout.
What is the difference between reach and impressions in Instagram Insights?
Reach measures the total number of unique individual accounts that viewed your content at least once, whereas impressions measure the total number of times your content was displayed on screen, including multiple views by the same user. For accurate performance auditing, always calculate engagement rates using reach as your denominator rather than impressions or total followers.
Where Should You Start Your Instagram Analysis?
Your immediate starting point depends on your current account maturity and tracking infrastructure. Identify which of the three situations matches your current setup:
- If you are a solo creator or founder with no historical tracking: Do not build complex multi-tab spreadsheets today. Your single immediate action is to open the Instagram mobile app, verify that you are on a Creator or Business profile, navigate to Settings > Account Status, and confirm that all four operational categories display green checkmarks. Once confirmed, record your current 30-day reach and non-follower percentage in a simple notepad to establish your day-zero baseline.
- If you are an established brand experiencing stagnant reach or declining engagement: Your immediate focus is creative retention triage. Open Meta Business Suite on desktop, navigate to Insights > Content, filter by Reels over the last 60 days, and inspect the 3-second retention graphs of your five lowest-performing videos. Identify where the opening visual fails to deliver an immediate hook, and rewrite your next three video concepts to introduce the core problem within the first two seconds.
- If you are a marketing agency or team managing multiple client profiles: Your single afternoon milestone is setting up standardized tracking infrastructure. Create a shared master audit spreadsheet containing the weighted engagement formula, establish uniform UTM campaign naming conventions across all client bio links, and schedule a recurring calendar appointment on the first business day of each month to execute the 15-point account health checklist.
Consistent execution of this framework ensures your analysis instagram workflow generates compounding audience growth and measurable revenue.
About the author

Builder of Orova
Nguyễn Đỗ Trọng Ân has 8 years of experience in marketing, including 6 years managing market development across Asia. He builds Orova, a Biz AI Agent that never sleeps: it plans, runs and optimizes work for businesses.
Run your business with AI Agents
Orova is the always-on Biz AI Agent — it plans, runs, and optimizes the work for you.
Save time, unlock productivity.