
Connected TV ads: how to launch a campaign in 7 steps (2026)
Connected TV ads deliver your brand video message directly onto living-room television screens with programmatic targeting and high completion rates, because most streaming ad breaks cannot be skipped. By following this deployment framework, you will configure an active, broadcast-compliant streaming campaign that pairs living-room visual impact with household-level cross-device tracking in Google Analytics 4 (GA4). You will need an active self-serve demand-side platform (DSP) or ad account, an encoded 16:9 master video file meeting broadcast audio specifications, administrative access to your web analytics container, and approximately 5 to 10 business days for technical verification and campaign flighting. If your monthly paid advertising budget is strictly below 1,000 dollars, or your acquisition model relies entirely on single-session direct-response text clicks, standard search and social display campaigns are better suited to your immediate goals.
What Are Connected TV Ads and Why Run Them Today?
Connected TV ads are digital video advertisements served across internet-connected television screens, including Smart TVs (such as Samsung Tizen or LG webOS), streaming devices (Roku, Amazon Fire TV, Apple TV), and gaming consoles. Running them combines the prestige of traditional television with digital audience targeting and real-time frequency management. The complete setup process spans 7 distinct steps and requires approximately one to two weeks from technical encoding to active delivery.
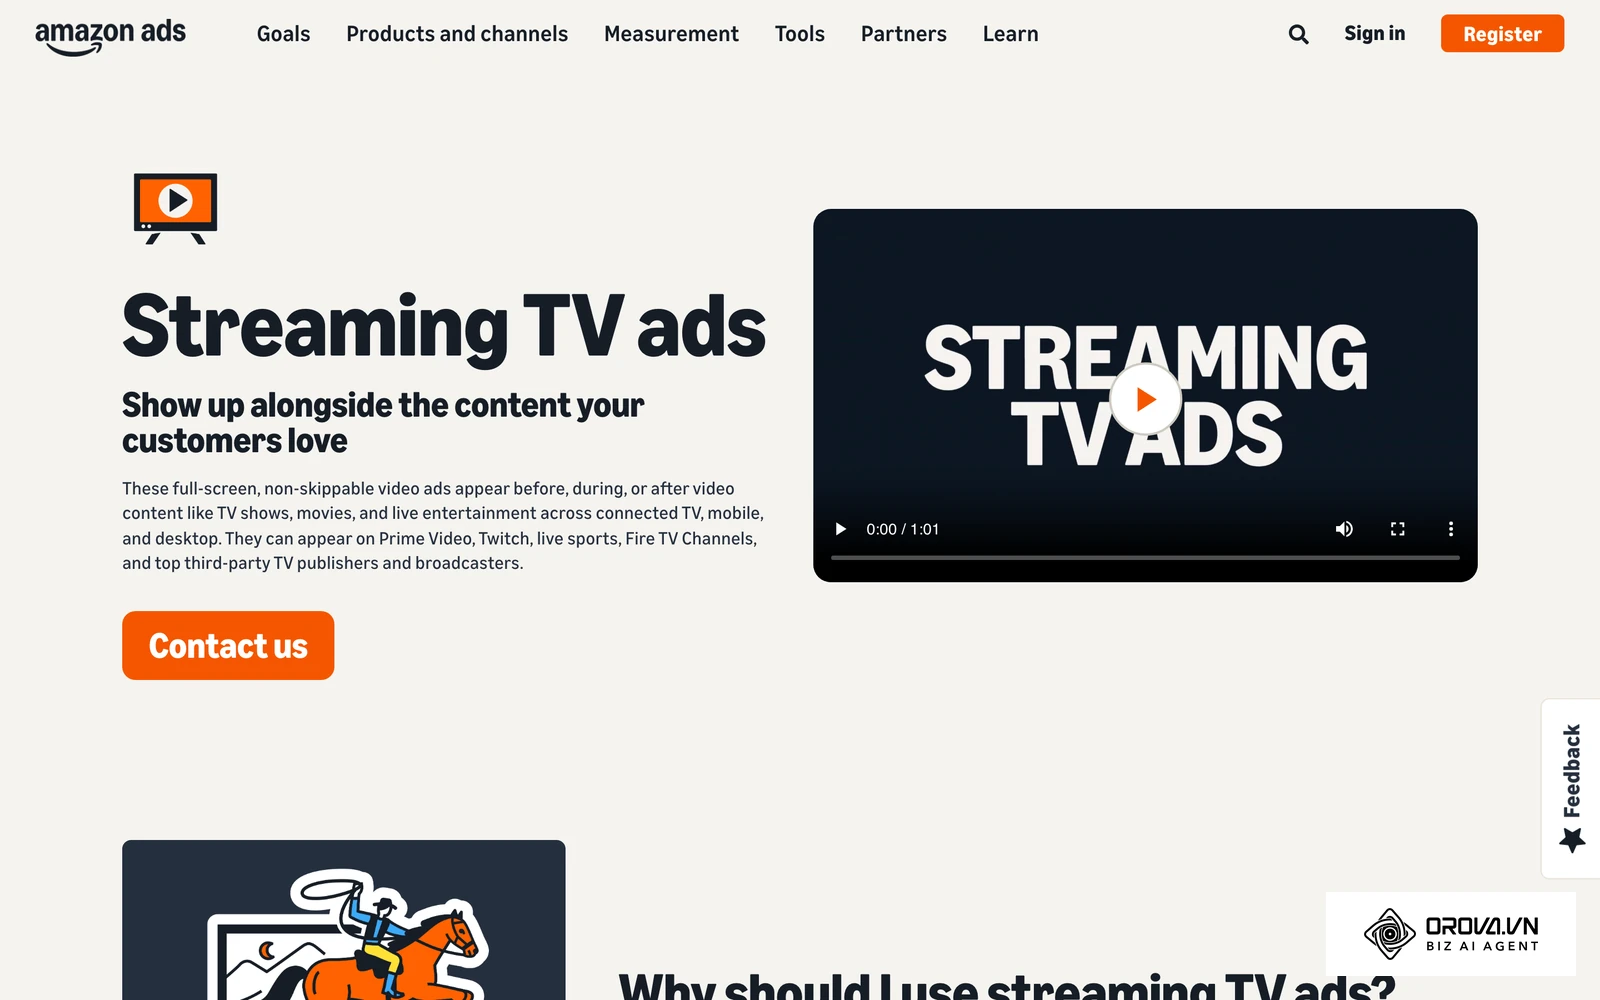
In digital media architecture, Connected TV (CTV) designates the physical television hardware connected to the internet. Over-The-Top (OTT) refers to the content delivery mechanism that bypasses traditional cable or satellite set-top boxes through applications like Hulu, Max, and YouTube TV. Traditional linear TV relies on broad demographic ratings (such as Nielsen age brackets) with fixed commercial breaks bought months in advance during upfronts. In contrast, connected TV ads are procured programmatically per household impression, unlocking digital audience segmentation, verified viewability, and cross-device measurement.
Prerequisites and Preparation Before Launching CTV Campaigns
Before reserving streaming inventory or uploading creative assets, assemble your technical assets and administrative credentials. Missing a single audio specification or household tracking parameter can delay your flight date by weeks due to ad-server rejections.
The table below outlines the necessary prerequisites, their sources, estimated lead times, and the consequences of omitting them.
| Required Item | Source / Requirement | Estimated Time | Impact if Missing |
|---|---|---|---|
| DSP or Ad Platform Account | Google Ads (YouTube CTV), Roku Ads Manager, Amazon DSP, or DV360 | 1–3 business days | Inability to bid on programmatic streaming auctions or access private marketplaces. |
| Broadcast Master Video | Post-production export in ProRes 422 or high-bitrate H.264 (15–30 Mbps) | 2–5 business days | Playback stuttering, pixelation, or outright rejection by streaming ad quality scanners. |
| Audio Loudness Master | Audio mix normalized to -24 LKFS (±1 LKFS) per ATSC A/85 specifications | 2–4 hours | Immediate DSP disapproval under automated sound-level compliance regulations. |
| Shoppable QR Code Asset | Dynamic URL tracking redirect formatted as high-contrast SVG or PNG | 1–2 hours | Inability for viewers to take immediate direct-response actions from their sofas. |
| Attribution Webhooks & GA4 | Google Analytics 4 property and server-side tracking container | 1 business day | Inability to connect living-room impressions with downstream website orders. |
Step 1: Select Your CTV Buying Platform and Allocate Budgets
Select your procurement channel based on your budget tier, technical capability, and target audience distribution.
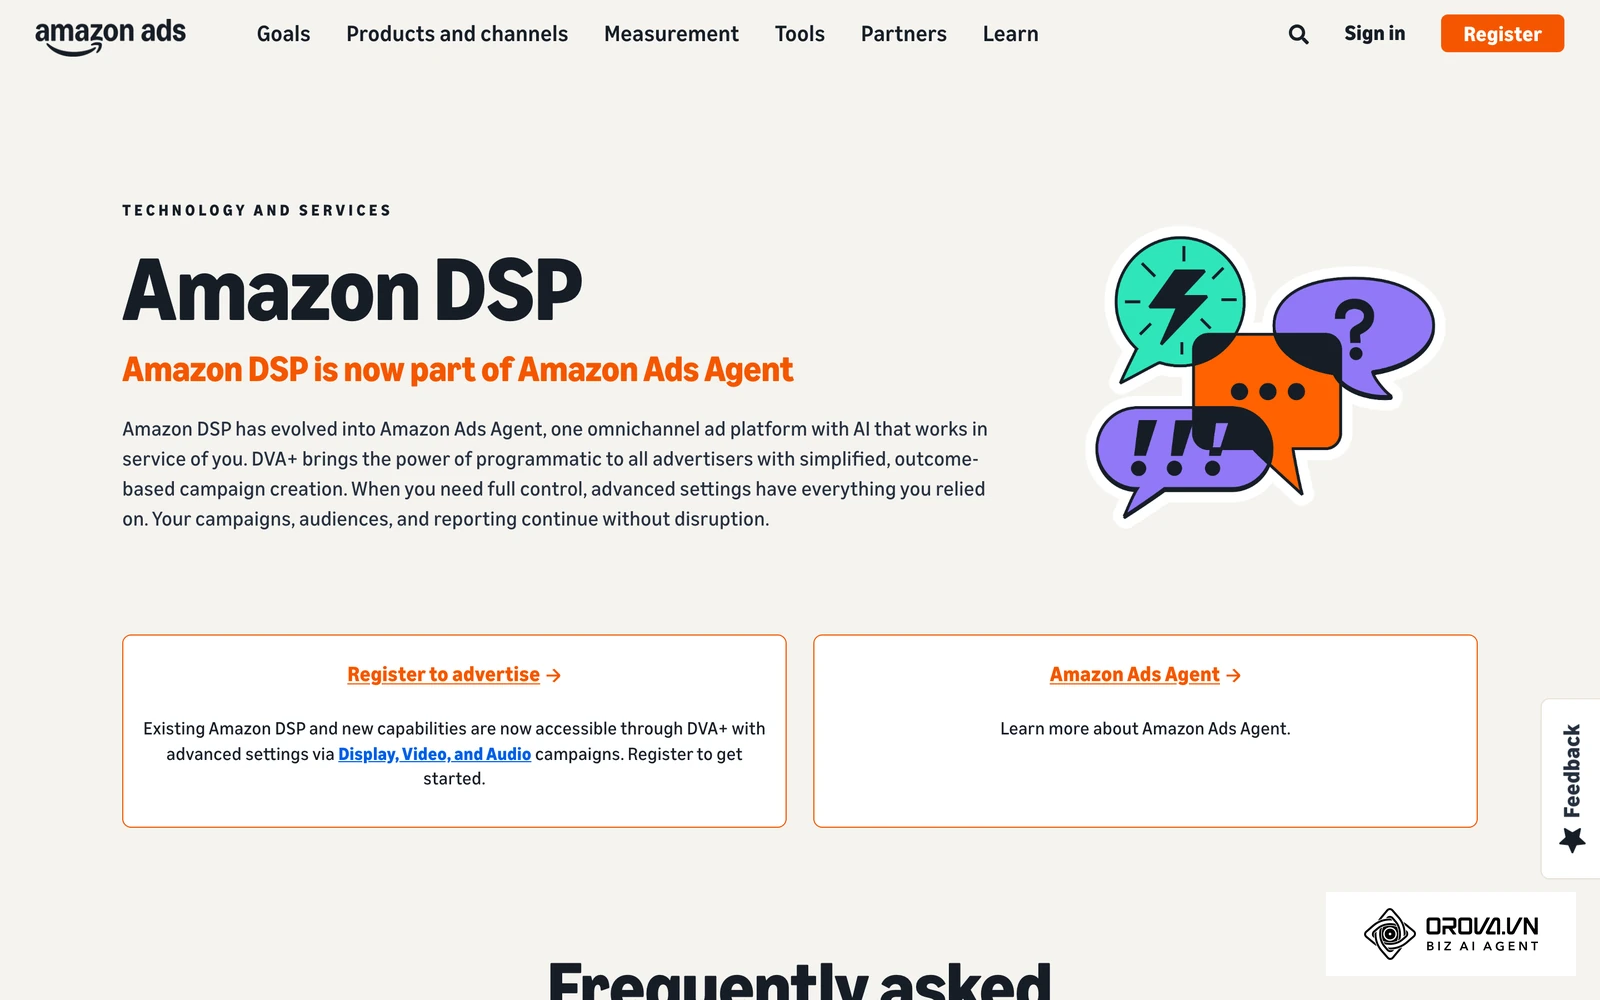
To execute this step, navigate to your media planning console. If you are starting with moderate budgets, open Google Ads to configure YouTube Connected TV placements, log into Roku Ads Manager for native streaming stick reach, or open Hulu Ad Manager for self-serve streaming inventory. If your brand spends at enterprise scale, open Google Display & Video 360 (DV360) or Amazon DSP, open the inventory or deals section, and negotiate a Private Marketplace (PMP) or Programmatic Guaranteed (PG) agreement directly with premium publishers.
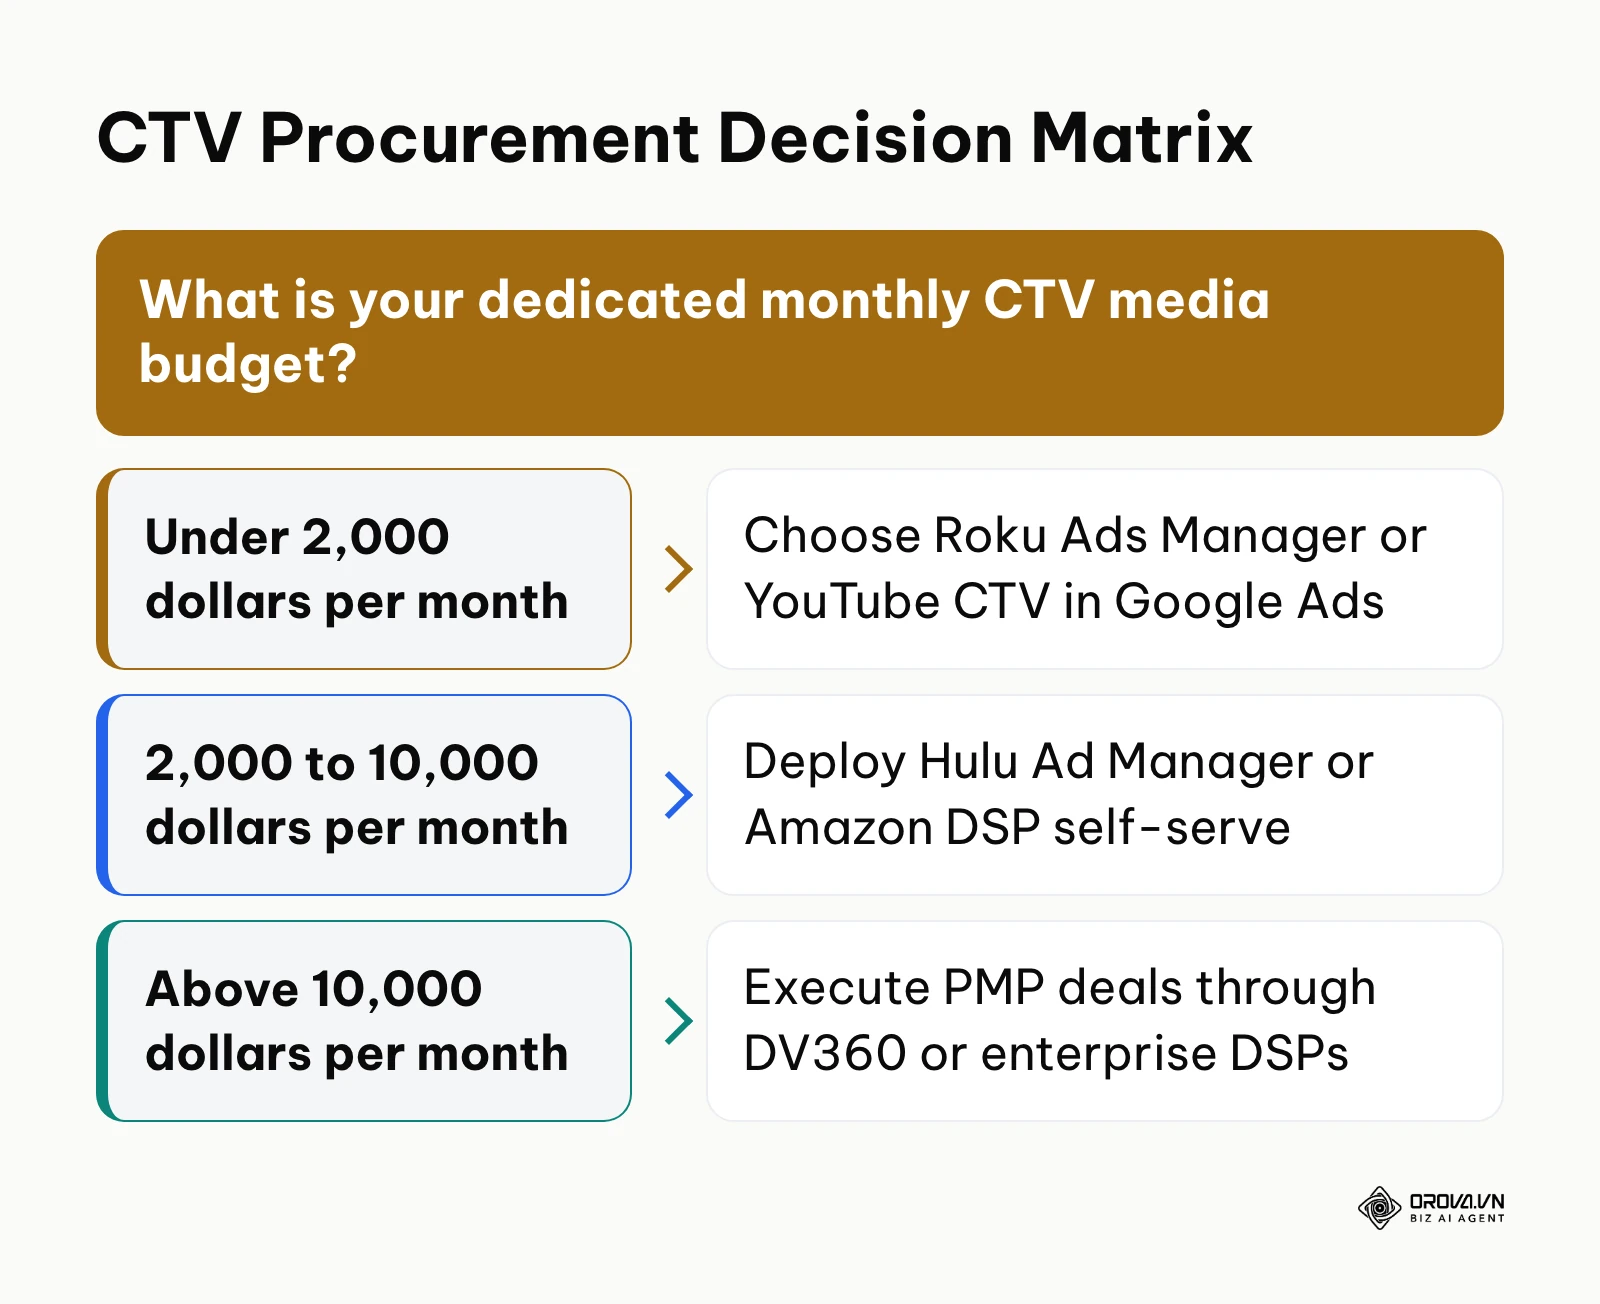
The diagram below outlines a practical procurement route by monthly media budget: under 2,000 dollars, start with Roku Ads Manager or YouTube in Google Ads; from 2,000 dollars to 10,000 dollars, add Hulu Ad Manager or Amazon DSP self-serve; above 10,000 dollars, negotiate PMP deals through DV360 or another enterprise DSP. Treat these tiers as a rule of thumb, not platform requirements.
Your visual confirmation for this step is an active, verified advertiser account displaying an approved payment profile, active billing lines, and access to the connected TV device targeting checkbox under campaign settings.
A common pitfall at this stage is buying uncurated Open Exchange CTV inventory. This mistake often distributes your budget across screensaver utility apps, audio streams masquerading as video, or mobile games reporting incorrect device flags. To resolve this, restrict your targeting exclusively to curated publisher white-lists or certified streaming app bundles, and confirm that the device environment is explicitly filtered to "Connected TV" or "Set-Top Box". When evaluating broader digital allocations, you can review our guide to advertise on Google Ads to understand how search and streaming campaigns complement one another.
Platform CPM Benchmarks and Spend Thresholds
Streaming platforms differ in how you buy, what formats they accept, and how much you need to commit before launch. The table below compares five common CTV buying environments. Minimum spends and CPMs change often and vary by market, so confirm the current figures in each platform's own sign-up flow or forecast tool (for example, Reach Planner in Google Ads) before you lock a budget.
| Platform | Buying Route | Best Fit | Primary Formats | What to Check Before Launch |
|---|---|---|---|---|
| YouTube on TV screens (Google Ads / DV360) | Self-serve video campaigns in Google Ads; programmatic in DV360 | Teams already running Google Ads | 15s / 30s non-skippable and skippable in-stream | Device targeting includes TV screens; forecast in Reach Planner |
| Roku Ads Manager | Self-serve platform | Small and mid-size advertisers testing CTV | 15s / 30s video | Current campaign minimum and geo availability |
| Amazon DSP (Fire TV / Prime Video) | Self-serve seat or managed service | Brands with Amazon retail data | 15s / 30s video, interactive video | Seat access and managed-service thresholds |
| Hulu / Disney Ad Manager | Self-serve portal | Advertisers wanting premium on-demand content | 15s / 30s in-stream breaks | Campaign minimum and creative approval rules |
| Netflix ad tier | Programmatic deals through partners such as The Trade Desk or DV360 | Larger budgets with deal access | 15s / 30s pre-roll and mid-roll | Deal terms negotiated through your DSP |
The 5,000-Dollar Connected TV Ads Budget Model
Hypothetical example: if you are deploying a starter 5,000-dollar monthly connected TV test, avoid spreading your spend evenly across all publishers. Such fragmentation prevents statistical significance in your attribution window.
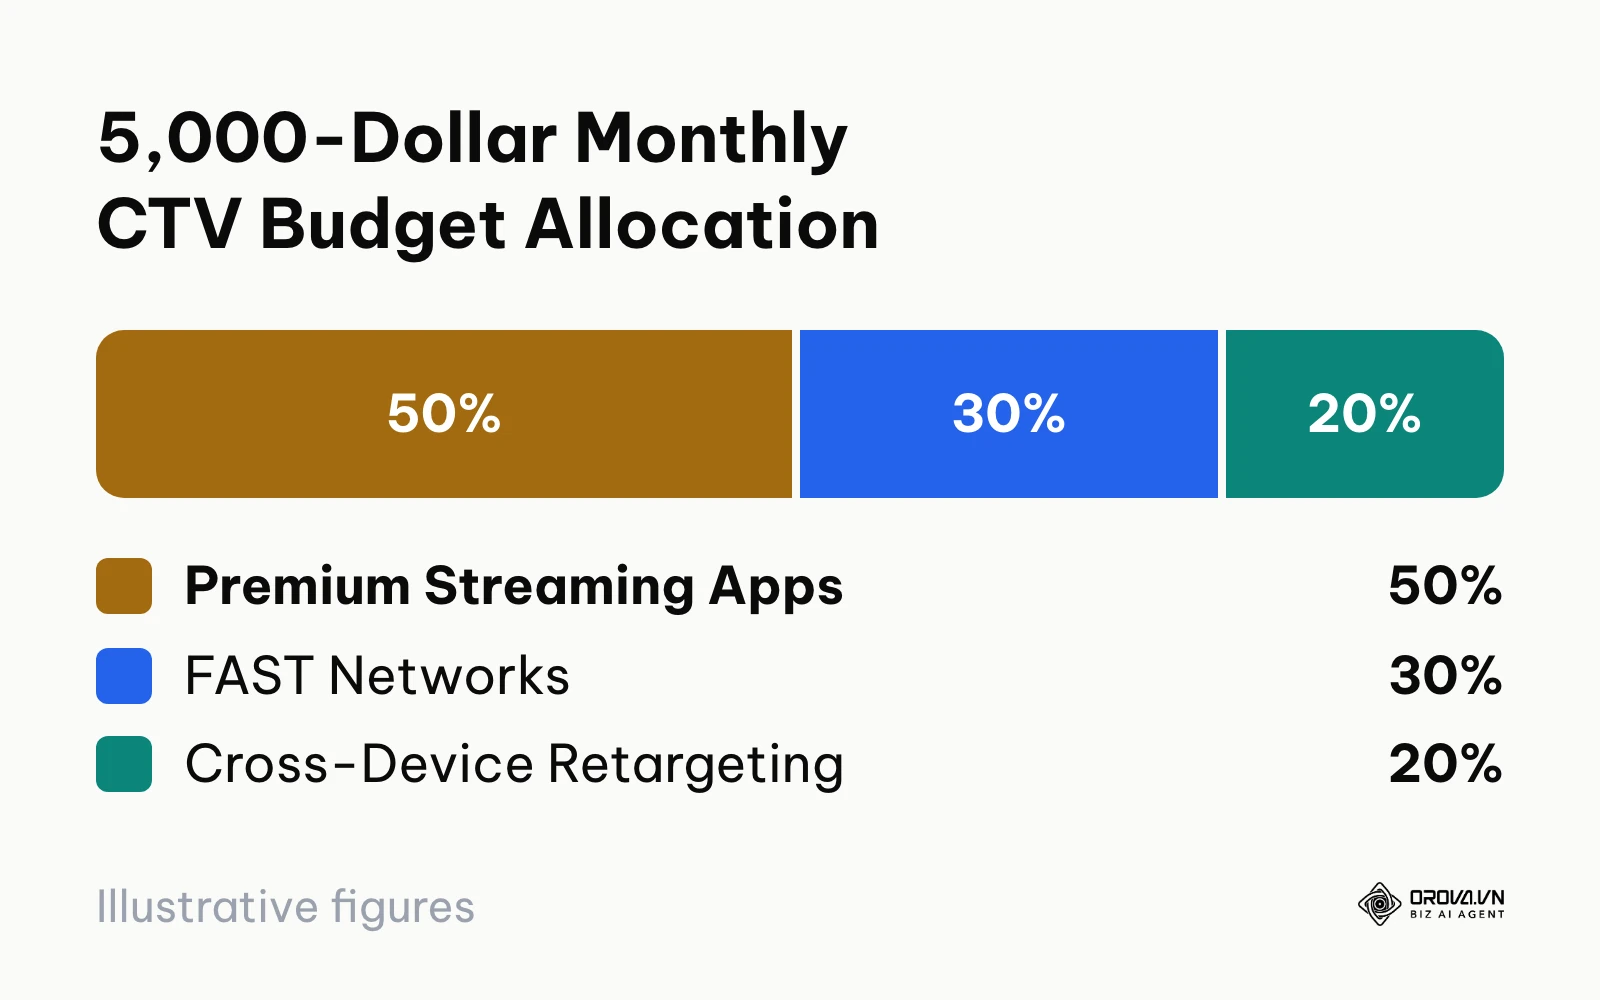
The diagram below outlines our recommended balanced distribution for a 5,000-dollar allocation.
Allocate your budget across three functional layers:
- Premium Streaming Content (2,500 dollars / 50%): Commit this share to Hulu Ad Manager or YouTube TV via Google Ads. This tier secures verified living-room viewability during prime-time scripted programming, establishing immediate household brand authority.
- FAST Syndication Networks (1,500 dollars / 30%): Direct this capital toward Free Ad-Supported Streaming TV (FAST) platforms such as Roku Channel, Pluto TV, or Tubi. These channels usually cost less per impression than premium on-demand apps, expanding your household reach without exhausting your budget.
- Cross-Device Mobile Retargeting (1,000 dollars / 20%): Reserve this capital for social video and search retargeting aimed strictly at households that logged a 100% video completion on the TV screen. When planning cross-channel budgets, comparing these rates against the cost of TikTok ads helps benchmark completion costs across mobile and living-room screens.
Step 2: Encode Video Creatives and Build Shoppable QR Overlays
Produce and export broadcast-certified video files configured for living-room viewing distances.
To execute this step, open your non-linear video editing suite (such as Adobe Premiere Pro or DaVinci Resolve). Import your final timeline, set your sequence dimensions to 1920x1080 (Full HD) or 3840x2160 (4K UHD) with square pixels (1.0 aspect ratio), and set your project frame rate to a progressive, constant frame rate (typically 23.976, 25, or 29.97 frames per second). Export the file using an H.264 (MP4 container) or Apple ProRes 422 codec with a target constant bitrate between 15 Mbps and 30 Mbps.
Your visual confirmation for this step is a clean playback render in VLC Media Player or QuickTime, with the Inspector panel showing no variable frame rates, clean 48 kHz stereo audio, and zero letterboxing or pillarboxing bars.
A frequent technical error is uploading files with stereo audio mastered for mobile phone speakers. Mobile mixes are often much louder than broadcast targets, which can trigger rejection during publisher quality checks. The Video Ad Serving Template (VAST) 4 specifications from the IAB Tech Lab added a Universal Ad ID and a mezzanine (high-quality source) file so that servers can identify each creative and transcode it cleanly for different screens. For audio, many streaming publishers follow the ATSC A/85 Recommended Practice, which targets an integrated loudness of -24 LKFS; check each publisher's spec sheet for its exact tolerance. Use an integrated loudness radar plugin to normalize your audio mix precisely to -24 LKFS before export.
The 8-Point CTV Video Engineering Checklist
Review your creative against these 8 engineering criteria before submitting assets to your DSP library. Publishers publish their own spec sheets, so treat this as a starting checklist and confirm the exact values with each one.
| # | Criterion | Recommended Setting |
|---|---|---|
| 1 | Container and codec | MP4 with H.264 (High Profile, Level 4.2) or MOV with Apple ProRes 422 |
| 2 | Resolution | 1920x1080 minimum; 3840x2160 (4K) preferred to avoid upscaling blur on smart TVs |
| 3 | Bitrate | Constant bitrate (CBR) between 15 Mbps and 30 Mbps |
| 4 | Frame rate | Constant frame rate matching the source (23.98, 25, or 29.97 fps); no variable frame rate |
| 5 | Color space | Rec. 709 standard dynamic range; HDR files need an SDR fallback to avoid washed-out playback on older panels |
| 6 | Audio | Two-channel stereo, 48 kHz, 24-bit, mastered to -24 LKFS integrated loudness (tolerance per your publisher's spec sheet), true peak at -2 dBFS |
| 7 | Duration | Exactly 15.00 or 30.00 seconds; overruns such as 30.12 seconds can be truncated in the ad break |
| 8 | Ad tag | VAST 3.0 or 4.x XML with raw MP4 media files, not interactive JavaScript (VPAID), which most smart TVs do not support |
Shoppable QR Code Design Specifications for the 10-Foot Experience
Unlike mobile phone users who hold their screens inches away, connected TV audiences sit 7 to 10 feet away on a sofa. A standard, tiny website QR code placed in a corner will fail to scan and will frustrate viewers.
Use the working spec below when designing your shoppable QR overlay. These are recommended starting values, not platform rules; test them on a real TV from sofa distance before export.
| Element | Recommended Setting | Why It Matters |
|---|---|---|
| Size | About 10% to 12% of screen height (roughly 200x200 pixels on a 1080p canvas; 400x400 pixels on 4K) | Smaller codes often fail to scan from across the room |
| Position | Lower-right quadrant, inset about 10% from the bottom and right edges | Keeps the code clear of player controls such as pause buttons or scrubber bars |
| Time on screen | At least 15 consecutive seconds | Viewers need time to find their phone and open the camera |
| Contrast and border | Solid white card behind the code with a quiet zone of at least 4 modules | Busy video frames behind the code break scanning |
| Prompt | Short, high-contrast line such as "Scan with your phone camera to view offer" | Tells viewers what to do and what they get |
Hypothetical example: A direct-to-consumer athletic footwear brand launched a 30-second spot across connected television apps. The team exported their master video at 1080p, placed a dynamic QR code in the lower-right corner occupying 11% of the frame, and programmed it to dwell for 18 seconds alongside an offer code. During the initial export, the audio track peaked at -14 LKFS, resulting in immediate DSP automated rejection across three major streaming networks. The production team re-opened the audio project, applied a broadcast limiter plugin to normalize integrated loudness to -24 LKFS, and re-uploaded the asset. The revised video passed quality-assurance scanning within 90 minutes, ultimately generating 1,420 scanned mobile sessions during its first two-week flight. If you want to compare these specs against social video creative formats, review our breakdown of Facebook video ads.
Step 3: Configure Precision Audience Targeting and Household Graphs
Set up your audience segments by pairing first-party customer records with contextual streaming parameters.
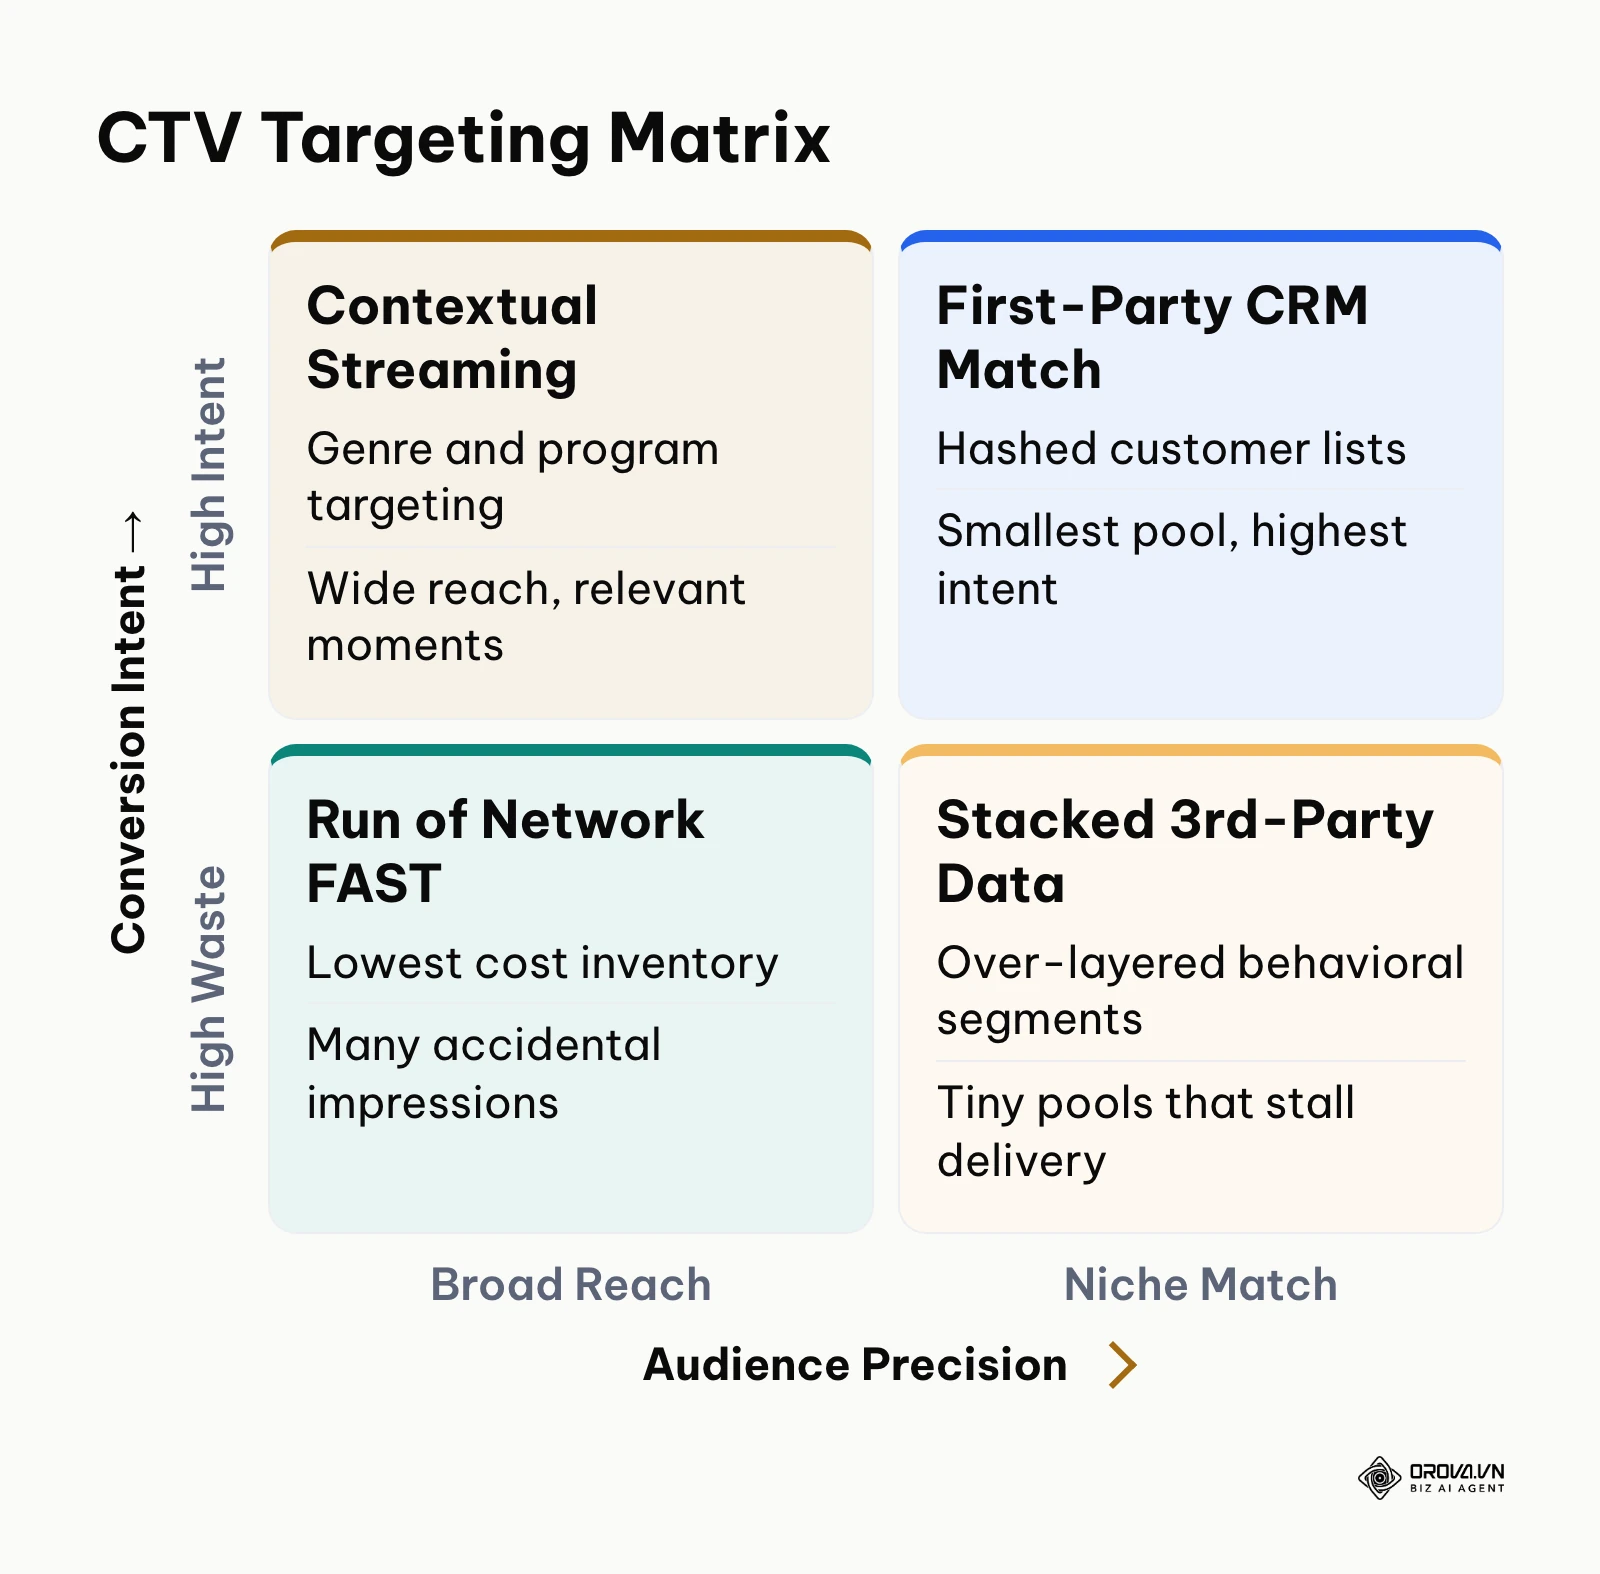
To execute this step, open your DSP Audience Manager. If you have an existing customer database, select Import Audience, choose Customer Match, and upload hashed SHA-256 email and physical address records. The platform will match these entries against its cross-device Identity Graph (such as Unified ID 2.0 or LiveRamp RampID) to resolve corresponding household IP clusters. Next, under Targeting Options, define your geographic Designated Market Areas (DMAs), select relevant content genres (such as Sports, Home Improvement, or Financial News), and deselect unverified mobile and tablet device categories.
The diagram below visualizes the audience precision versus intent tradeoffs across targeting approaches.
Your visual confirmation for this step is an audience summary panel showing a forecasted reach without a low-reach warning, with the device breakdown confirming that delivery is limited to connected television displays.
A common pitfall during audience setup is over-layering third-party behavioral criteria. For example, restricting an audience to "Homeowners who love camping, earn over 120,000 dollars, and intend to buy an SUV this month" on a regional DMA shrinks the available inventory pool below viable bidding thresholds. This causes your campaign to stall with zero delivered impressions. To resolve this, maintain broad contextual parameters (such as targeting outdoor programming genres) or rely on high-match first-party CRM lists, allowing programmatic bidding algorithms sufficient room to pace smoothly.
OROVA ADS applies AI Agent to automate and optimize ad performance on Google, Meta and TikTok. Scale your budget safely, monitor 24/7 and expand your business quickly.
Experience the solution at orova.vn/ads
Step 4: Establish Frequency Capping and Brand Safety Controls
Configure bidding parameters to prevent audience ad fatigue and protect your brand from low-quality ad-supported inventory.
To execute this step, open your campaign configuration screen, locate Pacing and Frequency Capping, and select Custom Household Cap. Set your threshold to 3 to 5 impressions per household across a rolling 7-day window. Next, navigate to Inventory Quality and Brand Safety. Turn on the platform's brand-safety and invalid-traffic options (look for TAG-certified or verified inventory settings from the Trustworthy Accountability Group), apply pre-bid ad fraud filters, and add publisher content exclusions for categories like sensational news, controversial commentary, and unverified user-generated channels.
The table below summarizes the starting settings for this step and where you usually find them.
| Setting | Suggested Starting Value | Where to Find It |
|---|---|---|
| Frequency cap level | Household (IP graph or identity cluster), not device | Pacing and frequency settings |
| Cap value | 3 to 5 impressions per household per 7 days | Pacing and frequency settings |
| Inventory quality | Verified or TAG-certified inventory only | Inventory or brand safety settings |
| Content exclusions | Sensational news, controversial commentary, unverified user-generated channels | Brand safety or content categories |
| Verification tag | Third-party tag such as DoubleVerify or IAS | Line-item verification settings |
Your visual confirmation for this step is a completed line-item rules card showing an active household frequency cap of 3/7 days, combined with an automated third-party verification tag (such as DoubleVerify or IAS) applied to your delivery container.
A frequent error is setting frequency limits at the cookie or device level rather than the household graph level. In a typical home with three smart TVs and two streaming sticks, a device-level cap of 3 impressions can bombard a single living room with 15 impressions per week across different apps. This causes severe viewer annoyance and wastes budget. To fix this, confirm that your DSP frequency setting is configured to "Household IP Graph" or "Cross-Device Identity Cluster". If you manage high-volume multi-channel accounts, study our automated ads playbook to explore how automated guardrails prevent runaway ad spend.
Step 5: Implement Cross-Device Attribution and GA4 Measurement
Establish identity resolution webhooks and custom events to track how non-clickable television impressions generate website visits and online sales.
To execute this step, configure an attribution bridge using a certified measurement partner (such as Rockerbox, tvScientific, or Google Campaign Manager 360). In your attribution console, generate a 1x1 post-view tracking pixel and append it to your DSP campaign creative. Next, log into your Google Analytics 4 property, navigate to Admin > Data display > Events > Create event, and configure a custom event named ctv_post_view_visit. Define the trigger parameter so that incoming sessions containing UTM parameters like utm_source=connected_tv and utm_medium=cpm are flagged for cross-device attribution modeling.
The diagram in the next subsection maps the complete technical data flow from living-room impression to analytics conversion.
Your visual confirmation for this step is visible incoming network hits inside your measurement partner dashboard, where test pings from connected TV apps register matched residential IP addresses that map to test web visits inside the GA4 DebugView console.
A recurring tracking failure occurs when marketers evaluate CTV using last-click attribution models. Because living-room television screens cannot be directly clicked, a last-click model credits 0 conversions to your streaming investment, misattributing all assisted sales to direct organic traffic or paid search. To fix this, establish a 7-day post-view attribution window and run an incrementality lift test comparing website conversion lift across exposed household zip codes versus an unexposed holdout market.
The 4-Step Cross-Device Post-View Attribution Flow
Connecting a television commercial to a smartphone checkout requires a deterministic identity matching sequence:
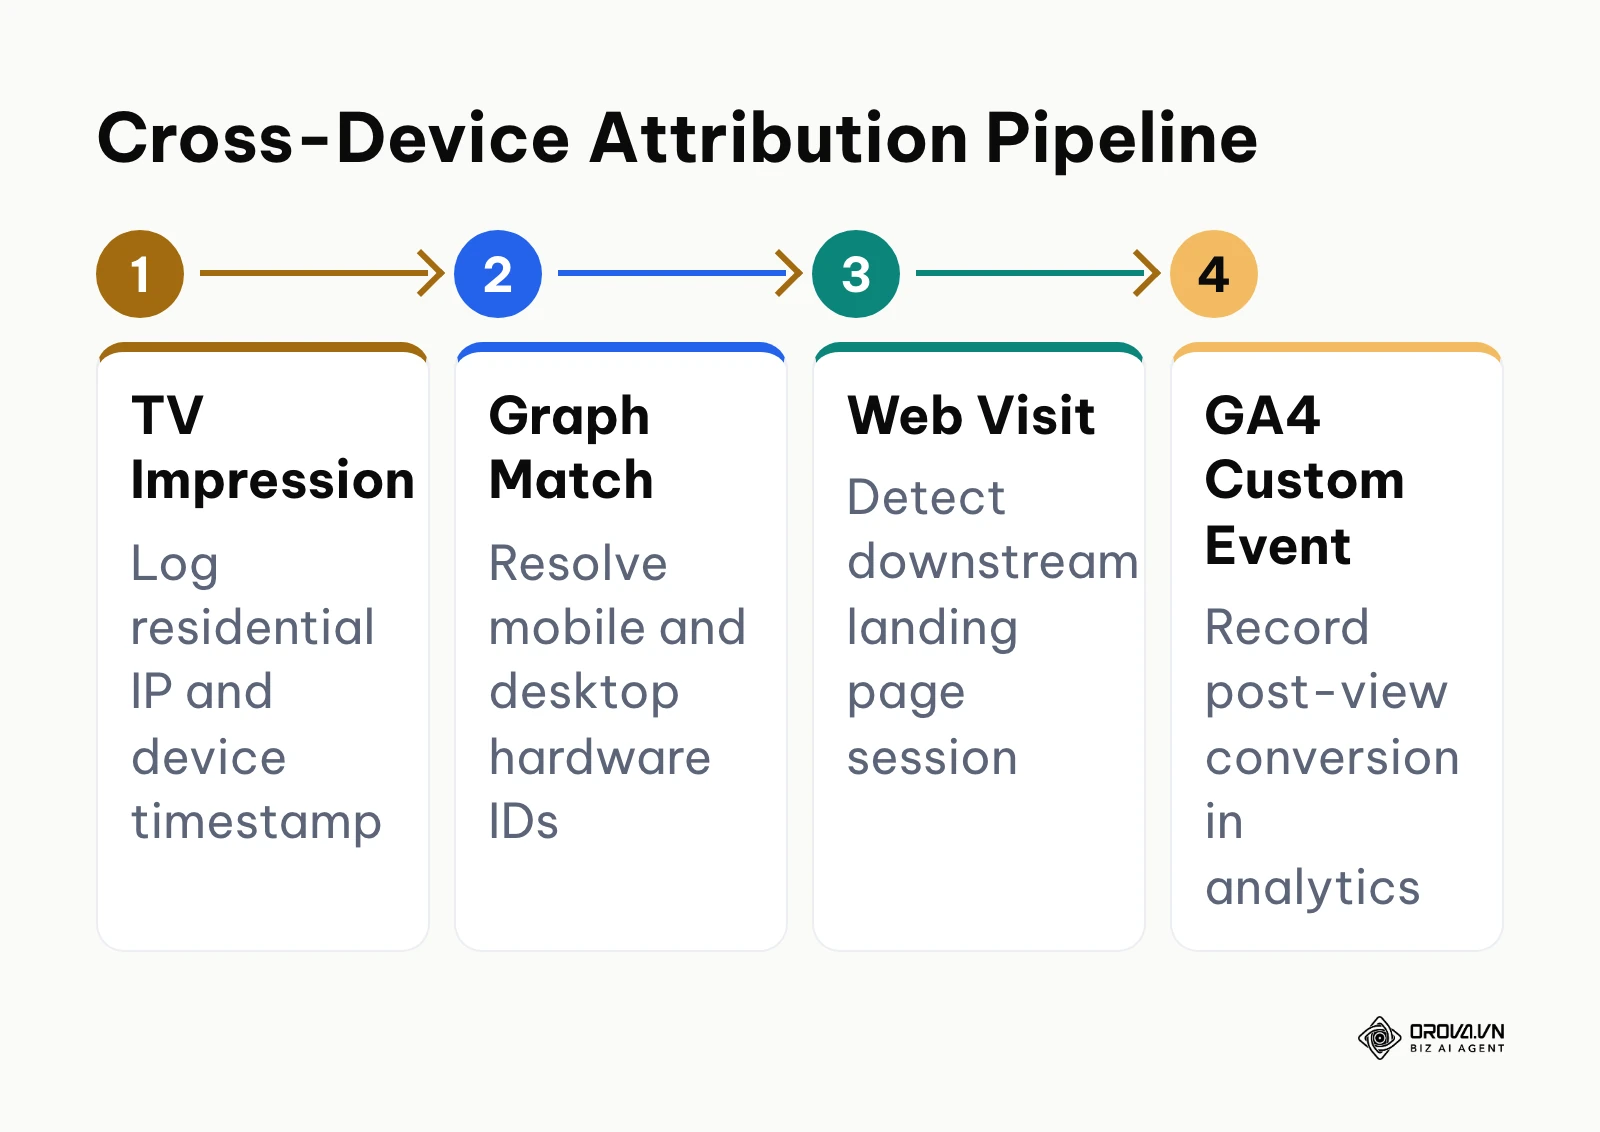
- Impression Logging: When your ad displays on an app like Hulu or Peacock, the ad server logs the residential public IP address, the network timestamp, and the device User-Agent string via a VAST impression tag.
- Household Graph Matching: Within milliseconds, the measurement partner matches the public IP address against an identity graph database, identifying all personal computing devices (smartphones, laptops, tablets) sharing that residential router connection.
- Downstream Engagement Capture: When an individual in that household visits your website on their phone or laptop within your attribution window (typically 1 to 7 days), your website tracking pixel captures the session data, referral headers, and device hardware hashes.
- Attribution & Analytics Ingestion: The measurement engine validates that the web visit occurred after the TV impression, reconciles the IP match, and passes an attributed conversion event into GA4 and your CRM via server-side Measurement Protocol.
Hypothetical example: An enterprise home-goods retailer launched a 12,000-dollar connected TV campaign to promote a seasonal dining set. The marketing team placed post-view measurement pixels on their DSP line items and set up a 7-day household attribution window linked to GA4. After one week of delivery, the standard GA4 Traffic Acquisition report displayed zero direct revenue from the CTV campaign, creating internal concern that the media spend was ineffective. The media buyer opened the attribution partner portal, filtered by matched household IP addresses, and identified that 318 online purchases during that period originated from households exposed to the TV commercial within the prior 5 days. The team updated their GA4 reporting view to include custom data-driven attribution channels, confirming that the streaming campaign drove a 24% incremental lift in assisted revenue across exposed zip codes.
Step 6: Deploy Programmatic Deals and Flight Your Schedule
Submit your final insertion orders, activate programmatic deal IDs, and pace your budget across high-intent viewing windows.
To execute this step, navigate to your DSP line-item management screen. Review your flight schedule, setting the campaign start date and end date. Under Dayparting, concentrate your delivery between 6:00 PM and 11:00 PM local time across your target time zones, as this window aligns with peak living-room co-viewing. Enter your maximum bid parameters: for Open Auction bidding, input an automated Target CPM cap; for Private Marketplace deals, input your negotiated fixed deal ID and agreed floor price. Click Activate Line Item.
| Launch Setting | Suggested Choice | Why |
|---|---|---|
| Pacing | Even pacing across the flight | Accelerated pacing can spend the daily budget on early-morning background viewing |
| Dayparting | Concentrate on 6:00 PM to 11:00 PM local time | Evening hours are when households watch together |
| Open auction bid | Automated target CPM with a cap | Keeps bids inside your planned cost per impression |
| Private deals | Negotiated deal ID and agreed floor price | Locks access to the publisher inventory you negotiated |
| Flight dates | Fixed start and end date | Makes pacing and post-view windows easy to read |
Your visual confirmation for this step is an active line-item status reading "Live / Delivering", with the campaign diagnostics panel logging its first 1,000 impressions and verifying that pacing progress matches your daily budget allocation.
A critical mistake at launch is leaving delivery pacing set to "As Fast As Possible" (Accelerated Pacing). On high-volume streaming platforms, this setting can exhaust your entire daily budget between 6:00 AM and 8:00 AM on background morning television, leaving nothing for prime-time evening hours. To resolve this, always select "Even Pacing" across your flight window and enforce specific daypart flighting locks.
Step 7: Audit Attentive Delivery and Optimize Creative Fatigue
Monitor playback quality metrics and rotate creative variations before viewer wear-out degrades response rates.
To execute this step, open your DSP reporting analytics dashboard and generate a custom report grouping data by App Name, Creative ID, and Video Quartile Metrics (First Quartile 25%, Midpoint 50%, Third Quartile 75%, and Complete 100%). Check your aggregate Video Completion Rate (VCR). Because most CTV ads are non-skippable, completion rates are usually high, so compare each app against your own campaign average and place clear underperformers on your line-item exclusion list. Next, monitor your creative frequency: once a creative reaches an average household frequency of 5 exposures, introduce fresh 15-second or 30-second creative cutdowns to sustain response rates.
| Signal in Your Report | What It Usually Means | What to Do |
|---|---|---|
| One app's completion rate far below your average | Low-quality or mislabeled inventory | Add the app ID to your exclusion list |
| Impression spikes between 1:00 AM and 5:00 AM with no scans or visits | Ads playing to empty rooms | Restrict dayparts to waking hours |
| Household frequency climbing past your cap target | Creative fatigue building | Rotate in a new 15-second or 30-second cutdown |
| QR scans falling while completion stays high | Viewers see the ad but stop acting on it | Refresh the offer or the QR call to action |
Your visual confirmation for this step is a stable performance report showing a consistent Video Completion Rate, a steady Cost Per Completed View (CPCV) against your own baseline, and regular daily scan sessions registered by your dynamic QR tracking dashboard.
A frequent error is assuming high completion rates guarantee actual human attention. A streaming app can keep playing, and keep serving ads, after the viewer has left the room or switched the TV input. If your DSP reporting shows overnight impression spikes between 1:00 AM and 5:00 AM with zero corresponding QR scans or web visits, the system is likely delivering against unattended television sets running auto-play marathons. To resolve this, restrict delivery dayparts to active waking hours (6:00 AM to 11:30 PM) and exclude non-metered overnight program categories.
Hypothetical example: A B2B software company tested connected TV advertising to build brand awareness among remote enterprise professionals. The agency configured a 30-second explainer video across business news streaming applications. By week three, campaign reports showed a high 96% Video Completion Rate, but weekly QR scans dropped by 72% compared to week one. The media buyer examined delivery diagnostics and discovered that the average household frequency had climbed to 8.4 exposures within 14 days, signaling creative fatigue. The production team introduced two fresh creative variants: a 15-second concise customer testimonial and a 30-second tactical product walkthrough with an updated QR value offer. Within four days of rotating these new creatives, QR scan rates rebounded to target baseline levels, while the overall cost per completed view stabilized at 0.024 dollars.
Master Checklist for Connected TV Ads Execution
Print this operational checklist to track your campaign workflow from pre-flight encoding to post-launch optimization.
| Step | Primary Action | Done Criteria | Estimated Duration |
|---|---|---|---|
| 1. Platform & Budget | Select self-serve DSP or direct publisher portal; fund minimum spend. | Account approved with active billing and CTV device targeting available. | 1–3 business days |
| 2. Creative Encoding | Render 16:9 video at 1080p/4K; master audio loudness to -24 LKFS; place QR code. | Asset passes DSP automated video and audio compliance checks. | 2–4 business days |
| 3. Audience Setup | Ingest first-party CRM lists; map DMA geographic and genre criteria. | Audience forecast shows no low-reach warning and TV-only delivery. | 1 business day |
| 4. Frequency & Safety | Apply household frequency cap (3–5/week); activate TAG fraud filters. | Rules card shows household-level cap and brand safety verification tag. | 2–4 hours |
| 5. Cross-Device Tracking | Deploy post-view measurement pixel; create custom ctv_post_view_visit in GA4. | Pings register residential IP matches verified in GA4 DebugView. | 1 business day |
| 6. Campaign Deployment | Apply prime-time dayparting; set pacing to Even; activate live line items. | First 1,000 impressions logged with zero delivery error notices. | 2–4 hours |
| 7. Attentive Auditing | Analyze Video Completion Rate (VCR); prune low-performing apps; rotate creative. | VCR stable against your baseline; creative rotated at 5 household exposures. | Ongoing weekly |
Want to scale your budget but afraid of breaking performance?
Integrate OROVA ADS now - an AI Agent that automatically monitors and optimizes Google, Meta, TikTok ads 24/7. Now, expanding and replicating your Performance Ads team is just one click away.
Try it now at: orova.vn/ads
Common Pitfalls in Connected TV Ads and Troubleshooting
When deploying video inventory to living-room screens, technical misconfigurations can silently drain ad budgets. The table below outlines 6 widespread operational pitfalls, their underlying causes, and practical solutions.
| Pitfall | Root Cause | Actionable Solution |
|---|---|---|
| Instant Creative Disapproval | Video audio track mastered to mobile standards, exceeding -24 LKFS limits. | Apply an ITU-R BS.1770 loudness meter in your editing suite to normalize integrated sound to -24 LKFS within the publisher's tolerance. |
| Budget Burn on Mobile Apps | Device targeting left on default "All Screens," allowing DSP to bid on cheap mobile gaming inventory. | Uncheck mobile, tablet, and desktop devices; restrict environment targeting strictly to "Connected TV" or "Set-Top Box". |
| Zero Attributed Conversions | Evaluating streaming performance using standard last-click attribution models. | Configure a 7-day post-view attribution model and cross-reference household IP graphs against GA4 server-side events. |
| Viewer Creative Backlash | Frequency capping configured at the individual device level instead of the household graph level. | Update DSP pacing parameters to "Household-Level Frequency Cap" capped at 3 to 5 impressions per 7-day window. |
| Unscannable QR Elements | QR code rendered too small (<10% screen height) or displayed for fewer than 10 seconds. | Re-export the video with a high-contrast QR code occupying 11% of the frame and displaying for at least 15 seconds. |
| Low-Engagement Midnight Waste | Uncapped 24-hour delivery distributing budget across auto-playing televisions while viewers sleep. | Apply dayparting controls to restrict bidding between 6:00 AM and 11:30 PM local market time. |
Orova Ads does not buy CTV inventory and does not connect to Roku, Amazon DSP, DV360, or Hulu. What it can do: if you run YouTube video campaigns that reach TV screens through Google Ads, those campaigns sit in the same Google Ads account that Orova Ads reads, so you can see them in one table next to your Meta Ads and TikTok Ads campaigns. Campaign details break results down across 14 dimensions, including device, location, and hour, and data syncs on a schedule you set from every 5 minutes to every 24 hours (180 minutes by default). In the Rule Sets tab you can choose which of the 91 auto-executable actions run automatically, and the History tab compares conversions and CPA for 7 days before and after each action.
Measuring Connected TV Ads Performance Post-Launch
Because connected TV ads do not rely on standard click-through rates, evaluating campaign success requires tracking attentive playback and downstream cross-device actions.
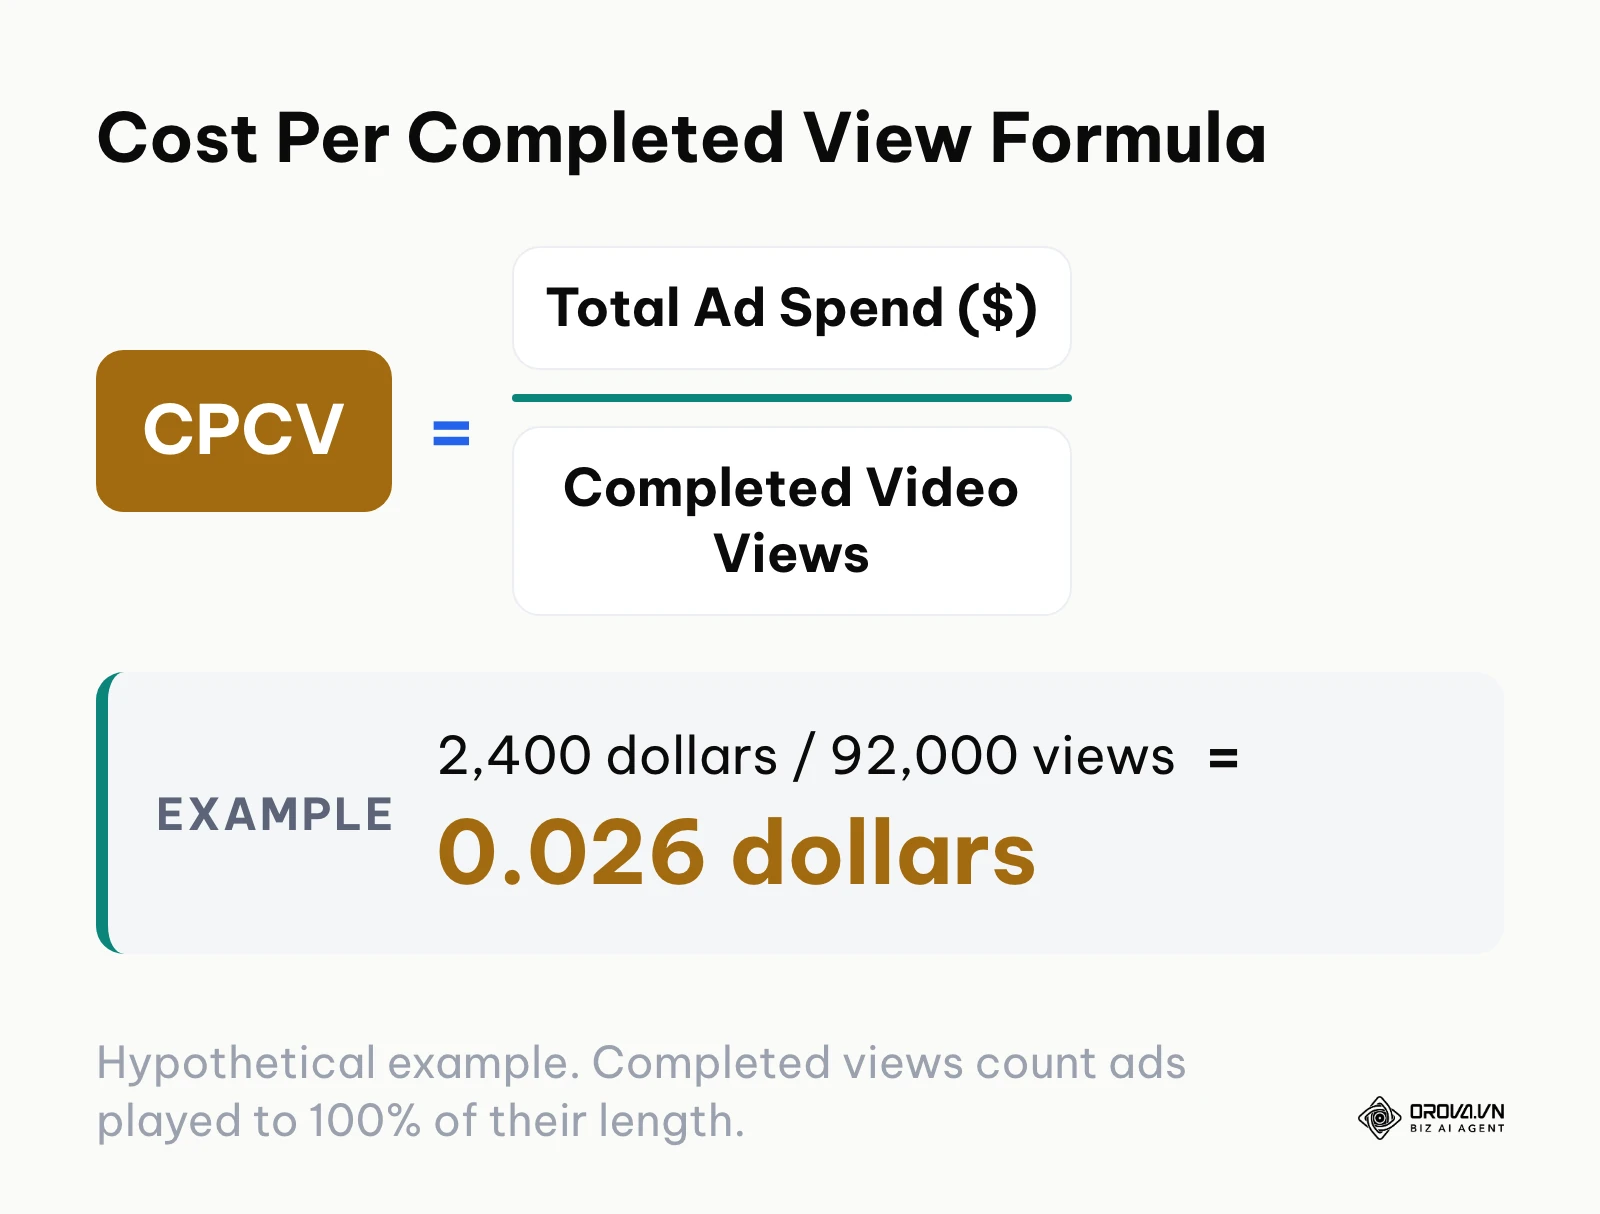
The formula below defines the standard calculation for Cost Per Completed View (CPCV). Hypothetical example: 2,400 dollars in spend divided by 92,000 completed views gives a CPCV of about 0.026 dollars.
Track these four core metrics to assess delivery quality:
- Video Completion Rate (VCR): Calculate total completed views (100% duration) divided by total served impressions. CTV completion rates are usually high because most ads cannot be skipped, so track the trend against your own baseline. If your rate drops noticeably, review your publisher inventory report and exclude underperforming programmatic channels.
- Cost Per Completed View (CPCV): Total gross ad spend divided by completed views. Compare it against your own previous flights and against other video channels you run.
- Attentive Reach & Household Frequency: Monitor the ratio of unique household IP addresses reached against total delivered impressions. Keep average frequency close to the household cap you set in Step 4.
- Cross-Device Post-View Conversion Rate: The percentage of exposed household IP clusters that log a corresponding website visit or transaction within your chosen attribution window (typically 1 to 7 days). Review this data weekly inside your attribution reporting console and GA4 custom exploration reports.
Initial impression delivery and completion metrics appear in your DSP console within 2 to 4 hours of activation. Cross-device attribution trends and incremental search lift data typically require 7 to 14 days of sustained delivery to achieve statistical validity.
Connected TV Ads Trends in the Coming Years: Author's Perspective
Looking at the digital media landscape as of 2026, streaming platforms have largely shifted from uncoordinated ad networks into unified programmatic marketplaces. Here are three structural shifts I anticipate unfolding over the next few years.
The Consolidation of Programmatic Linear and Streaming Inventory
In my view, the operational barrier separating traditional linear cable buys from digital connected TV will keep shrinking. We already see major broadcast holding companies routing live cable inventory through automated private marketplaces using standardized programmatic protocols. I expect media buyers will soon purchase unified audience guarantees across both linear sports broadcasts and on-demand streaming through a single demand-side seat. However, this convergence could stall if legacy broadcast networks resist sharing proprietary viewer data with centralized programmatic exchanges. Media teams should prepare today by consolidating their planning teams and retiring disconnected broadcast buying silos.
Autonomous AI Dynamic Creative Optimization on the Big Screen
I believe generative artificial intelligence will fundamentally transform living-room ad creative from static 30-second videos into dynamic, real-time customized broadcasts. By analyzing real-time contextual signals—such as household geographic weather, regional inventory availability, and localized pricing—AI rendering engines will soon dynamically alter the final 5 seconds of a commercial, rendering personalized product variants and localized QR discount codes on the fly. This shift will depend heavily on whether streaming hardware processors can render dynamic overlays without latency. Advertisers should prepare by modularizing their creative production timelines, creating swappable 5-second end-cards and modular voiceover tracks.
The Migration from Raw Household IP Matching to Secure Clean Rooms
I anticipate that privacy regulations and operating-system changes will steadily weaken raw residential IP address matching. Privacy features that mask or relay IP addresses already exist on some devices and browsers, which makes household graphing less reliable. I believe the industry will transition toward secure Data Clean Rooms (such as Snowflake and AWS Clean Rooms) and authenticated identity frameworks like Unified ID 2.0. This evolution could slow down if small and mid-sized publishers find clean room infrastructure costs prohibitive. Marketers should prepare immediately by building robust first-party CRM databases linked to authenticated user logins rather than relying solely on raw residential IP tracking.
Frequently Asked Questions About Connected TV Ads
Can small businesses with under 2,000 dollars per month run connected TV ads?
Yes. Emerging self-serve platforms, such as Roku Ads Manager and YouTube CTV via Google Ads, let small businesses launch campaigns with far smaller budgets than traditional TV; check each platform's current minimum when you sign up. By concentrating your spend on specific local zip codes or niche audience segments, you can establish an impactful living-room presence without competing directly against national enterprise budgets.
How do connected TV ads work mechanically compared to linear TV?
Linear TV broadcasts identical commercial breaks over cable or satellite lines to every viewer watching a channel simultaneously. In contrast, connected TV ads are delivered dynamically via internet video streams using programmatic ad servers. When an ad pod opens in a streaming app, the platform calls an automated auction, bidding on and serving a custom commercial tailored to that specific household within milliseconds.
How do you distinguish between organic website purchases and TV ad-driven conversions?
Distinguishing between organic orders and TV-driven purchases requires setting up geo-holdout incrementality tests and post-view attribution models. By comparing baseline organic traffic in unexposed geographic control regions against traffic in regions served by your TV campaign, your measurement partner can isolate incremental conversion lift directly attributable to living-room impressions.
What is the typical CPM benchmark for connected TV advertising in 2026?
There is no single reliable benchmark, because CTV CPMs depend on the platform, the market, targeting depth, and the season. As a rule, free ad-supported streaming TV (FAST) networks cost less than premium on-demand apps, and live sports or exclusive releases cost the most. Before you set a budget, run a forecast in the platform you plan to use, such as Reach Planner in Google Ads, to see the expected CPM for your own audience and market.
How does AI improve connected TV ad campaign efficiency?
Artificial intelligence enhances connected TV advertising by automating audience identity resolution across fragmented household devices, predicting optimal flight pacing during prime-time hours, and dynamically adjusting programmatic bid caps to prevent overpaying for ad inventory. Additionally, AI creative tools assist in automatically generating high-contrast, broadcast-compliant end-card overlays tailored to different viewer segments.
What is the difference between CTV and OTT advertising?
Connected TV (CTV) refers specifically to the physical internet-connected television screen where the content is displayed, such as a Smart TV or an Apple TV set-top box. Over-The-Top (OTT) refers to the streaming content delivery method that bypasses traditional cable providers, regardless of whether that content is viewed on a television, a laptop, or a smartphone.
Where Should You Start?
Your initial technical focus should depend directly on your current creative readiness, budget scale, and data maturity.
If you are an established e-commerce brand with existing high-definition video assets and a monthly test budget between 3,000 dollars and 5,000 dollars, your immediate step is to open a self-serve ad account on Roku Ads Manager or Google Ads (targeting YouTube CTV). Configure an initial flight targeting your top 10 revenue-generating zip codes, attach a dynamic 15-second shoppable QR code overlay, and establish your baseline completion rate.
If you are a B2B company or specialized service provider seeking executive brand authority, focus your initial session on building a verified first-party audience list. Export your high-value enterprise accounts from your CRM, hash the records using SHA-256 formatting, and upload them to a demand-side platform like Amazon DSP or DV360. Target business news and financial streaming programming to engage decision-makers in their living rooms.
If you are a creative production lead or agency team with unstandardized video assets, dedicate your first afternoon to a comprehensive video and audio engineering audit. Import your raw commercial footage into your video editing suite, normalize the audio master to -24 LKFS using an ATSC A/85 compliant loudness meter, verify 16:9 safe-title boundary margins, and export a certified 1080p broadcast master before allocating media spend to connected tv ads.
About the author

Builder of Orova
Nguyễn Đỗ Trọng Ân has 8 years of experience in marketing, including 6 years managing market development across Asia. He builds Orova, a Biz AI Agent that never sleeps: it plans, runs and optimizes work for businesses.
Run your business with AI Agents
Orova is the always-on Biz AI Agent — it plans, runs, and optimizes the work for you.
Save time, unlock productivity.