
Site optimization: how to rank and convert in 7 steps (2026)

Executing comprehensive site optimization transforms an underperforming website into a dependable engine for organic search visibility and digital revenue. When you complete the steps outlined in this guide, you will possess a verified pass across Google Core Web Vitals metrics, a clean technical index in Google Search Console, and a streamlined conversion funnel that minimizes checkout and form abandonment. Completing this process requires administrative access to Google Search Console, Google Analytics 4, your content management system or code repository, and approximately six to eight hours of focused execution. You do not need expensive commercial audit subscriptions to achieve these outcomes. However, this guide is not intended for brand-new websites launched yesterday with zero indexed pages and no baseline traffic data, nor does it cater to static single-page digital business cards that carry no conversion goals. If your objective is to systematically diagnose speed bottlenecks, resolve technical crawl impediments, and improve organic revenue, execute this workflow in order.
Site Optimization: Core Objectives, Pillars, and Execution Timeline
Site optimization delivers three tangible business outcomes: faster mobile page rendering, higher organic search keyword rankings, and an increased percentage of visitors who complete commercial actions. The complete implementation process comprises seven structured steps divided into technical performance, search indexing, and user experience, requiring six to eight hours of setup time and twenty-eight days of field observation.
At its core, modern website optimization unites three historically separated disciplines: technical web performance engineering, on-page search engine discoverability, and conversion rate architecture. Treating any one of these pillars in isolation produces diminishing returns. A lightning-fast page that search bots cannot parse will attract no organic traffic. Conversely, a page ranking in position one that suffers from heavy layout shifts and sluggish click responsiveness will shed prospective buyers before they can complete a purchase.
Prerequisites Before You Start Optimization
Before altering templates or editing server directives, assemble the foundational credentials, software tools, and baseline logs shown in the preparation table below.
| Required Asset | Source / Access Point | Estimated Setup Time | Consequence if Missing |
|---|---|---|---|
| Google Search Console | search.google.com/search-console | 10 minutes | Cannot detect server crawl errors or view official 28-day Core Web Vitals field data |
| Google Analytics 4 | analytics.google.com | 15 minutes | Cannot isolate conversion drop-offs or measure revenue improvements after code changes |
| Chrome DevTools | Built directly into Google Chrome browser | 0 minutes | Inability to run local network throttling, CPU emulation, and layout shift debugging |
| CMS or Server Access | Hosting control panel, FTP, or Git repository | 5 minutes | Inability to modify code templates, headers, server caching, or image assets |
| Performance Log Sheet | Local spreadsheet or Markdown document | 5 minutes | Inability to establish before-and-after benchmarks to prove engineering impact |
Step 1: Establish Performance Baselines in Search Console and PageSpeed Insights
Your objective in this step is to record empirical baseline metrics for both lab conditions and real-world field visits across your highest-traffic page templates.
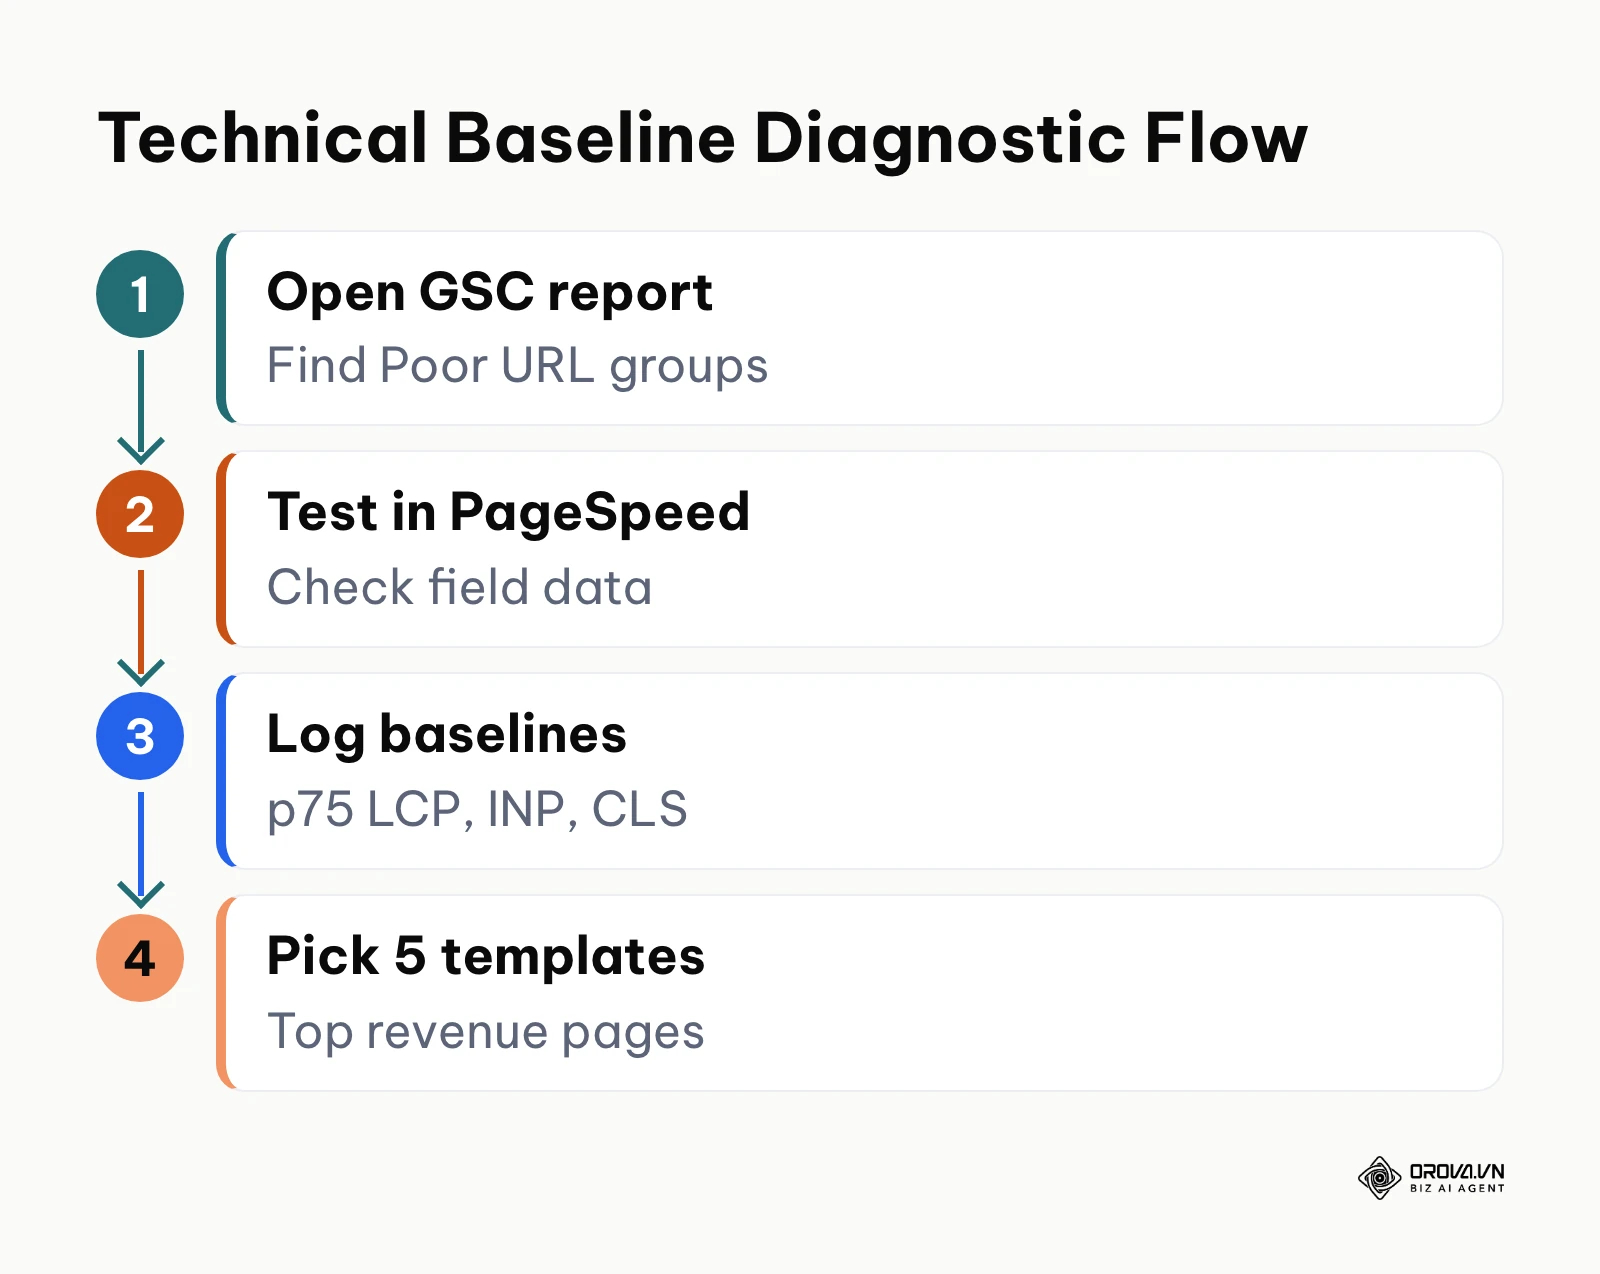
Navigate to Google Search Console and open the Core Web Vitals report located under the Experience menu on the left navigation bar. Select Open Report on the Mobile section. Identify the specific URL groups that Google flags with "Poor" or "Needs Improvement" status. Next, open a new browser tab and navigate to pagespeed.web.dev. Paste the representative URL of your most critical template (such as your homepage, primary category page, or primary lead generation page) into the input box and click Analyze. When the analysis completes, examine the section labeled "Discover what your real users are experiencing" to locate the Chrome User Experience Report (CrUX) data. Record the 75th percentile values for Largest Contentful Paint (LCP), Interaction to Next Paint (INP), and Cumulative Layout Shift (CLS).
You know this step is completed correctly when you have an export or spreadsheet containing the exact baseline numbers for your top five commercial URL templates, noting whether each metric currently passes or fails Google's recommended thresholds.
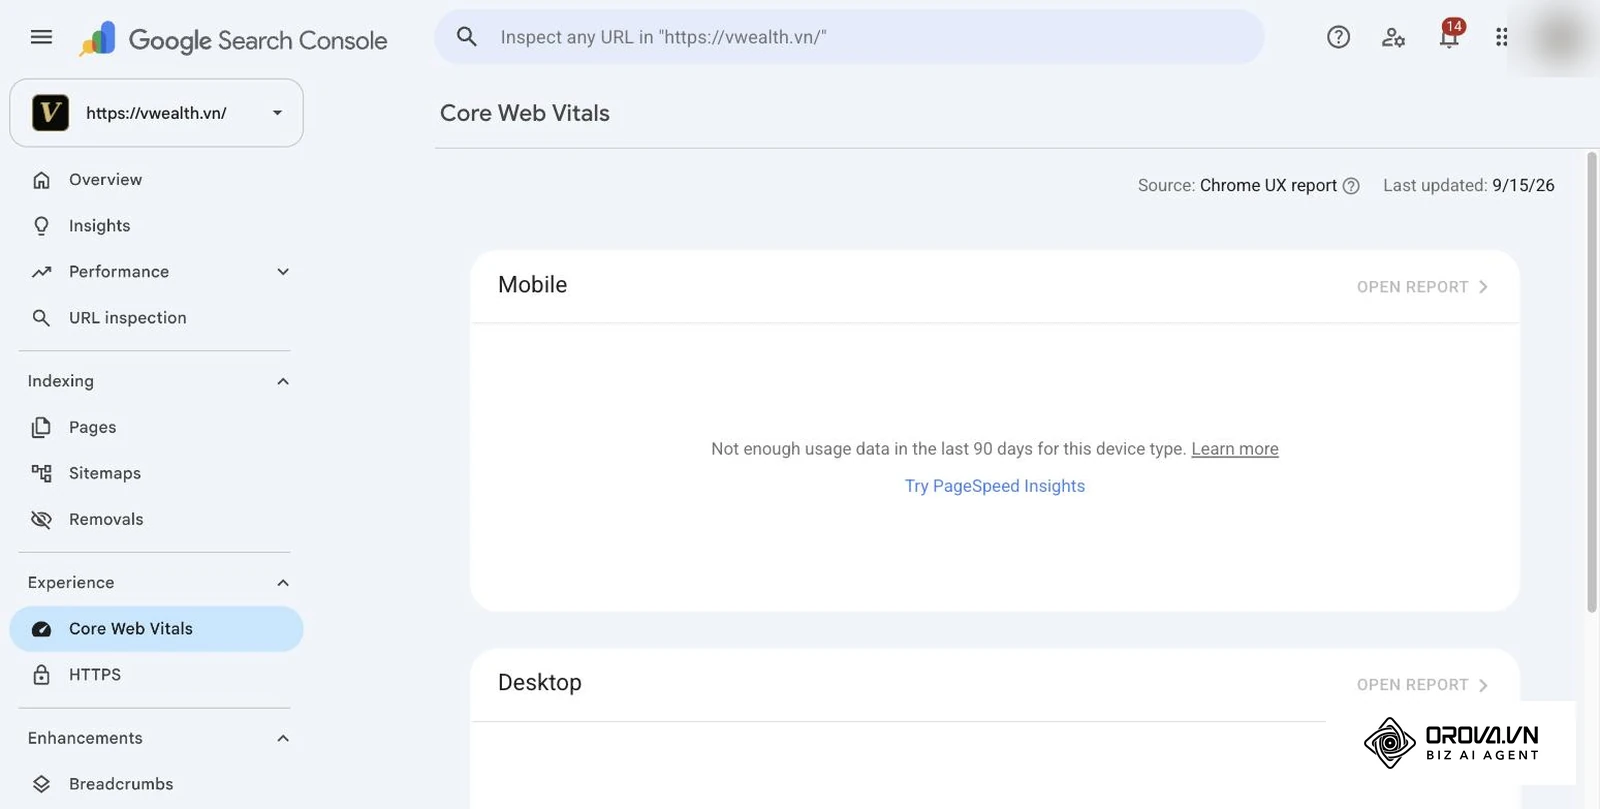
The most frequent error during baseline collection is relying exclusively on the synthetic "Diagnose performance issues" lab score while ignoring field data. Lab runs occur in simulated environments with zero human interaction, which means they cannot record authentic INP data or real network variability. If Search Console shows "Not enough usage data" for your site (the Core Web Vitals report screenshot in Step 2 shows what that looks like), PageSpeed Insights lab data and your own DevTools profiles become your working baseline until field data accumulates. Always use field metrics as your source of truth for business decisions.
Step 2: Eliminate Largest Contentful Paint Bottlenecks on Mobile
Your objective in this step is to reduce your Largest Contentful Paint (LCP) time to under 2.5 seconds on mobile connections by optimizing critical render path assets.
Open Google Chrome DevTools by right-clicking your web page and selecting Inspect, then click on the Performance panel. Set CPU throttling to "4x slowdown" to emulate a mid-tier mobile processor, check the Web Vitals box, and click the Reload button to record a page profile. In the resulting flame chart, identify the element marked with the "LCP" flag. On most content and commerce pages, this element is a hero banner image, an embedded background video, or a large heading rendered with a custom web font. The HTTP Archive Web Almanac 2024 performance chapter reports that the LCP element is an image on most mobile pages, which is why image delivery is the first place to look.
To resolve an image-based LCP bottleneck, take three direct engineering actions:
- Convert the source image from legacy JPEG or PNG formats into modern WebP or AVIF formats using an image processor or build-step plugin.
- Add an explicit priority hint to the primary hero image tag in your HTML: <img src="hero.webp" fetchpriority="high" alt="Product hero" width="1200" height="600">.
- Open your HTML document <head> and insert a pre-load tag for that exact asset: a link tag with rel="preload", as="image", fetchpriority="high" and type="image/webp", pointing at the same hero file.
You know this step is successful when you run a new profile in DevTools and the LCP timestamp shifts leftward, dropping below the 2.5-second mark, with the hero image resource appearing at the very top of your Network waterfall request stack.
A common implementation pitfall is applying lazy-loading attributes (loading="lazy") to the above-the-fold hero image. Lazy-loading instructs the browser engine to delay downloading the asset until scroll calculations finish, which artificially inflates your LCP duration. Never apply loading="lazy" to elements visible in the initial mobile viewport.
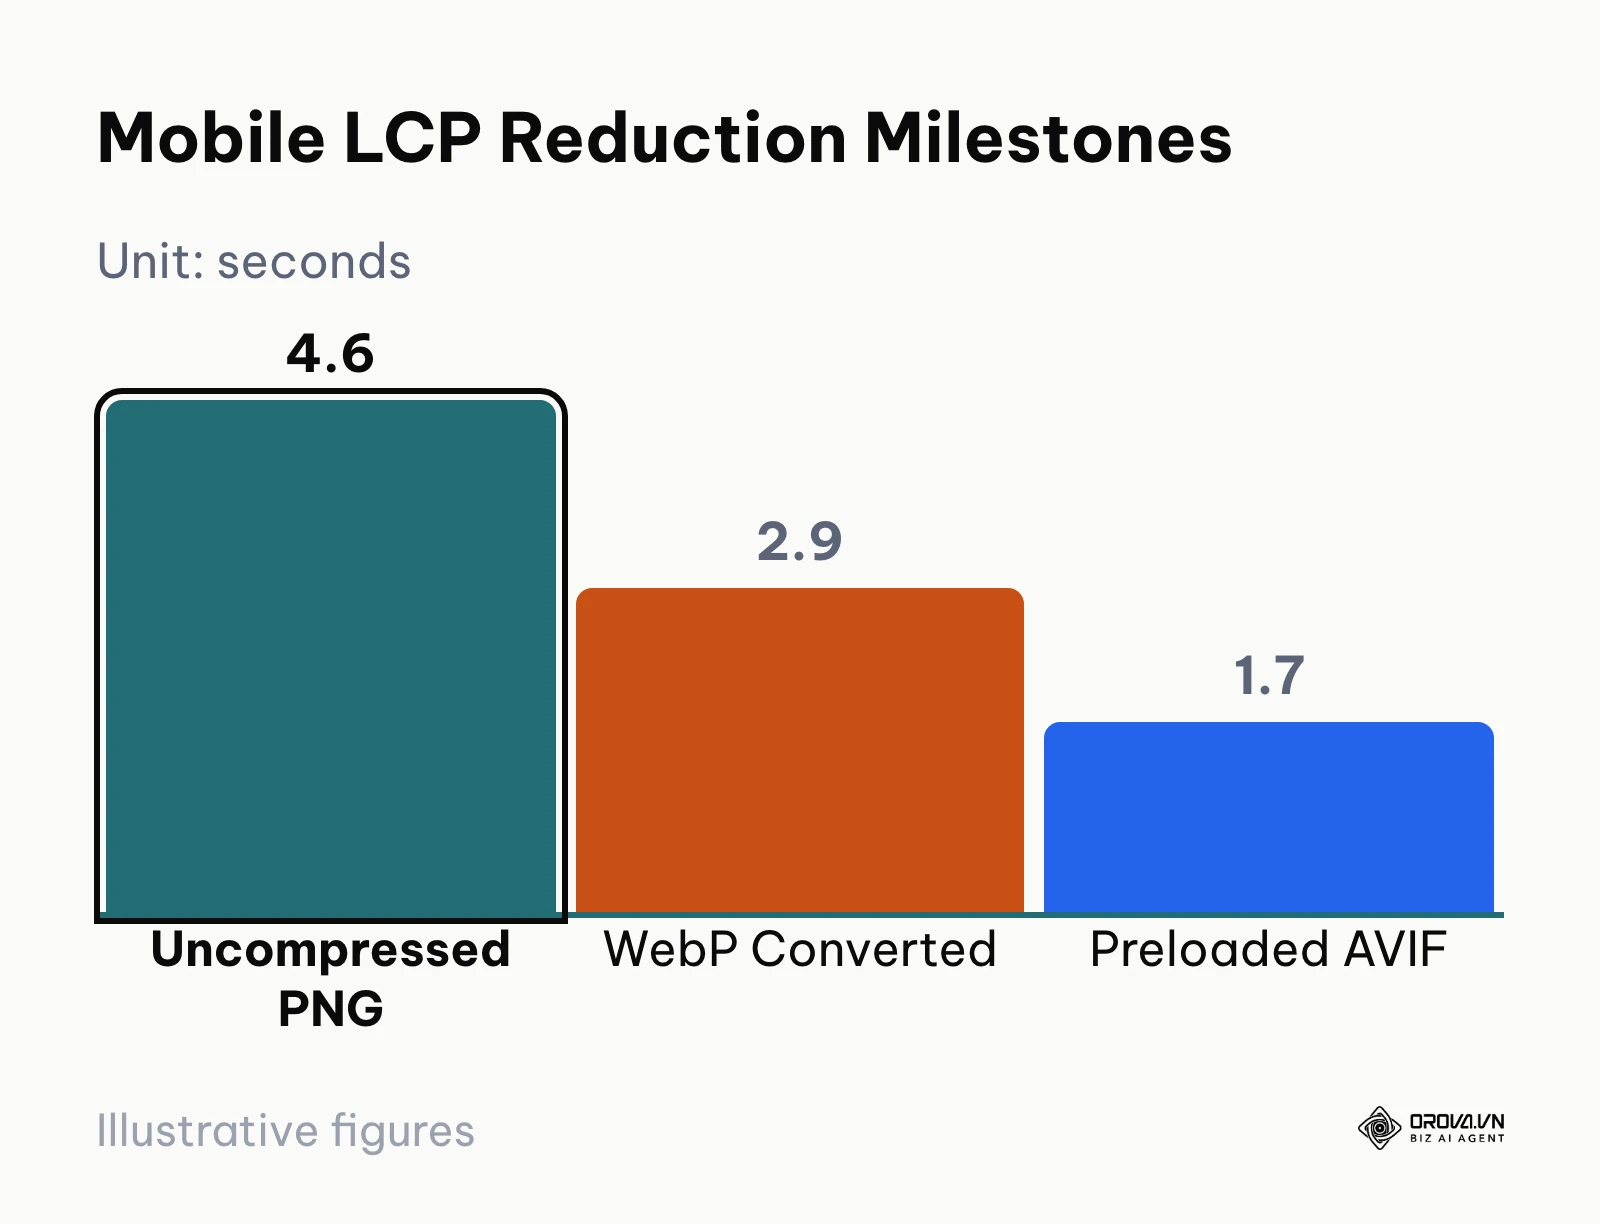
Illustrative example: An international B2B equipment distributor noticed their product category pages suffered an average mobile LCP of 4.6 seconds, failing Search Console benchmarks. The engineering team inspected the template in Chrome DevTools, identified a 2.4-megabyte uncompressed PNG banner inside the category header, and discovered the image was dynamically injected via client-side JavaScript. They converted the image to a 110-kilobyte AVIF format, hard-coded the image tag directly into the server-rendered HTML template, and added a <link rel="preload"> directive. When testing on a 4G throttled connection, the browser began fetching the banner immediately on connection handshake. The category template achieved a stable mobile LCP of 1.7 seconds, successfully turning the Search Console status from red to green across 340 indexed URLs.
Step 3: Optimize Interaction to Next Paint and Eliminate JavaScript Long Tasks
Your objective in this step is to keep Interaction to Next Paint (INP) under 200 milliseconds by preventing heavy JavaScript executions from blocking the browser's main thread during user interactions.
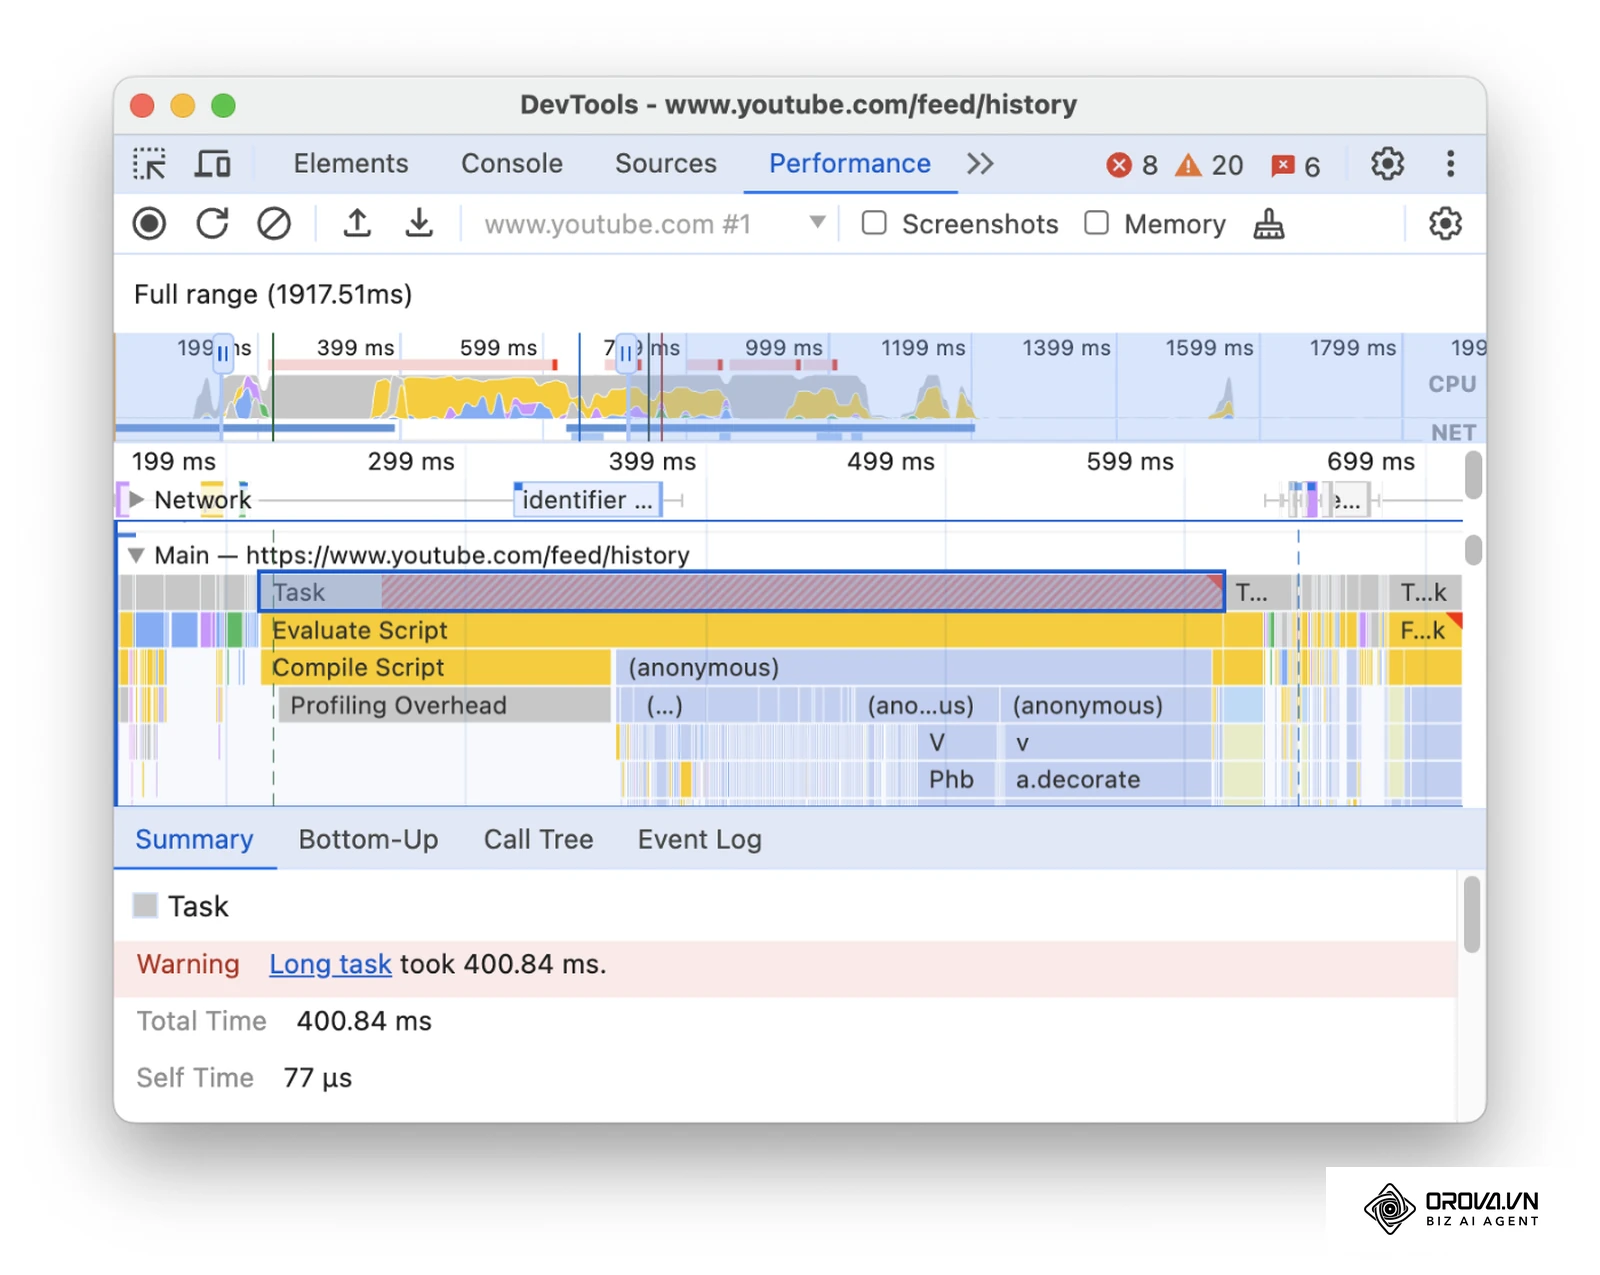
In March 2024, Google officially replaced First Input Delay (FID) with Interaction to Next Paint (INP) as a Core Web Vital. As of 2026, INP stands as the definitive standard for assessing web interface responsiveness. The W3C Long Tasks API defines any main-thread task that runs longer than 50 milliseconds as a long task, because it can delay the browser's response to user input. When a visitor taps a navigation menu, expands an accordion, or clicks an "Add to Cart" button, the browser must process the underlying script and present visual feedback on the next display frame. If the main thread is occupied running monolithic JavaScript bundles, the interface freezes, frustrating the visitor and triggering an INP penalty.
Open Chrome DevTools, select the Performance panel, and start a manual recording. Click interactive elements on your page, such as your mobile hamburger navigation, product filter checkboxes, or tab switchers. Stop the recording and inspect the "Main" thread lane. Look for gray bars with red diagonal stripes labeled "Long Task". Click on any task exceeding 50 milliseconds to inspect the bottom summary tab and identify the offending function call.
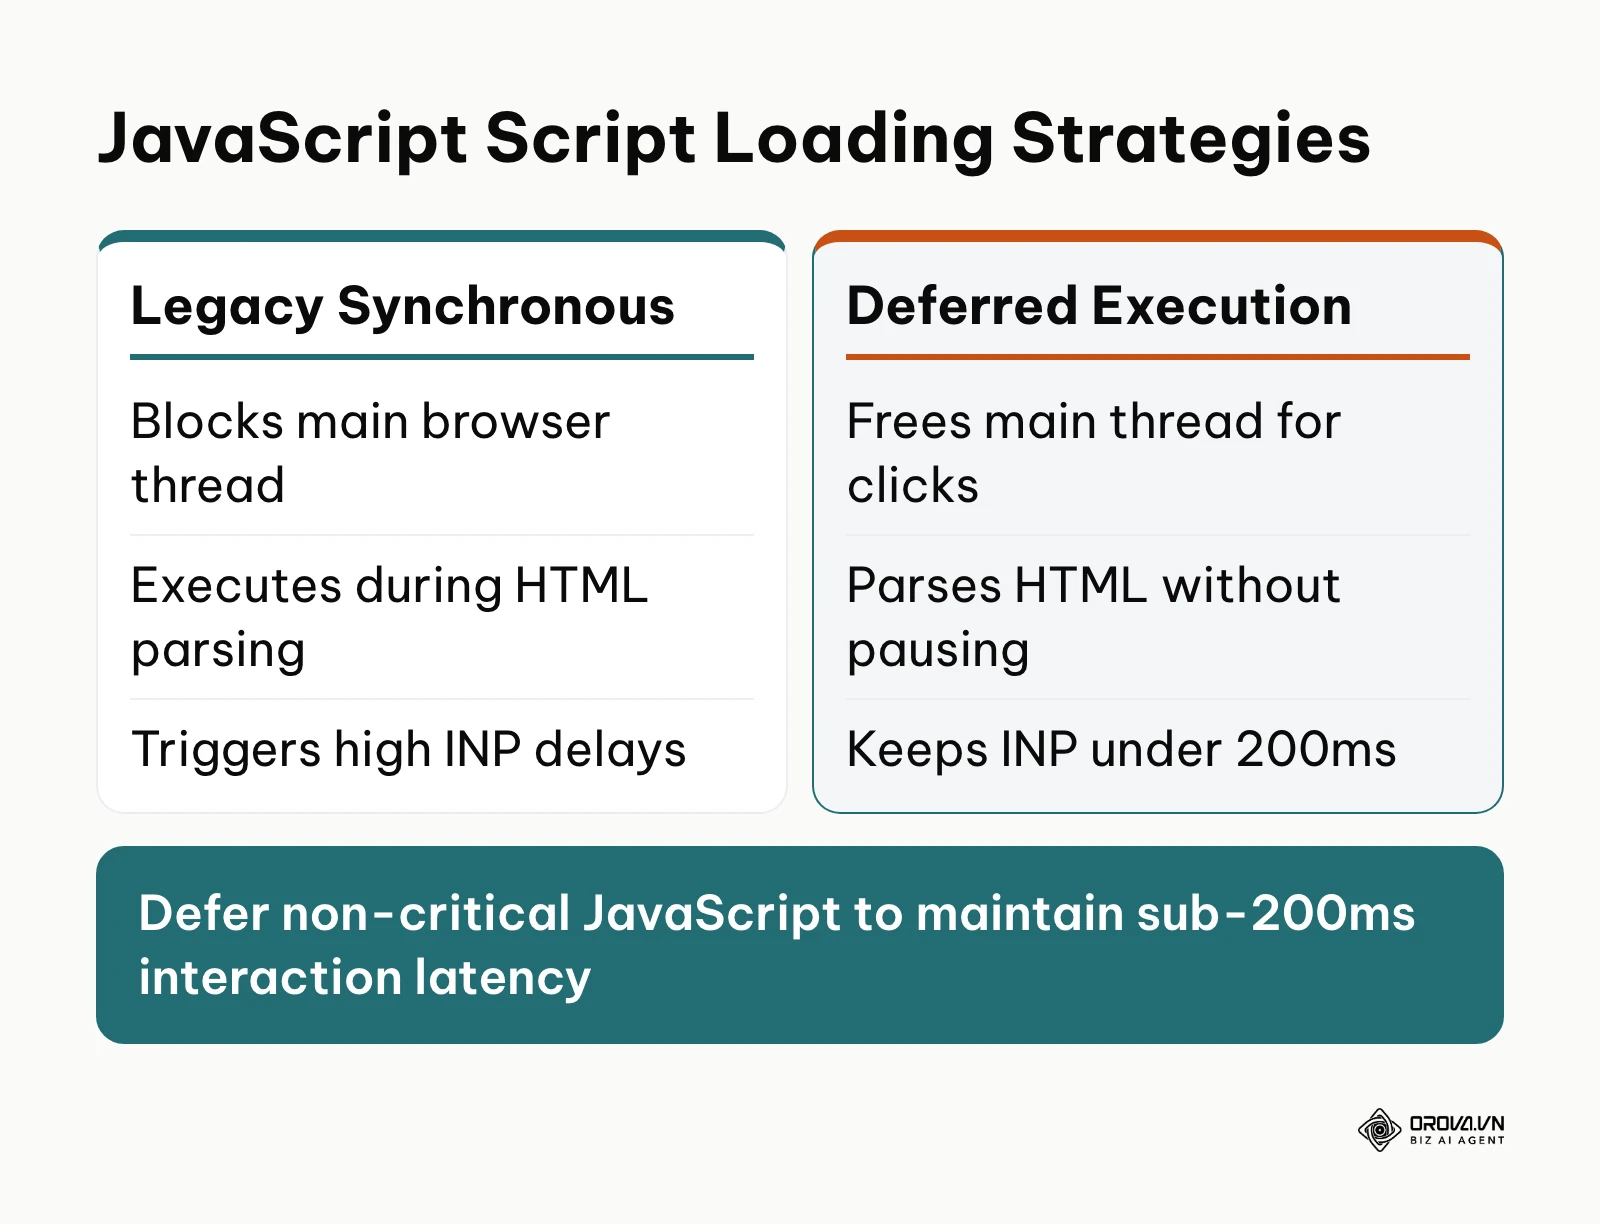
To eliminate these interaction delays, implement two code adjustments:
- Break apart large monolithic functions into asynchronous micro-tasks using the native scheduler.yield() API or setTimeout(..., 0). This returns processing control to the browser between script segments, allowing user taps to register immediately.
- Defer all non-essential third-party analytics, heatmap recorders, and live chat scripts by adding the defer or async attribute to their HTML script tags, or load them via Google Tag Manager triggered strictly on window.onload rather than container initialization.
You know this step is completed correctly when you tap buttons during a DevTools Performance recording and every interaction registers an input delay of less than 200 milliseconds, with no red long-task warnings attached to user event handlers.
The most frequent mistake in INP remediation is wrapping heavy state updates in arbitrary CSS animation classes without yielding the main thread. Visual animations cannot mask a frozen main thread because the browser compositor thread remains blocked from painting updated frames. Break up the underlying computation rather than masking it with styling.
Step 4: Eliminate Cumulative Layout Shifts Across Responsive Viewports
Your objective in this step is to eliminate unexpected visual page jumps and achieve a Cumulative Layout Shift (CLS) score of less than 0.1 across all screen dimensions.
Layout shifts occur when visible DOM elements change their starting coordinates from one rendered frame to the next without preceding user input. This defect commonly happens when images load without reserved dimensions, third-party advertising banners inject dynamically, or custom web fonts swap abruptly over system fallback typefaces.
Open DevTools, open the Rendering drawer (press Ctrl+Shift+P or Cmd+Shift+P, type "Rendering", and select "Show Rendering"), and check the "Layout Shift Regions" checkbox. Reload your page and scroll down slowly. Any page element that causes content below it to move suddenly will flash with a bright blue overlay.
Apply three standard fixes to eradicate these shifts:
- Ensure every <img>, <video>, and <iframe> tag contains explicit width and height attributes in the HTML markup (for example, <img src="diagram.webp" width="800" height="400" alt="Architecture">). This allows the browser to calculate the container's aspect ratio and reserve layout space before the actual media file finishes downloading.
- For dynamic programmatic ad slots or promotional alert bars, reserve container dimensions in your global stylesheet using CSS min-height or the aspect-ratio property:
.ad-slot-container {
  min-height: 250px;
  display: block;
}
- Prevent layout instability caused by web font swaps (Flash of Unstyled Text) by using modern font display properties:
@font-face {
  font-family: 'Inter';
  src: url('/fonts/inter.woff2') format('woff2');
  font-display: swap;
  size-adjust: 98%;
}
You know this step is successful when the Layout Shift Regions tool in DevTools shows zero blue rectangles during initial page load, and your CLS score in the Performance summary panel reads below 0.1.
A widespread error is reserving layout boxes using absolute positioning without setting container heights on parent wrappers. When the content finally loads inside an unconstrained wrapper, surrounding content reflows violently across mobile breakpoints. Always set explicit constraints on the container level.
Step 5: Resolve Technical Indexation and Crawl Hygiene in Search Console
Your objective in this step is to eliminate crawl waste and ensure search engine crawlers discover, render, and index your primary commercial content without hitting redirect loops or error status codes. For an in-depth framework on diagnosing crawl issues without paid software, consult our guide on how to audit a website for SEO without paid tools.
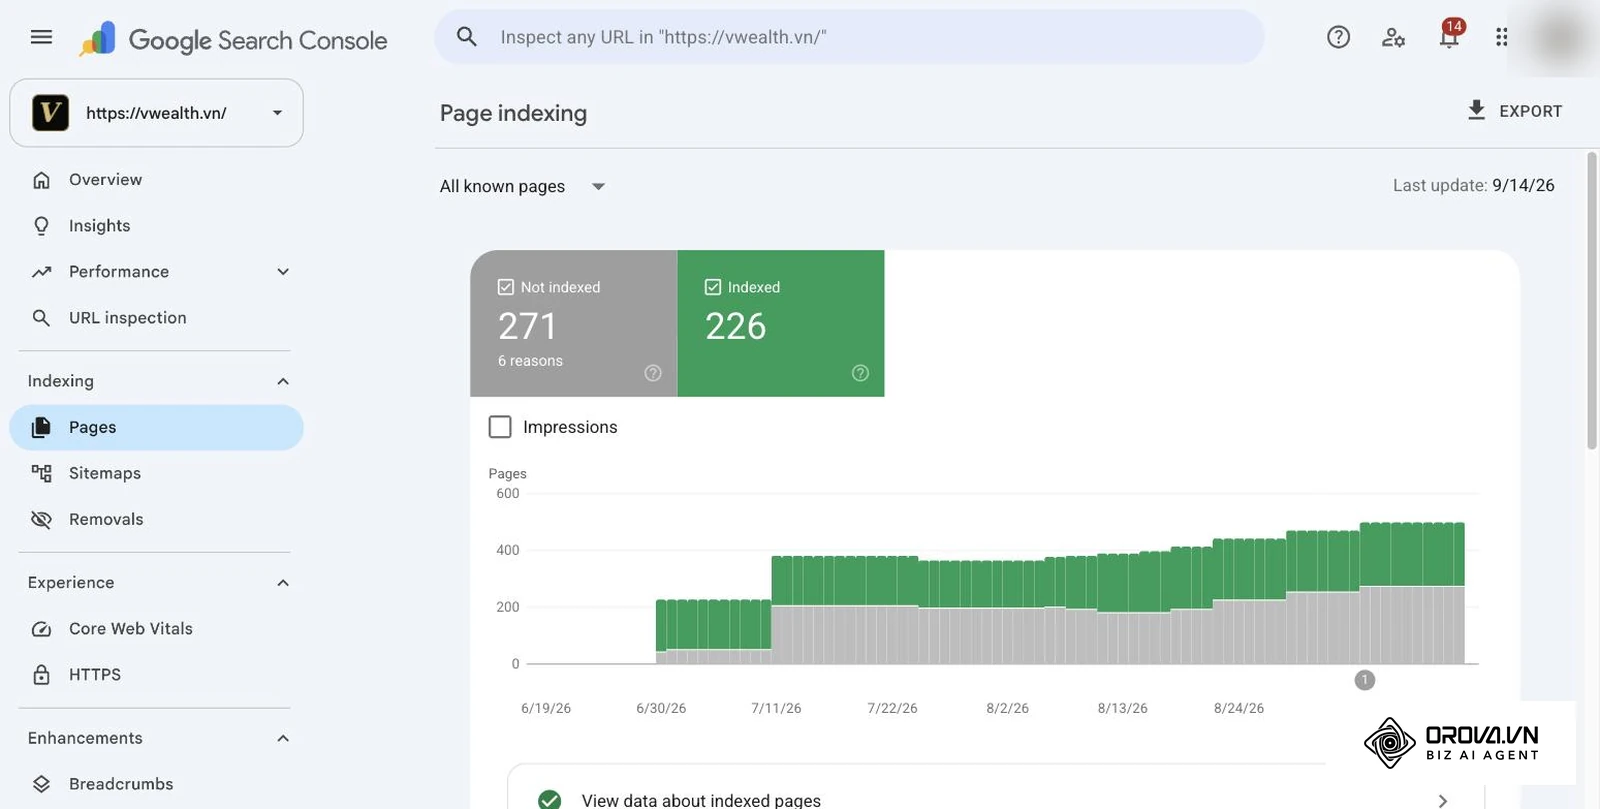
Navigate to Google Search Console and click on the "Pages" report under the Indexing menu. Scroll down to the table labeled "Why pages aren’t indexed". Review the individual exclusion categories, paying specific attention to three systemic issues:
- Crawled - currently not indexed: This status indicates Google found the URL and spent computing resources crawling it, but decided the content quality, uniqueness, or internal linking structure did not warrant entering the search index.
- Alternate page with proper canonical tag: Verify that your canonical tags point strictly to the definitive URL version. Ensure your canonical declarations use absolute HTTPS paths, consistent trailing slashes, and identical capitalization.
- Page with redirect: Excessive redirect chains (URL A pointing to URL B, which points to URL C) waste search engine crawl budgets and slow down page resolution. Update your internal links across your navigation and body content to link directly to the final destination URL.
Next, open your domain's live robots.txt file by visiting yourdomain.com/robots.txt in a web browser. Verify that your directives do not inadvertently disallow vital CSS, JavaScript, or image assets. Search engine bots must execute client-side scripts and CSS rules to render pages accurately for mobile indexing.
You know this step is completed correctly when your GSC Page Indexing report shows a steady upward trajectory in "Indexed" URLs, while non-indexed error categories show a downward trend over consecutive weekly crawls.
A critical mistake in technical indexation management is using noindex meta tags on pages that simultaneously carry canonical tags pointing to other URLs. When search engines process contradicting signals, they may disregard the canonical relationship entirely or drop both URLs from the index. If a page is meant to be indexed via a canonical target, leave the canonical reference intact and remove the noindex directive.
Illustrative example: A SaaS company managing a content catalog of 800 articles discovered that over 300 product comparison pages were categorized under "Crawled - currently not indexed" in Google Search Console. The technical team inspected the URLs and noticed two conflicting setups: internal site filters generated dynamic query parameters that were linked in the main footer, and the server was serving inconsistent HTTP headers without self-referential canonical tags on pagination links. The team updated the CMS logic to strip dynamic tracking parameters from internal links, implemented rigid self-referential canonical tags on all indexable articles, and submitted an updated XML sitemap containing only clean status-200 URLs. Within twenty-one days, Google reassessed the cluster, successfully moving 285 of the previously excluded pages into the active search index.
Discover Orova.vn – a Biz AI Agent platform with OROVA SEO, a complete solution for every website. The system supports search engine optimization from A to Z with features including keyword research, writing new SEO-ready articles, optimizing existing content, rank tracking, plus competitor analysis and in-depth technical analysis. Sign up today to experience OROVA SEO completely free (offer valid through July 7, 2027).
Step 6: Align Page Architecture with Search Intent and Query CTR
Your objective in this step is to audit your ranking pages against actual search query intent, eliminating internal keyword cannibalization and optimizing low-performing click-through rates. Performing a structured content audit provides the inventory data necessary to execute this step effectively.
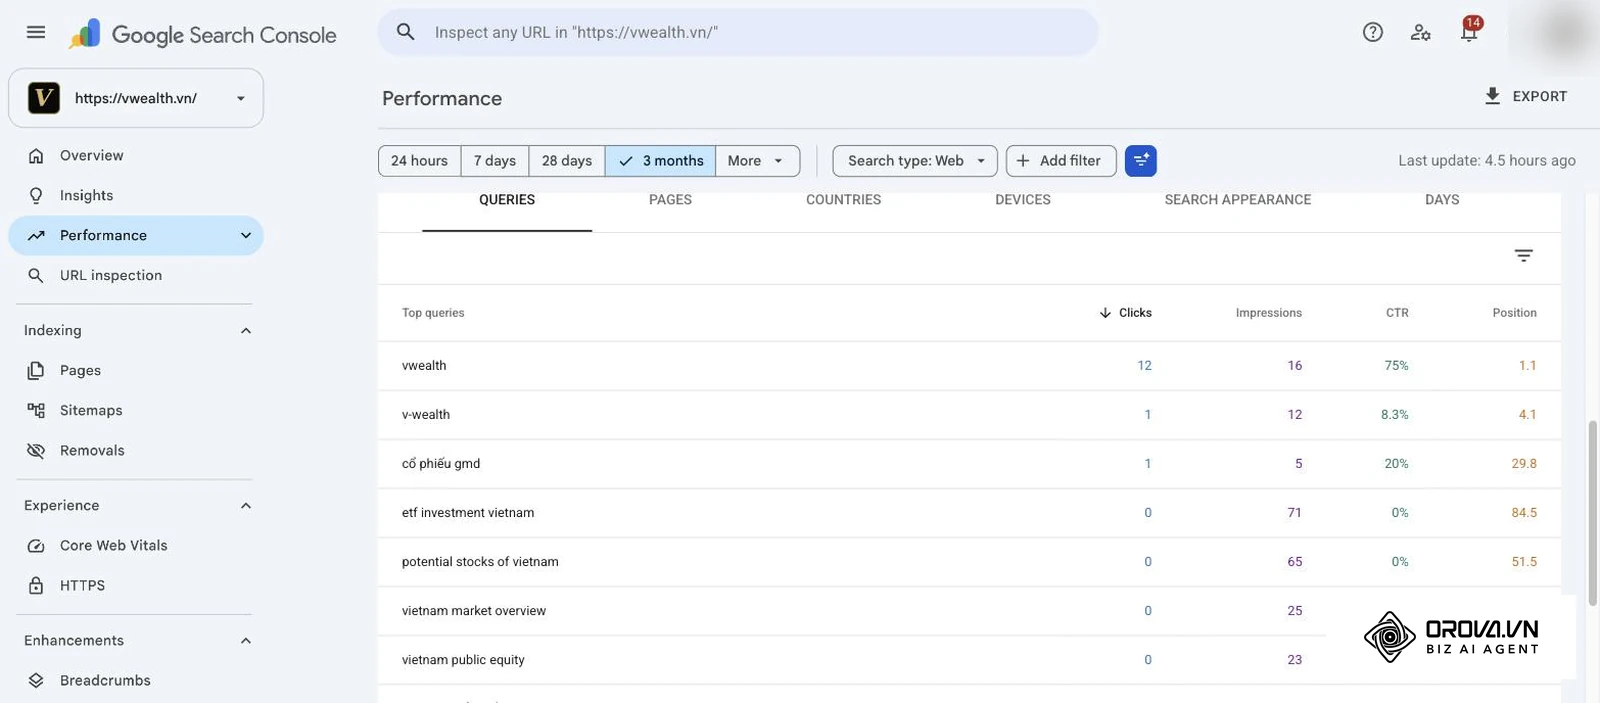
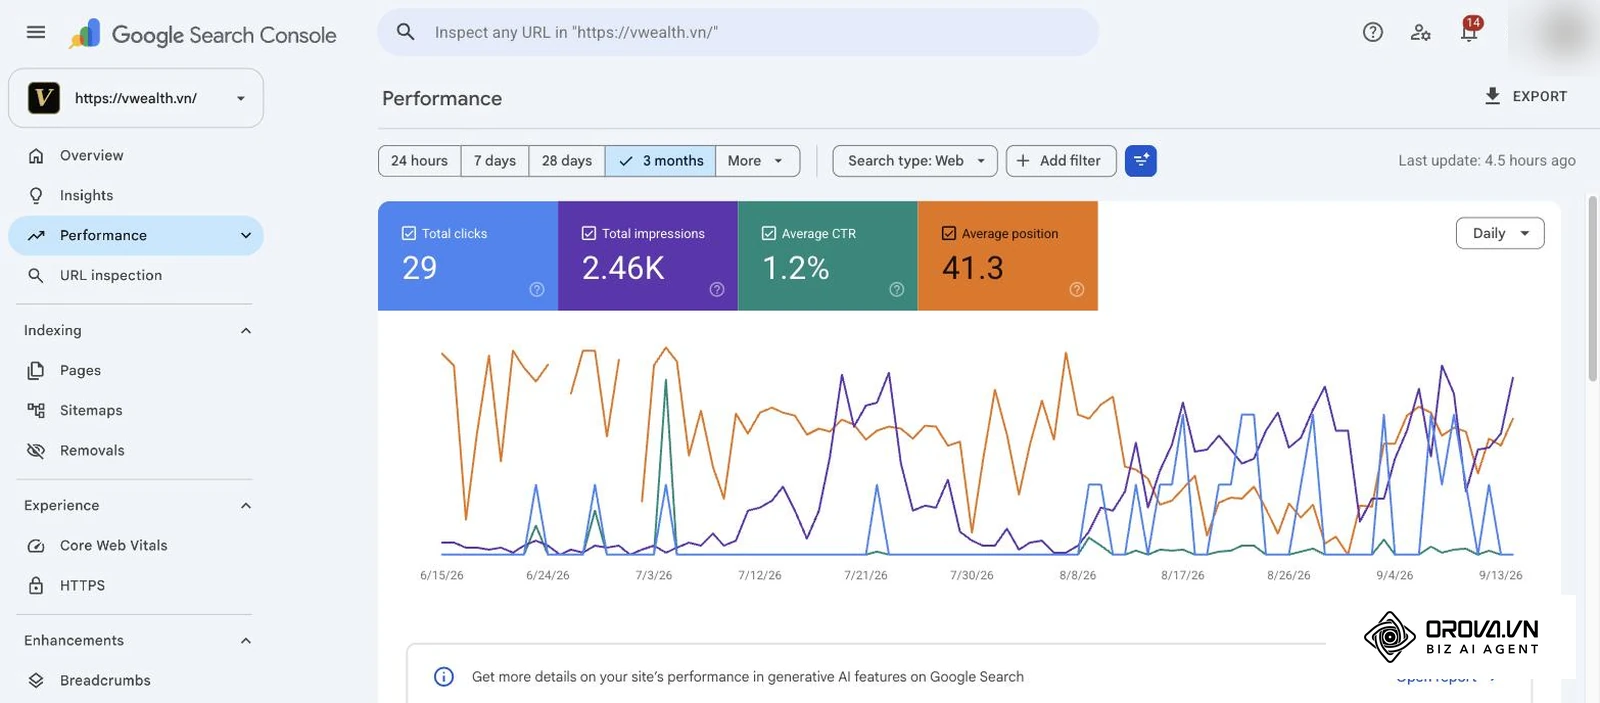
Open Google Search Console and select the Performance report on the left sidebar. Set the date filter to compare the last three months with the previous period. Enable all four metric checkboxes: Total Clicks, Total Impressions, Average CTR, and Average Position. Click on the Pages tab, select a primary revenue URL, and switch to the Queries tab.
Filter queries by Average Position between 4.0 and 15.0. These terms represent "striking distance" queries where your page already demonstrates topic relevance in Google's index, but lacks the specific structural relevance or depth required to claim top-three visibility. Perform a systematic keyword gap analysis against the URLs currently outranking you for these specific striking-distance terms.
Execute three structural optimizations on the target URL:
- Search Intent Realignment: Compare the search results page (SERP) layout for your target query. If top-ranking pages all present step-by-step guides, transform your marketing overview into an actionable operational workflow. If top results feature comparative tables, introduce a structured comparison section.
- Title and Meta Description Calibration: If your average position is 4.2 but your organic CTR sits below 2.0%, rewrite your <title> tag. Place the primary keyword within the first 60 characters and state an explicit, quantifiable benefit (such as a verified timeframe, step count, or tangible result).
- Heading Hierarchy and Semantic Density: Structure your body copy with logical H2 and H3 tags answering specific sub-questions that searchers frequently pair with the main topic. Ensure technical terms are explained succinctly in their initial sentence.
You know this step is successful when the selected URL demonstrates an increase in Average CTR and gains average position over the two to four weeks after Google recrawls the page. Rankings are never guaranteed, so judge the change by the trend, not a single day.
The most common failure mode during on-page refinement is keyword stuffing: shoehorning exact-match query variants into every H2 and paragraph. Modern search engines use semantic neural embeddings to evaluate topical completeness. Repeating the same keyword mechanically degrades user readability, raises bounce rates, and damages organic rankings. Write naturally for human professionals while structuring headings logically.
Step 7: Streamline Conversion Paths and Eliminate User Friction
Your objective in this step is to systematically remove friction from high-intent conversion pathways, ensuring organic visitors can complete purchases or inquiries without encountering technical friction. Once you secure search traffic, applying dedicated conversion rate optimization techniques ensures that traffic converts into measurable pipeline value.
Open Google Analytics 4 and navigate to the Explore section on the left menu. Create a new Funnel Exploration report. Construct a multi-step user journey representing your core commercial path (for example: Step 1 = Session Start on Landing Page, Step 2 = Click Primary CTA, Step 3 = View Lead or Checkout Form, Step 4 = Form Submission or Purchase Complete). Examine the abandonment percentage between each sequential funnel step.
To eliminate drop-offs along the conversion path, execute three usability improvements:
- Form Field Minimization: Audit your lead capture or checkout forms. Remove non-essential fields such as secondary phone numbers, company fax numbers, or redundant billing addresses. Every additional form field introduces cognitive friction and depresses mobile submission rates.
- Sticky Mobile Call-to-Action: On mobile viewports where long educational content requires substantial vertical scrolling, implement a fixed, non-intrusive bottom bar housing your primary CTA button. Ensure this element does not obscure body copy or trigger layout shifts.
- Immediate Visual Confirmation: When a user clicks a submit button, provide immediate visual feedback via a loading state or progress bar. Never leave a button in an unclickable, unresponsive state while background APIs process form webhooks.
| Funnel step (GA4 Funnel Exploration) | What to check | Typical friction to remove |
|---|---|---|
| 1. Landing page session start | Share of sessions that scroll past the first screen | Slow LCP, layout shifts above the fold |
| 2. Primary CTA click | Click-through from landing page to form or cart | CTA hidden below long copy, no sticky mobile button |
| 3. Form or checkout view | Drop-off between view and first field interaction | Too many fields, unclear required fields |
| 4. Submission or purchase complete | Drop-off between form view and completion | Silent validation errors, no loading feedback on submit |
You know this step is completed correctly when your GA4 Funnel Exploration demonstrates a measurable decrease in abandonment between the form view step and the successful completion step.
A recurring blunder in conversion design is introducing intrusive modal popups or aggressive subscription overlays the moment a visitor lands on the page. Interstitial popups on mobile devices frustrate searchers, degrade your Core Web Vitals responsiveness, and frequently run afoul of Google's mobile interstitial policies. Confine opt-in prompts to contextual inline placements or exit-intent desktop triggers.
Illustrative example: A boutique financial advisory consultancy noticed their primary appointment booking page received 4,200 monthly organic visitors from search, but generated only 38 completed consultations, reflecting a weak 0.9% conversion rate. Their GA4 Funnel report revealed an 82% abandonment rate on the initial booking modal. The team audited the form and found it required twelve mandatory fields, including full residential addresses and annual household income tiers, before allowing calendar date selection. They redesigned the booking flow: reducing initial input to just three fields (Full Name, Work Email, and Business Subject) while moving financial qualification questions to a post-booking confirmation screen. Within thirty days of deploying the streamlined form, completed consultation bookings increased to 118 per month from the same traffic volume, elevating the conversion rate to 2.8% without increasing ad spend.
The 20-Point Site Optimization Priority Matrix (Impact vs Effort)
When engineering teams attempt to fix every technical and content issue simultaneously, projects stall. The priority matrix below classifies twenty essential site optimization tasks into four operational quadrants based on business impact and implementation effort.
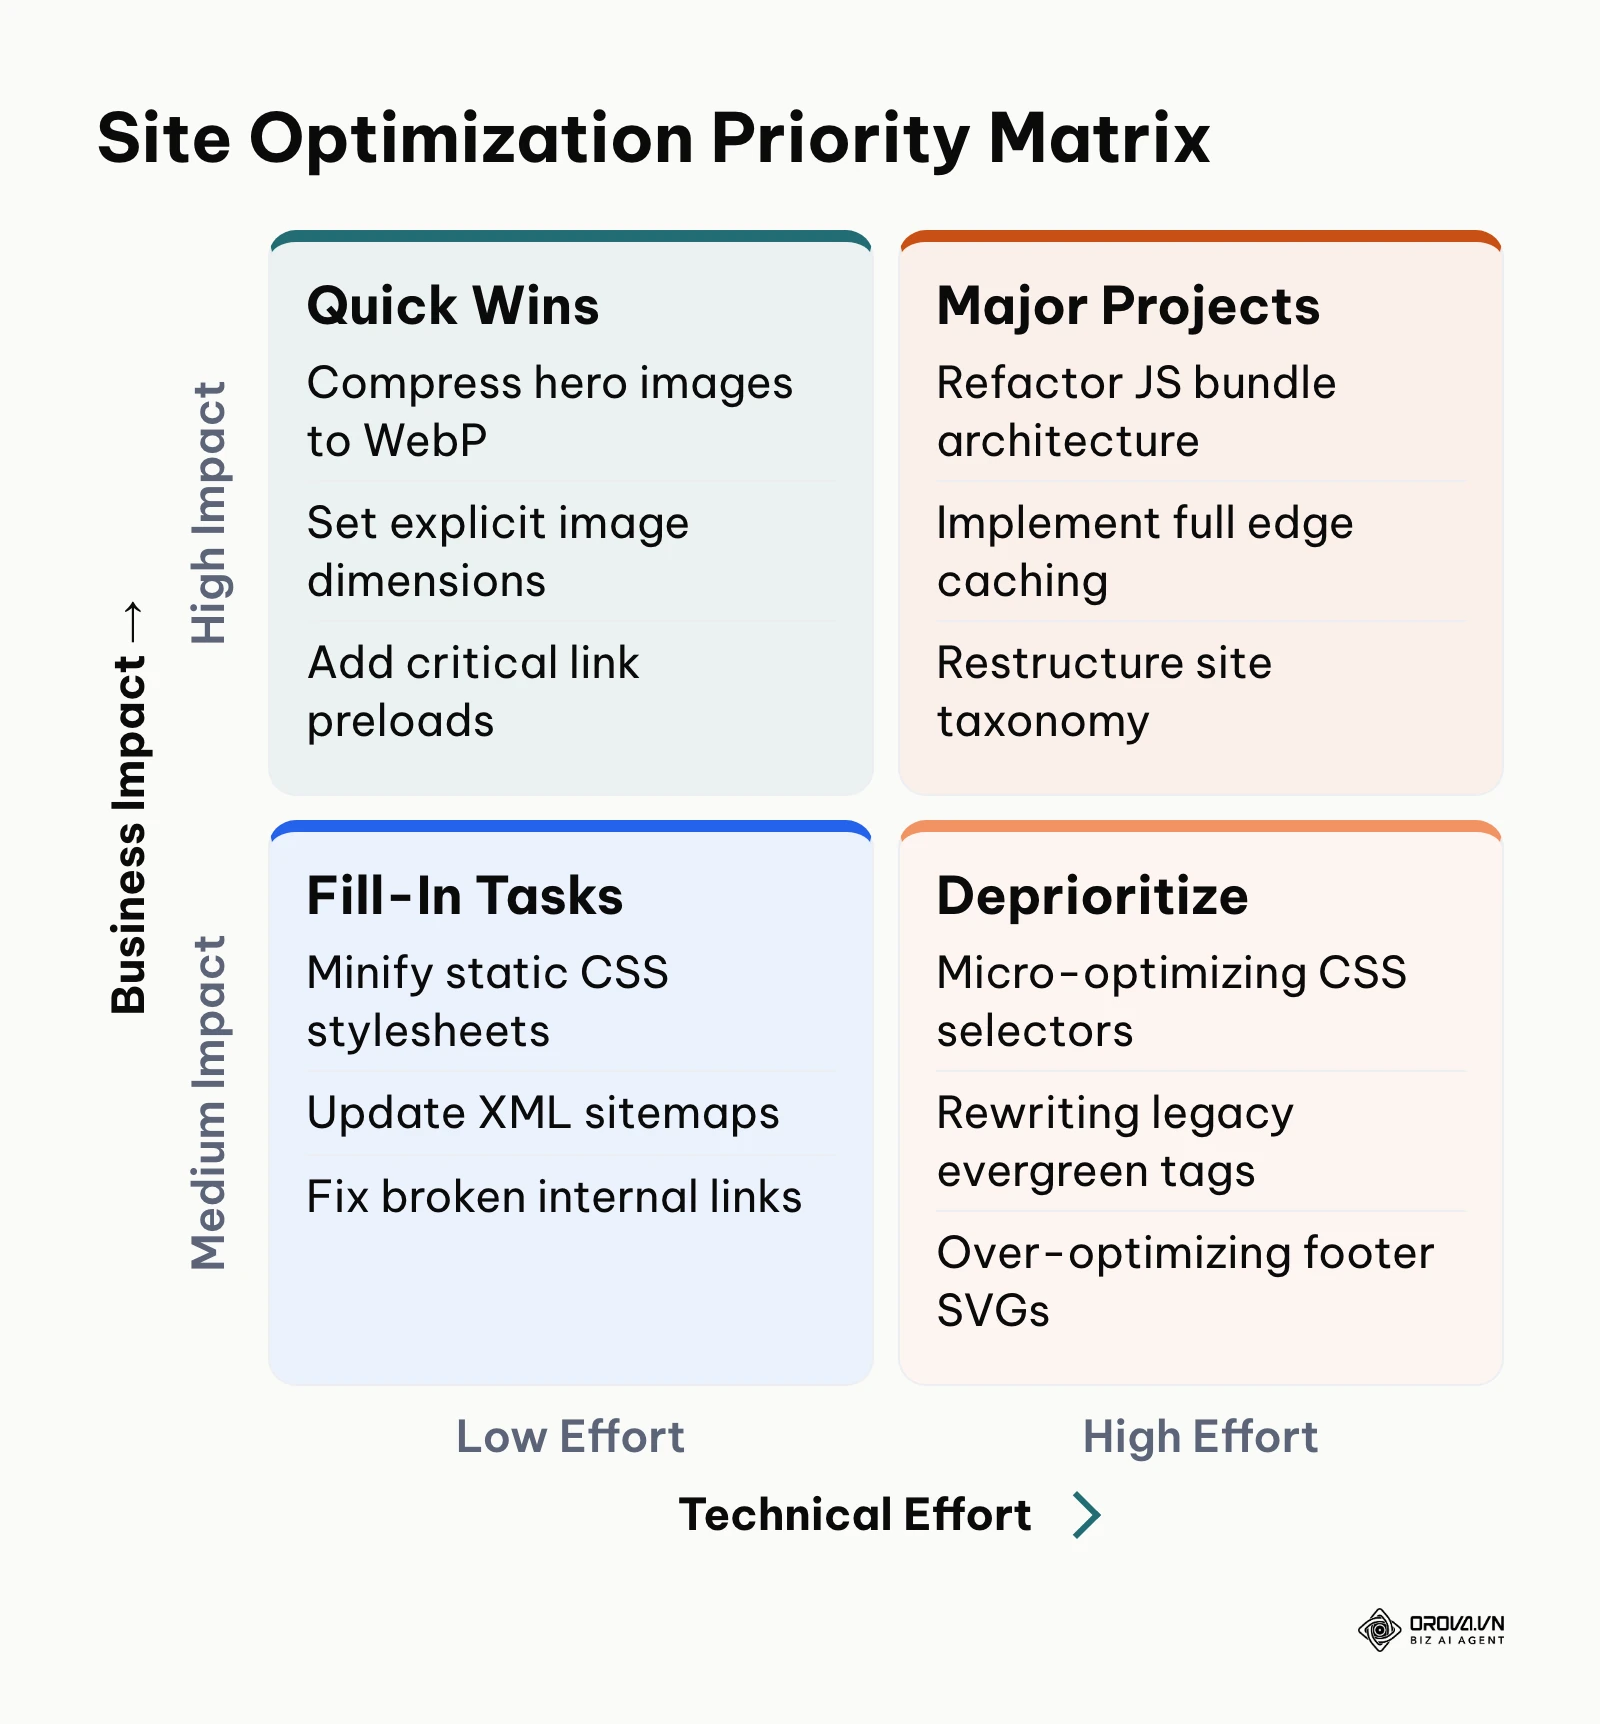
| Optimization Task | Impact Level | Technical Effort | Primary Measurement Tool | Operational Quadrant |
|---|---|---|---|---|
| Convert images to WebP/AVIF format | High | Easy | Google PageSpeed Insights | Quick Win (Execute First) |
| Declare explicit image width and height | High | Easy | Chrome DevTools Elements | Quick Win (Execute First) |
| Preload critical LCP hero image asset | High | Easy | Chrome DevTools Network | Quick Win (Execute First) |
| Add caching headers for static resources | High | Easy | Server Configuration / .htaccess | Quick Win (Execute First) |
| Remove render-blocking CSS in head | High | Hard | PageSpeed Coverage Report | Major Project (Plan Sprint) |
| Refactor JS bundles to break Long Tasks | High | Hard | Chrome DevTools Performance | Major Project (Plan Sprint) |
| Consolidate cannibalizing URLs via 301 | High | Hard | Google Search Console Pages | Major Project (Plan Sprint) |
| Restructure site internal link hierarchy | High | Hard | Screaming Frog / GSC Links | Major Project (Plan Sprint) |
| Deploy Edge CDN caching for HTML pages | High | Hard | Cloudflare / Fastly Dashboard | Major Project (Plan Sprint) |
| Minify global CSS and JavaScript files | Medium | Easy | Build Tool / Webpack / Vite | Fill-In Task (Do When Free) |
| Fix broken internal links (404 status) | Medium | Easy | Google Search Console Pages | Fill-In Task (Do When Free) |
| Update and submit XML sitemaps | Medium | Easy | Google Search Console Sitemaps | Fill-In Task (Do When Free) |
| Standardize canonical tag formatting | Medium | Easy | Page Source HTML Inspection | Fill-In Task (Do When Free) |
| Compress SVG icons and decorative graphics | Medium | Easy | SVGO / Local CLI Optimizer | Fill-In Task (Do When Free) |
| Implement schema structured data markup | Medium | Easy | Google Rich Results Test | Fill-In Task (Do When Free) |
| Optimize web font loading via font-display | Medium | Easy | DevTools Network Font Panel | Fill-In Task (Do When Free) |
| Micro-optimize CSS selector specificity | Medium | Hard | Chrome DevTools CSS Profiler | Low Priority (Deprecate) |
| Rewrite legacy blog titles with minor volume | Medium | Hard | Google Search Console Search | Low Priority (Deprecate) |
| Audit legacy redirect chains under 3 hops | Medium | Hard | Server Access Logs | Low Priority (Deprecate) |
| Re-render legacy PNG icons into SVG vectors | Medium | Hard | Vector Graphic Software | Low Priority (Deprecate) |
The Financial ROI of Site Optimization: A Quantitative Revenue Model
Marketers and developers often struggle to justify optimization budgets because technical performance improvements are discussed using latency scores rather than business revenue. To demonstrate the financial return on investment of technical site optimization, use the standard commercial revenue formula shown below:
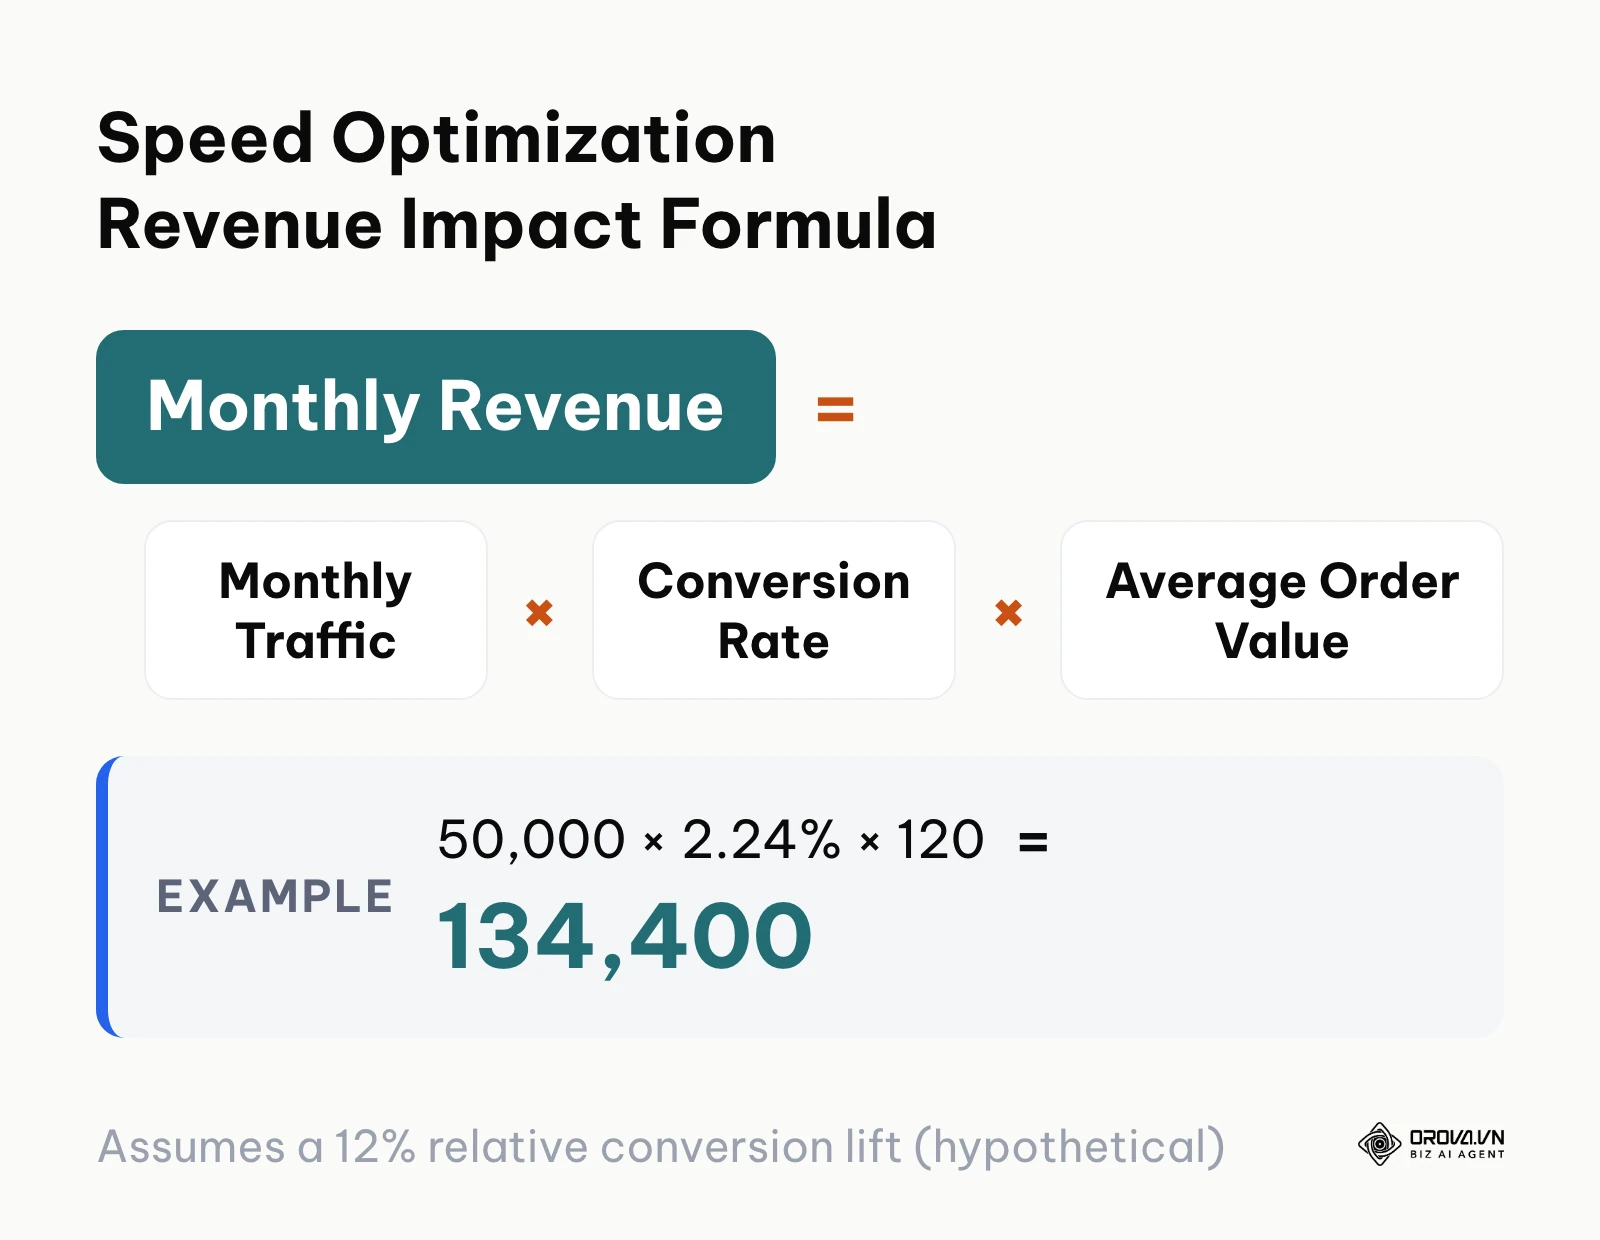
Monthly Revenue = Monthly Organic Traffic × E-Commerce / Lead Conversion Rate × Average Order Value (AOV)
Consider a hypothetical example. A website receives 50,000 monthly organic visitors on its transaction and product catalog pages. The site currently suffers from an average mobile page load latency of 4.0 seconds, yielding an overall baseline conversion rate of 2.0% with an Average Order Value of 120 (all amounts below are in your store currency).
Baseline Monthly Revenue = 50,000 visitors × 2.0% CVR × 120 AOV = 120,000 / month
The engineering team executes Steps 2, 3, and 4 of this guide, reducing the Largest Contentful Paint from 4.0 seconds to 1.8 seconds and resolving all layout shift bugs. For this illustrative scenario, assume the faster pages lift the conversion rate by 12% in relative terms. This is a hypothetical assumption, not an industry benchmark; replace it with the lift you measure in your own GA4 data.
Applying the assumed 12% relative conversion improvement to the baseline figure:
New Conversion Rate = 2.0% × (1 + 0.12) = 2.24%
Recalculating the monthly revenue model using the optimized site performance metrics:
Optimized Monthly Revenue = 50,000 visitors × 2.24% CVR × 120 AOV = 134,400 / month
The absolute financial return generated by engineering a 2.2-second speed reduction is:
Monthly Net Revenue Lift = 134,400 − 120,000 = 14,400 / month
Annualized Revenue Impact = 14,400 × 12 months = 172,800 / year
This model shows that technical website optimization is not merely an engineering chore; it operates as an active financial lever that drives measurable top-line revenue without requiring an increase in organic traffic acquisition budgets.
Master Site Optimization Checklist
Use this consolidated operational checklist as a printable reference throughout your optimization sprints.
| Step Number | Core Optimization Task | Verifiable Completion Criteria | Estimated Time Required |
|---|---|---|---|
| Step 1 | Establish diagnostic baselines | 75th percentile LCP, INP, and CLS scores logged from GSC and CrUX | 45 minutes |
| Step 2 | Eliminate LCP bottlenecks | Mobile LCP element renders under 2.5s with AVIF/WebP preloaded | 90 minutes |
| Step 3 | Optimize INP & split Long Tasks | All user interactions register under 200ms in DevTools Performance | 120 minutes |
| Step 4 | Stabilize layout shifts (CLS) | Media tags carry explicit width/height; CLS registers under 0.1 | 60 minutes |
| Step 5 | Resolve indexation & crawl hygiene | Search Console confirms zero valid URLs blocked by robots.txt or tags | 60 minutes |
| Step 6 | Realign intent & query CTR | Top striking-distance queries mapped to updated headings and titles | 90 minutes |
| Step 7 | Streamline conversion pathways | GA4 Funnel Exploration confirms reduced abandonment on forms | 45 minutes |
With OROVA.VN and the OROVA SEO module, you put an end to the exhausting days of manual work for good. Instead of struggling for hours to write articles and compile reports, the entire process is now optimized and completed in just 5 minutes.
Common Site Optimization Pitfalls and Troubleshooting
Even diligent engineering teams encounter snags when modifying legacy website architectures. The table below outlines six recurring optimization errors, their underlying technical causes, and actionable remediation steps.
| Observed Error / Symptom | Underlying Technical Cause | Recommended Remediation Action |
|---|---|---|
| LCP score worsens after converting images to WebP | WebP images generated at excessively high dimensions without responsive srcset | Implement responsive image markup (srcset) serving scaled dimensions matching device viewports |
| INP spikes on mobile while passing on desktop | Main thread flooded by heavy third-party tracking scripts firing on touch events | Audit Google Tag Manager; trigger analytics pixels on background worker threads or post-load hooks |
| CLS remains high despite setting image attributes | Web fonts flashing via FOIT/FOUT or dynamic cookie banner injecting without CSS wrapper | Apply CSS font-display: swap with metric overrides; wrap cookie notices in fixed-height placeholder containers |
| Crawled pages suddenly drop from search index | Accidental insertion of noindex headers via staging deployment or conflicting canonical tags | Inspect live HTTP response headers using curl; remove rogue header rules in server configuration |
| Bounce rates increase after redesigning page headings | Headings rewritten for search queries without preserving original value proposition | Rebalance H2 tags to maintain informational utility for humans while embedding target topical entities |
| Form submissions drop after introducing validation | Client-side JavaScript validation regex failing silently on mobile keyboard inputs | Test validation scripts across iOS Safari and Android Chrome; provide clear inline error messages |
When managing site health across hundreds of URLs, manual checks often miss recurring structural defects. A quick first pass is a free scan in Orova SEO Check: paste a URL and you get a score out of 100 across 92 technical criteria in 12 groups, plus Google PageSpeed mobile and desktop scores in one shareable report.
Measuring Results: Key Verification Metrics and Monitoring Cadence
Verifying the impact of technical modifications requires tracking the correct metrics within their appropriate observation windows.
Google Search Central documentation states that Core Web Vitals are used by its ranking systems, alongside many other signals. However, developers frequently make the mistake of expecting instant metric updates in Search Console reports the morning after a code deployment. Google Search Console Core Web Vitals reports rely on a rolling 28-day aggregation window drawn from genuine user sessions recorded by the Chrome User Experience Report (CrUX).
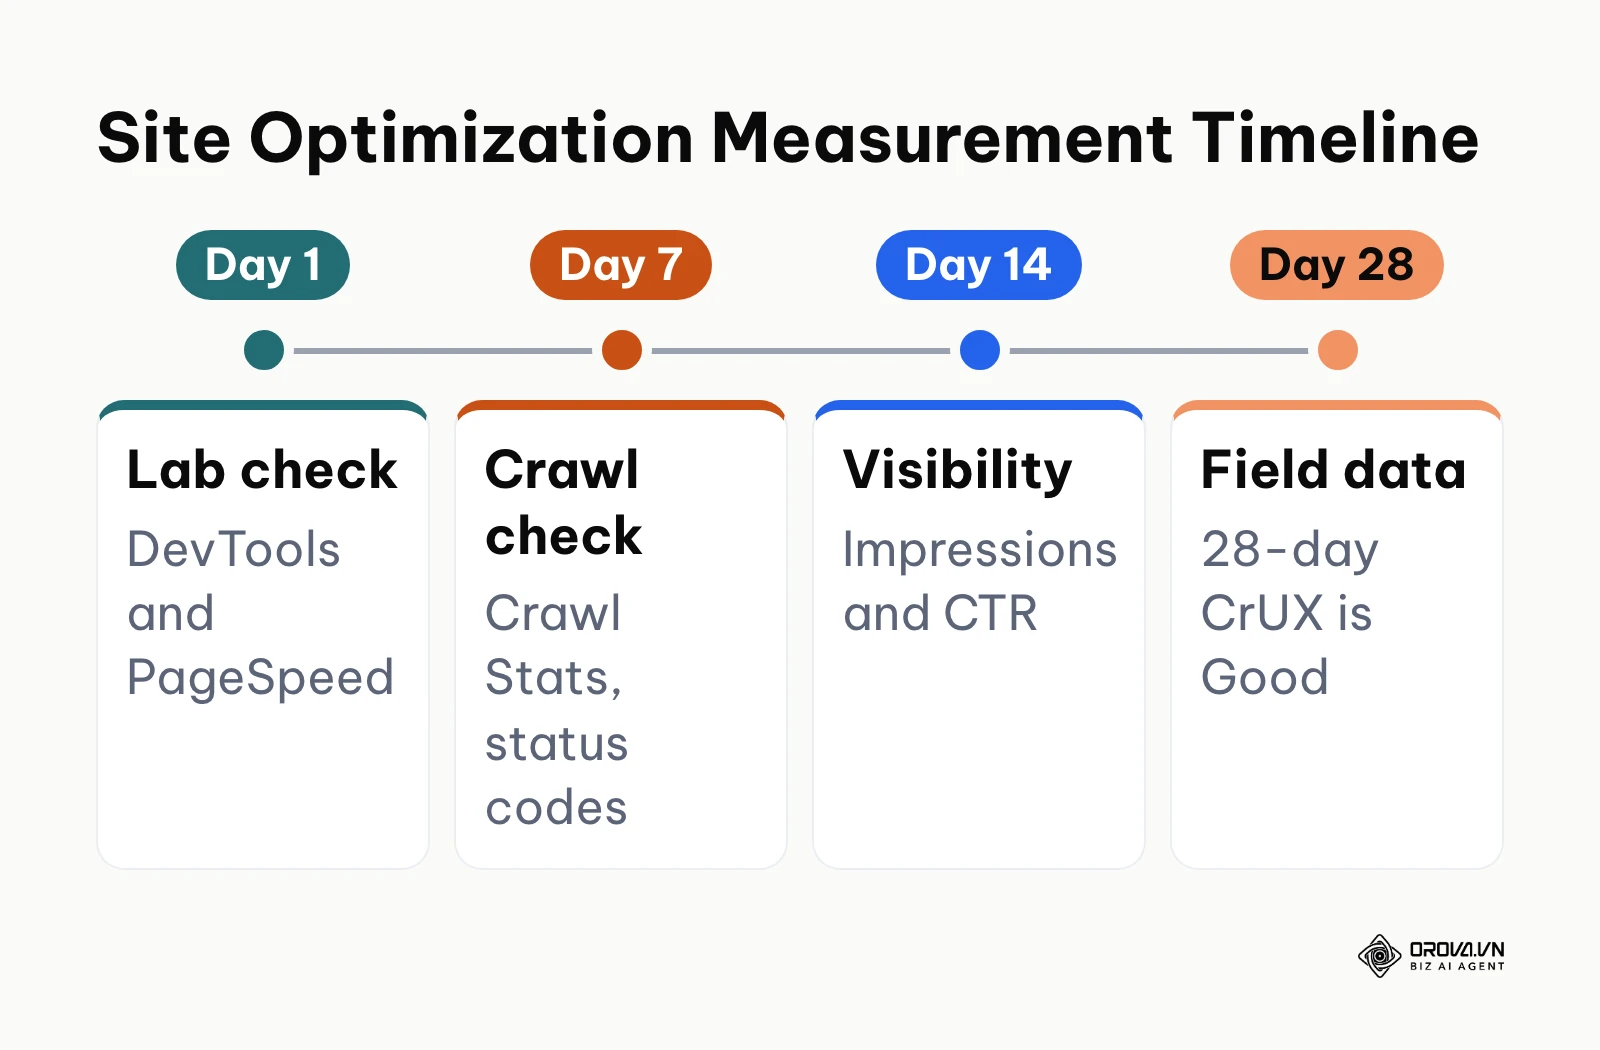
To monitor progress methodically, adhere to this four-stage verification schedule:
- Immediate Lab Verification (Day 1): Validate your changes in a local environment using Chrome DevTools and Google PageSpeed Insights. Confirm that synthetic lab scores show zero layout shifts, optimized hero preloads, and sub-200ms task profiles.
- Crawl Health and Status Codes (Day 7): Check Google Search Console's Crawl Stats report under Settings. Verify that your average server response time has decreased and that search engine crawlers are encountering clean 200 HTTP response codes without timeouts.
- Search Visibility and Click-Through Trajectory (Days 14–21): Open the Search Console Performance report. Filter by the URLs modified in Step 6. Look for early increases in organic search impressions and higher click-through rates as Google processes revised titles and content updates.
- Official CrUX Field Validation (Day 28): Open the Core Web Vitals report in Search Console. Confirm that previously flagged "Poor" or "Needs Improvement" URLs transition into the green "Good" category as the rolling 28-day window fully reflects the optimized user experiences.
Site Optimization Trends in the Coming Years: Author's Perspective
Looking at the trajectory of web standards up to 2026, I believe the way we approach website optimization is undergoing a permanent transformation. The era of optimizing a website once every two years as an isolated maintenance task has passed.
First, consider the evolution of interaction measurement. Today, webmasters focus heavily on isolated interaction snapshots like INP. Over the next two to three years, I expect search engine evaluation engines to transition toward holistic session responsiveness. Rather than measuring your single worst interaction frame, future metrics will likely evaluate responsiveness across the entire visitor lifecycle, penalizing websites that run sluggish background scripts while users scroll long pages. To prepare for this shift, engineers should minimize client-side JavaScript execution and embrace lightweight server-driven rendering architectures.
Second, the rapid emergence of generative search engines and answer engines is rewriting discoverability requirements. Crawlers powering AI answer engines do not browse the web like human visitors; they consume raw semantic information under strict time and computing budgets. In my view, pages burdened by bloated JavaScript single-page application architectures will struggle to get their content synthesized in AI summaries. By 2028, semantic HTML purity, clean schema markups, and instant headless server response times will matter just as much as visual layout elegance.
Third, I lean toward the conclusion that edge computing will largely replace traditional browser-side script execution. We are already seeing dynamic personalization, cookie management, and geolocation routing shift toward edge server workers. Moving processing tasks away from mobile hardware to edge infrastructure should reduce many client-side latency spikes.
This entire projection could prove incorrect if browser hardware capabilities leap dramatically, or if search engine crawlers deploy limitless neural compute to render client-side JavaScript without penalizing site owners. However, based on the commercial realities of infrastructure costs, betting on lean HTML, optimized assets, and edge execution remains the most dependable long-term strategy.
Frequently Asked Questions About Site Optimization
Should you prioritize Core Web Vitals or content restructuring when resources are limited?
Prioritize Core Web Vitals fixes on pages that already rank on page one of search results, because technical speed improvements directly protect and improve existing commercial conversion rates. However, if your website suffers from widespread indexation exclusions or lacks relevant content matching user intent, prioritize content restructuring first, as technical speed cannot rank a page that search engines deem irrelevant.
How can you isolate conversion gains driven by speed from design changes in GA4?
To isolate the financial impact of speed enhancements from visual redesigns, run code deployments in staggered phases separated by at least two weeks. Alternatively, conduct a controlled A/B test using server-side routing where Variant A receives the optimized, high-speed code base while Variant B retains legacy scripts, tracking the purchase or generate_lead conversion rate delta in Google Analytics 4.
How often should a business run a comprehensive site optimization audit?
A growing commercial website should conduct a lightweight technical health check every month to catch broken links, layout regressions, and newly excluded URLs in Search Console. A complete, end-to-end architectural audit encompassing Core Web Vitals, server infrastructure, and content relevance should occur on a quarterly basis or immediately following major CMS framework updates.
What role does artificial intelligence play in modern site optimization?
Artificial intelligence assists optimization workflows by automating large-scale image compression, identifying semantic keyword gaps across competitive query clusters, and generating structured schema markups. However, AI cannot replace manual engineering oversight when resolving complex JavaScript thread bottlenecks or designing frictionless human checkout experiences.
What is the difference between lab data and field data in Google PageSpeed Insights?
Lab data reflects a synthetic, single-run simulation executed on predefined server hardware under fixed network throttling conditions, making it ideal for immediate debugging. Field data, gathered through the Chrome User Experience Report (CrUX), reflects actual 28-day aggregated performance experienced by authentic human visitors browsing on diverse devices, network carriers, and viewports.
Where Should You Start?
Executing a complete optimization program across an entire enterprise domain can seem overwhelming. Instead of attempting all technical fixes at once, identify the specific operational situation that describes your website today and execute that single initial task.
If your website boasts solid organic traffic but suffers from disappointing lead or sale conversion numbers, begin immediately with Step 7. Open Google Analytics 4, build a basic funnel exploration for your checkout or consultation flow, and identify the single form field or step where visitors abandon your interface. Removing two unnecessary form fields or introducing a prominent mobile action button takes less than two hours and can unlock immediate revenue gains.
If your website already has a library of high-value educational content but struggles with sluggish mobile load times and failing Search Console reports, begin with Step 2. Open PageSpeed Insights, test your top-performing blog or product template, and convert your primary hero banners into WebP format with high fetch priorities. Resolving your LCP bottleneck represents the highest-leverage engineering win available.
If your site performance is fast but organic impressions have plateaued over the past two quarters, begin with Step 6. Open Search Console, export your striking-distance queries ranking between positions 4 and 15, and update your page headings and title tags to align with user intent. Selecting one focused entry point ensures you build operational momentum while executing disciplined site optimization.
About the author

Builder of Orova
Nguyễn Đỗ Trọng Ân has 8 years of experience in marketing, including 6 years managing market development across Asia. He builds Orova, a Biz AI Agent that never sleeps: it plans, runs and optimizes work for businesses.
Run your business with AI Agents
Orova is the always-on Biz AI Agent — it plans, runs, and optimizes the work for you.
Save time, unlock productivity.