
What is Google Looker? LookML, real costs, and how it differs from Looker Studio

Google Looker is Google Cloud's enterprise business intelligence platform: it sits on top of a cloud data warehouse, uses a modeling language called LookML to define every business metric once, and turns each question into SQL that runs inside the warehouse. It is a different product from Looker Studio, the free dashboard tool formerly called Data Studio, and mixing the two up is the most common mistake buyers make. Many growing organizations assume that visual reporting simply requires connecting an ad account to a free canvas, only to watch queries stall, numbers disagree across departments, and critical metrics break during executive reviews. Traditional reporting setups treat business intelligence as an exercise in building charts on top of raw tables, which inevitably fractures trust when marketing, sales, and finance calculate customer acquisition costs differently. Choosing the wrong analytics layer leads to either bloated software expenditures or paralyzed decision-making. This guide breaks down the true architecture behind the platform, separates enterprise deployment from free reporting tools, lays out what you actually pay for to run it, and provides a clear framework to determine when your organization genuinely needs this infrastructure.
What Is Google Looker?
Google Looker is an enterprise business intelligence platform that connects directly to cloud data warehouses, enabling teams to define centralized business metrics through a semantic modeling layer called LookML. Unlike lightweight reporting tools, it generates SQL queries at the moment a user asks a question, without storing or duplicating the underlying business data.
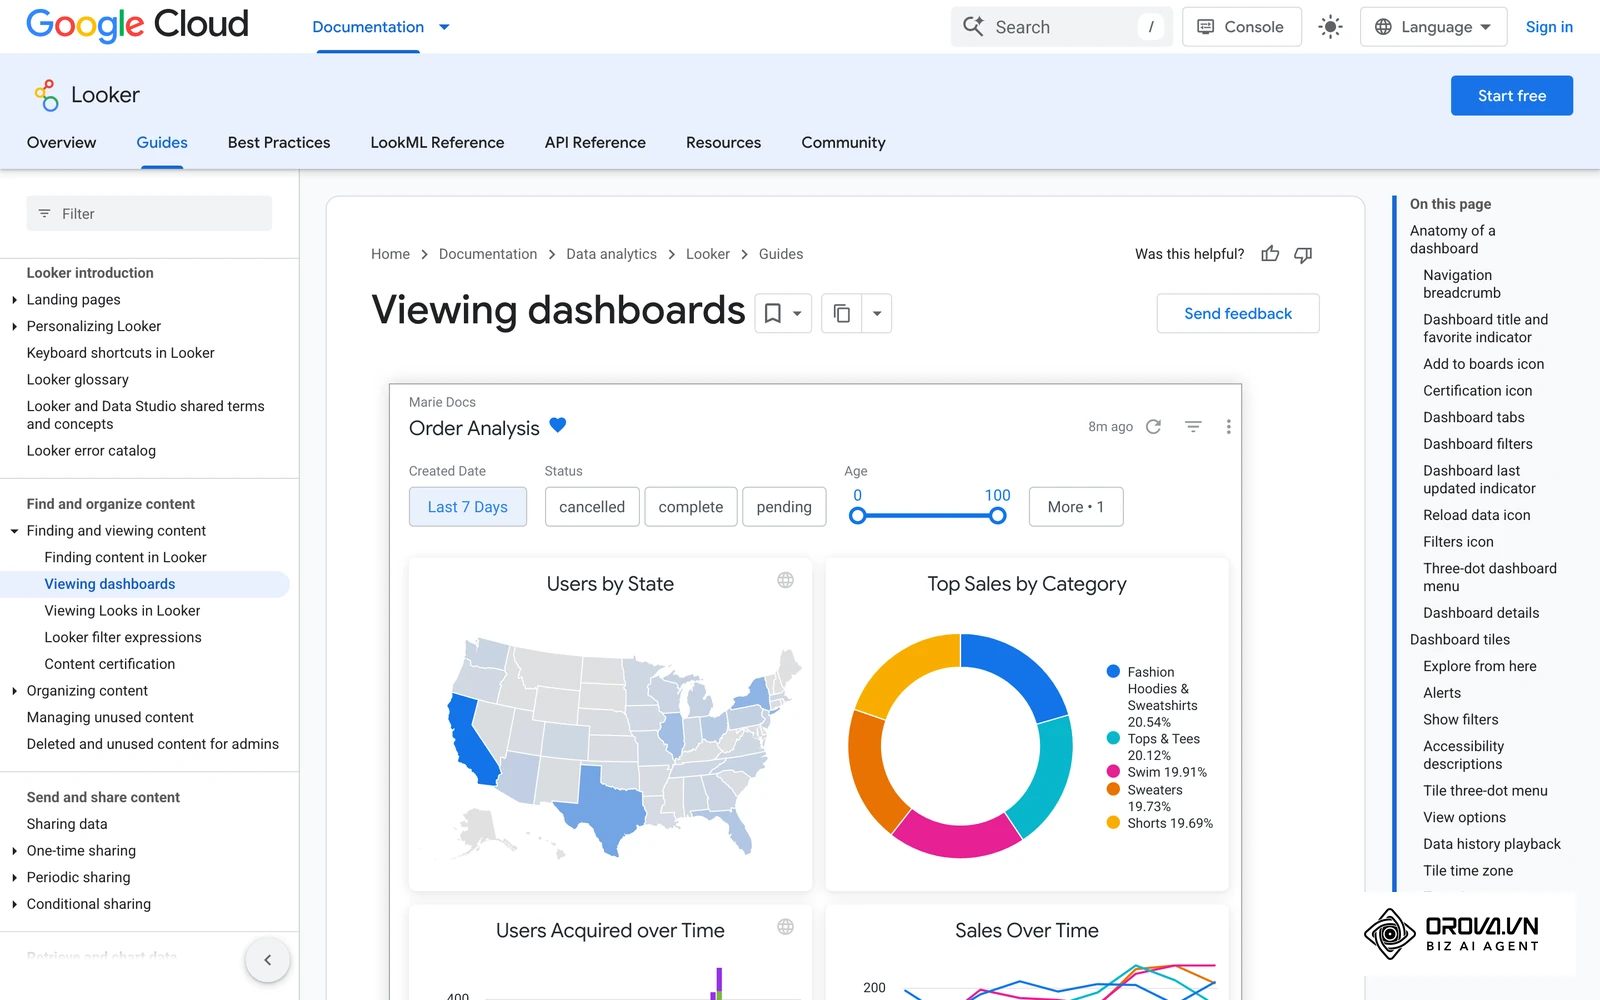
Looker was founded in 2012 by Lloyd Tabb and Ben Porterfield. Google announced its acquisition of Looker in 2019 for 2.6 billion dollars and folded it into Google Cloud as the anchor of its enterprise analytics suite, which is why it sits in a different category from departmental visualization tools.
| Concept | Architectural Difference | Practical Example |
|---|---|---|
| Google Looker (Enterprise BI) | Centralized semantic layer (LookML) generating direct warehouse SQL queries | Defining churn logic once in code so marketing, finance, and product query identical figures |
| Google Looker Studio | Lightweight visualization canvas querying data directly through API connectors or flat tables | Building a visual client dashboard by linking directly to a Google Ads account or Google Sheets |
| Traditional Desktop BI | Proprietary in-memory data extraction engine storing localized snapshot files | Extracting ten gigabytes of sales transactions to a local desktop file for offline workbook modeling |
To understand Google Looker, think of an executive restaurant kitchen. In an unregulated kitchen, every line cook invents their own recipe for tomato soup, producing inconsistent dishes and wasted ingredients. Looker serves as the master recipe binder and certified executive chef. Dining room servers order dishes using standard menu names, but Looker translates every order into exact ingredient measurements before kitchen staff touch the pantry. Nobody invents custom proportions, and every guest receives identical quality.
Why Google Looker Exists: Core Purpose and Strategic Role
Google Looker exists to solve metric divergence across enterprise departments. As companies grow, different teams naturally define core business metrics according to local incentives. Marketing defines customer acquisition upon lead form submission; sales defines it upon contract signing; finance defines it when cash clears the bank account. Without a shared semantic layer, data analysts spend a large share of their working hours answering repetitive ad-hoc questions or reconciling contradictory spreadsheets before executive board meetings.
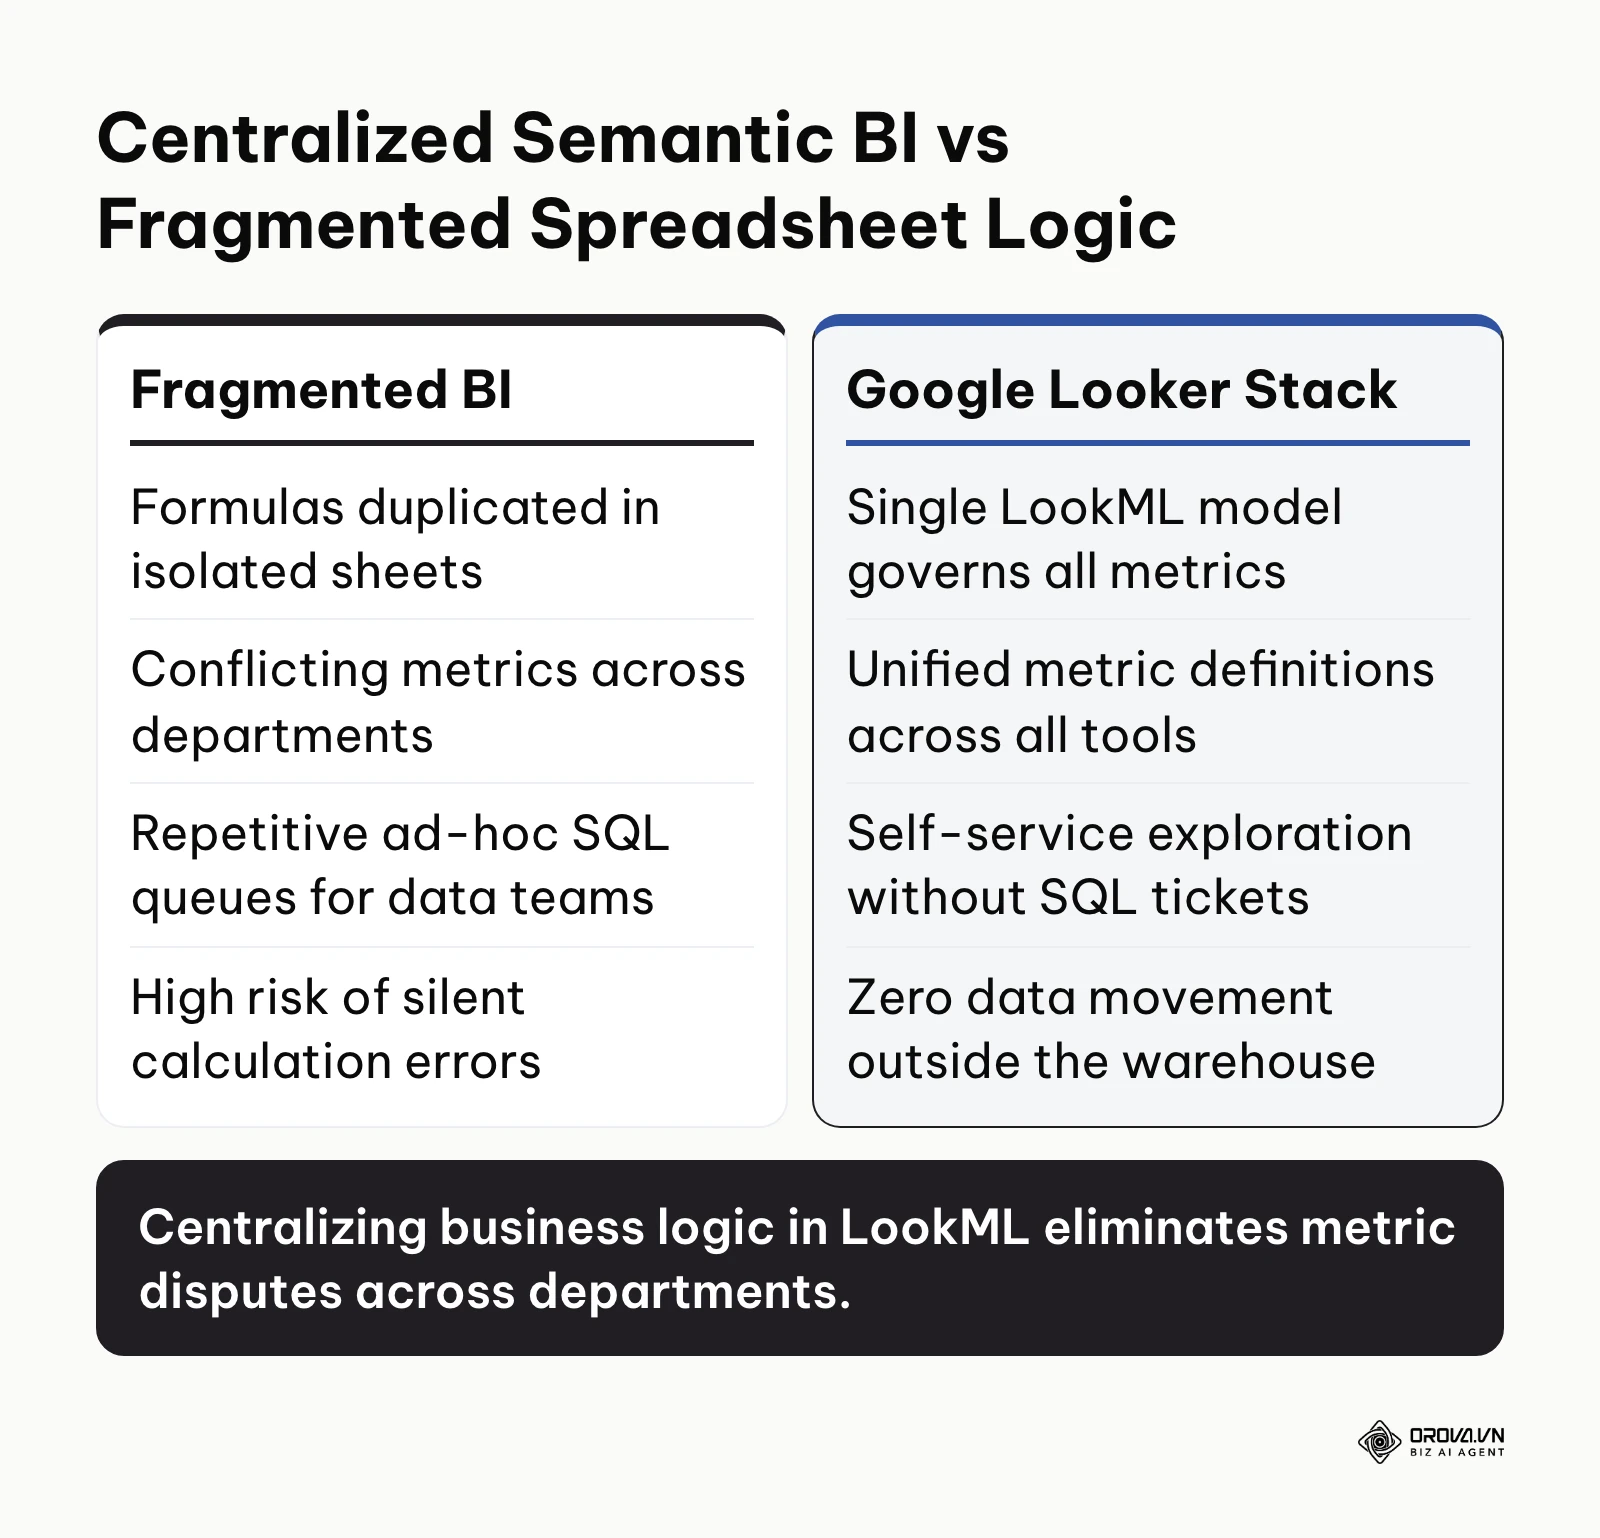
In modern data architecture, Google Looker occupies the critical governance position between raw storage and end-user consumption. Upstream, extract-and-load pipelines ingest raw records from advertising channels, CRM platforms, and transactional databases directly into a centralized cloud data warehouse like Google BigQuery or Snowflake. Downstream, operational users access visual reports, automated alerts, and conversational applications. Looker sits squarely in the middle: it transforms chaotic database tables into governed business concepts without extracting raw records into a third-party proprietary server. The diagram below outlines the core contrast between fragmented spreadsheet reporting and a unified semantic layer.
If an organization ignores this architectural layer as it scales, it inevitably suffers from governance decay. When business logic lives inside scattered dashboard calculations, changing a single definition requires data teams to locate and update dozens of disconnected charts manually. Teams lose trust in reporting, executive decisions stall, and engineering talent wastes time debating spreadsheet formulas rather than optimizing commercial growth.
When you do not need Google Looker yet: Investing in enterprise Looker becomes wasteful if your organization is still small, lacks dedicated SQL engineering resources, or tracks marketing performance across only a couple of advertising channels. In these early operating stages, maintaining custom LookML files introduces unnecessary overhead without measurable return. Teams at this scale should rely on direct spreadsheet modeling, lightweight connectors in Looker Studio, or turnkey marketing analytics platforms that deliver pre-built reporting without infrastructure maintenance.
Business Value and Practitioner Benefits of Google Looker
Deploying an enterprise semantic architecture delivers tangible returns across strategic governance and daily practitioner productivity. Platforms that maintain a centralized semantic layer reduce duplicated analysis work and make data governance across business units far easier to enforce. The three benefits below are where practitioners usually feel the difference first.
Centralized Metric Governance Eliminates Disputed Executive Data
Before centralized governance, commercial departments routinely present conflicting numbers during executive reviews. Finance presents revenue net of chargebacks, while sales presents gross contract values. After deploying LookML, the company codifies recognized revenue in version-controlled files. All departmental queries point to this shared definition, ensuring consistent commercial alignment.
In-Database Architecture Eliminates Stale Data and Redundant Storage
Before in-database pushdown processing, traditional BI systems extract data into proprietary memory cubes overnight, serving yesterday's data and adding a second layer of storage costs. After connecting Looker directly to the warehouse, every query compiles dynamic SQL against live tables. Teams eliminate secondary storage fees and view current transaction states.
Self-Service Exploration Liberates Analysts from Ad-Hoc SQL Queues
Before governed self-service, non-technical teams submit support tickets for routine metric filters, creating multi-week analyst backlogs. After data engineers expose curated Explores, commercial stakeholders filter verified dimensions independently. Analysts transition from writing repetitive extraction scripts to developing high-value customer models.
Illustrative example: A mid-market B2B software company with 140 employees and four growth marketers struggled with conflicting customer lifetime value calculations between sales and marketing. The team centralized their metric definitions by coding a unified customer lifetime value model in LookML, configured role-based access for department leads, and exposed curated Explores for campaign analysis. Initial query performance lagged significantly because marketers frequently queried unindexed raw transaction logs without date boundaries; the data team resolved this bottleneck by establishing persistent derived tables (PDTs) and mandatory partitioning filters on time dimensions. Within two weeks, executive leadership reviewed weekly retention and acquisition metrics from a single shared dashboard without disputes over data provenance, and marketing specialists pulled segmented customer cohorts directly without submitting database tickets.
| Benefit | Measured By (Metric) | Time to Realization |
|---|---|---|
| Centralized Metric Governance | Frequency of conflicting departmental reporting metrics | 1 to 2 months post-modeling |
| Reporting Turnaround Velocity | Turnaround duration for custom ad-hoc reporting requests | 3 to 6 weeks after Explores launch |
| Live Data Synchronization | Latency gap between warehouse updates and dashboard visibility | Immediate upon live database connection |
| Cloud Infrastructure Efficiency | Redundant secondary BI server storage and synchronization costs | 1 billing cycle after migration |
Turn multi-channel data into instant decisions. OROVA Insight seamlessly connects APIs from Online to Offline, helping you see the full picture of your business through a Real-time chart reporting system.
OROVA Insight: Integrate Online - Offline data, visualize reports in Real-time.
How Google Looker Works: Architecture, LookML, and Key Workflows
Understanding how Google Looker operates requires dissecting its core architectural components. The core design choice is in-database querying: Looker generates SQL and runs it in your warehouse, so the underlying data stays where it already lives. Rather than moving records into a separate proprietary server, Looker acts as a SQL compiler translating business logic into warehouse-native queries.
LookML Semantic Layer: Defining the Enterprise Source of Truth
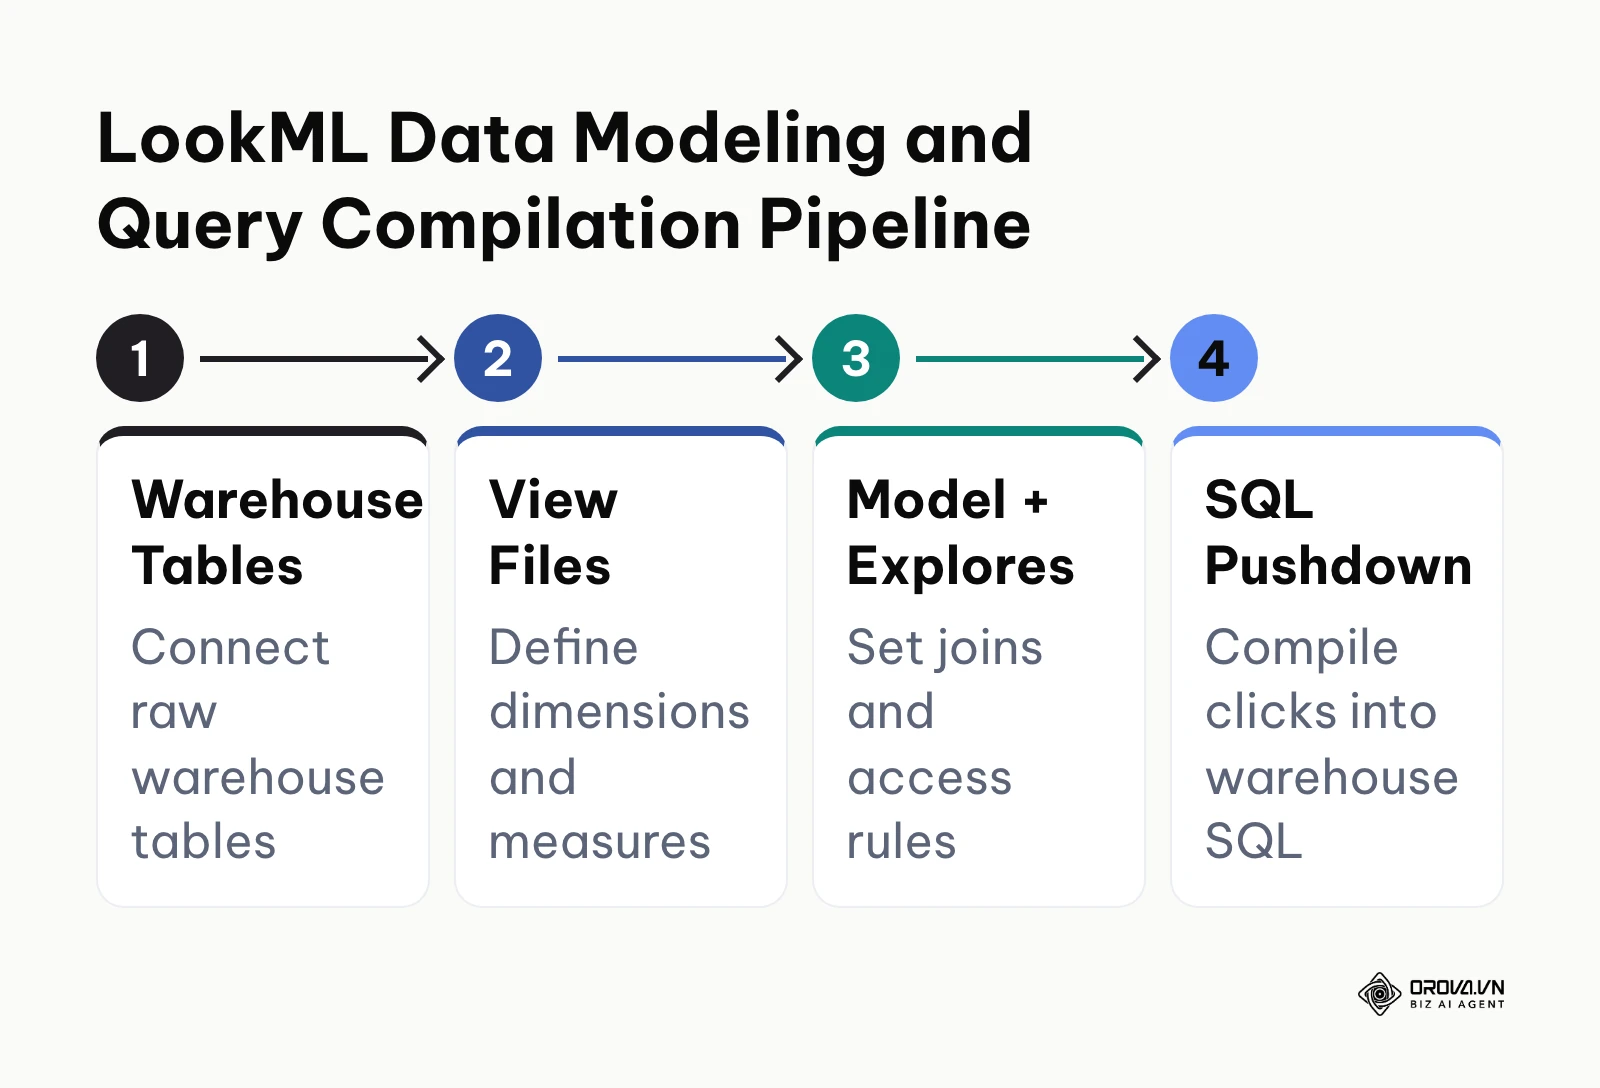
LookML is Looker's modeling language that maps physical database schemas to standardized business logic. Developers maintain LookML in Git repositories, creating views for tables, dimensions for attributes, and measures for aggregations. Its input consists of relational warehouse tables; its output is a governed semantic layer exposing verified metrics to end users. LookML projects typically break when developers create circular joins or omit primary keys, which triggers fanouts that inflate calculation totals. The workflow below details how LookML transforms raw database schemas into business-ready dimensions and measures.
In-Database SQL Pushdown: Zero Data Movement Processing
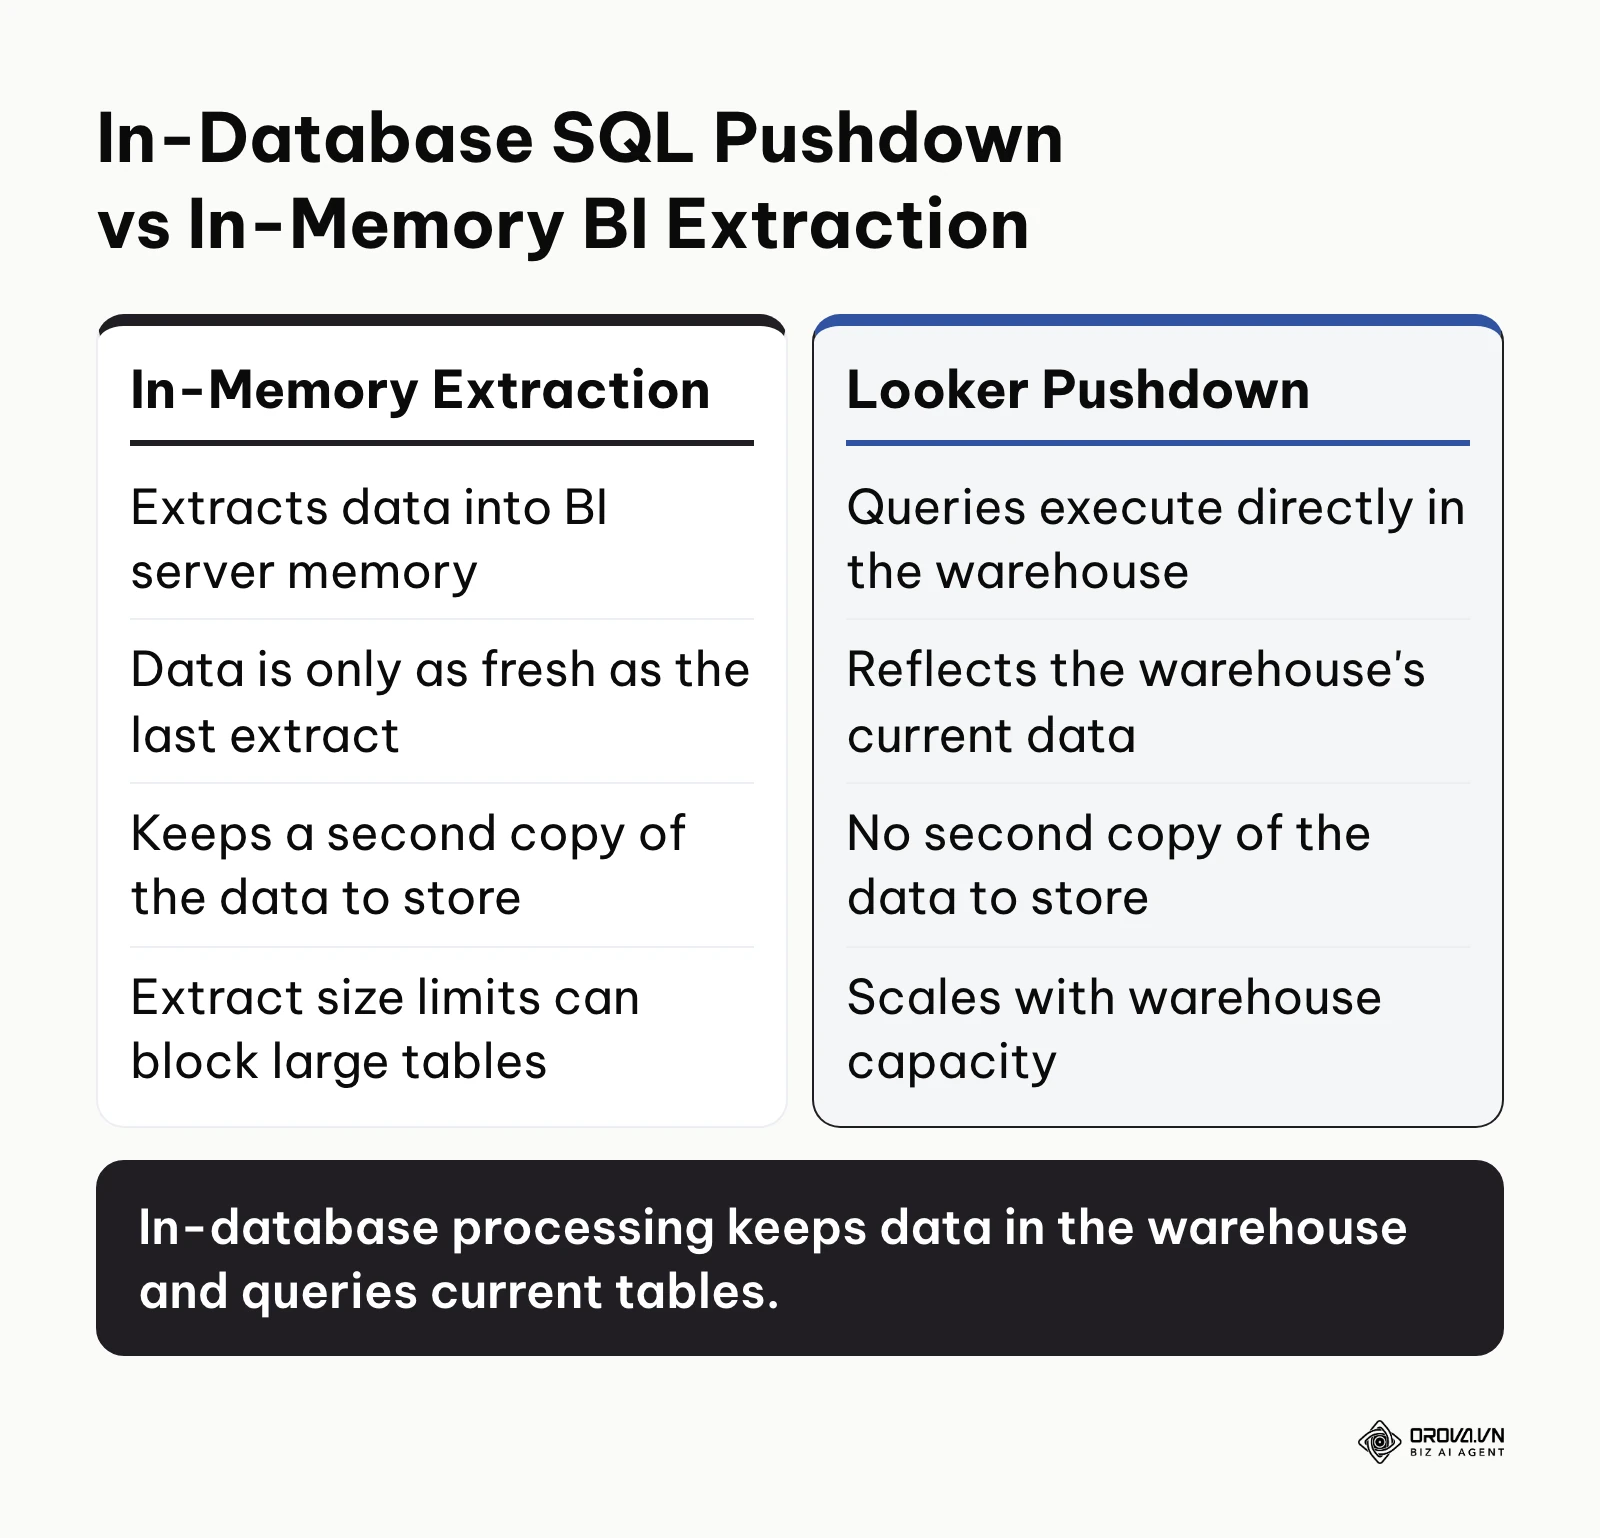
When users query metrics in Looker, the SQL engine compiles the request into optimized SQL tailored to the warehouse dialect, executing directly on BigQuery, Snowflake, or Redshift. The input is a structured request from user interactions; the output is streaming SQL results returned securely to the browser. This layer typically breaks when users execute un-partitioned queries across massive event tables, triggering high warehouse compute costs or timeout errors. The comparison below details the operational trade-offs between in-database query pushdown and legacy in-memory data extraction.
Looker Explores and Dashboards: Governed Visual Discovery
Explores are visual query builders built upon LookML models. Non-technical users interact with a tidy menu of pre-approved dimensions and measures rather than raw database consoles. The input is point-and-click selections; the output is interactive visualizations and scheduled digests. Explores fail when administrators expose hundreds of raw technical fields simultaneously, re-introducing the confusion of un-modeled databases.
Embedded Analytics and API Extensibility: Operationalizing Data
Google Looker extends beyond internal dashboards through its Embed SDK and REST APIs. Engineering teams embed interactive dashboards into customer portals with row-level security ensuring clients view only private records. The input consists of authentication tokens and dynamic filter parameters; the output is white-labeled analytical interfaces. The failure point is usually misconfigured CORS rules or session token timeouts during high-concurrency client usage.
Conversational Analytics with Gemini AI: Natural Language Querying
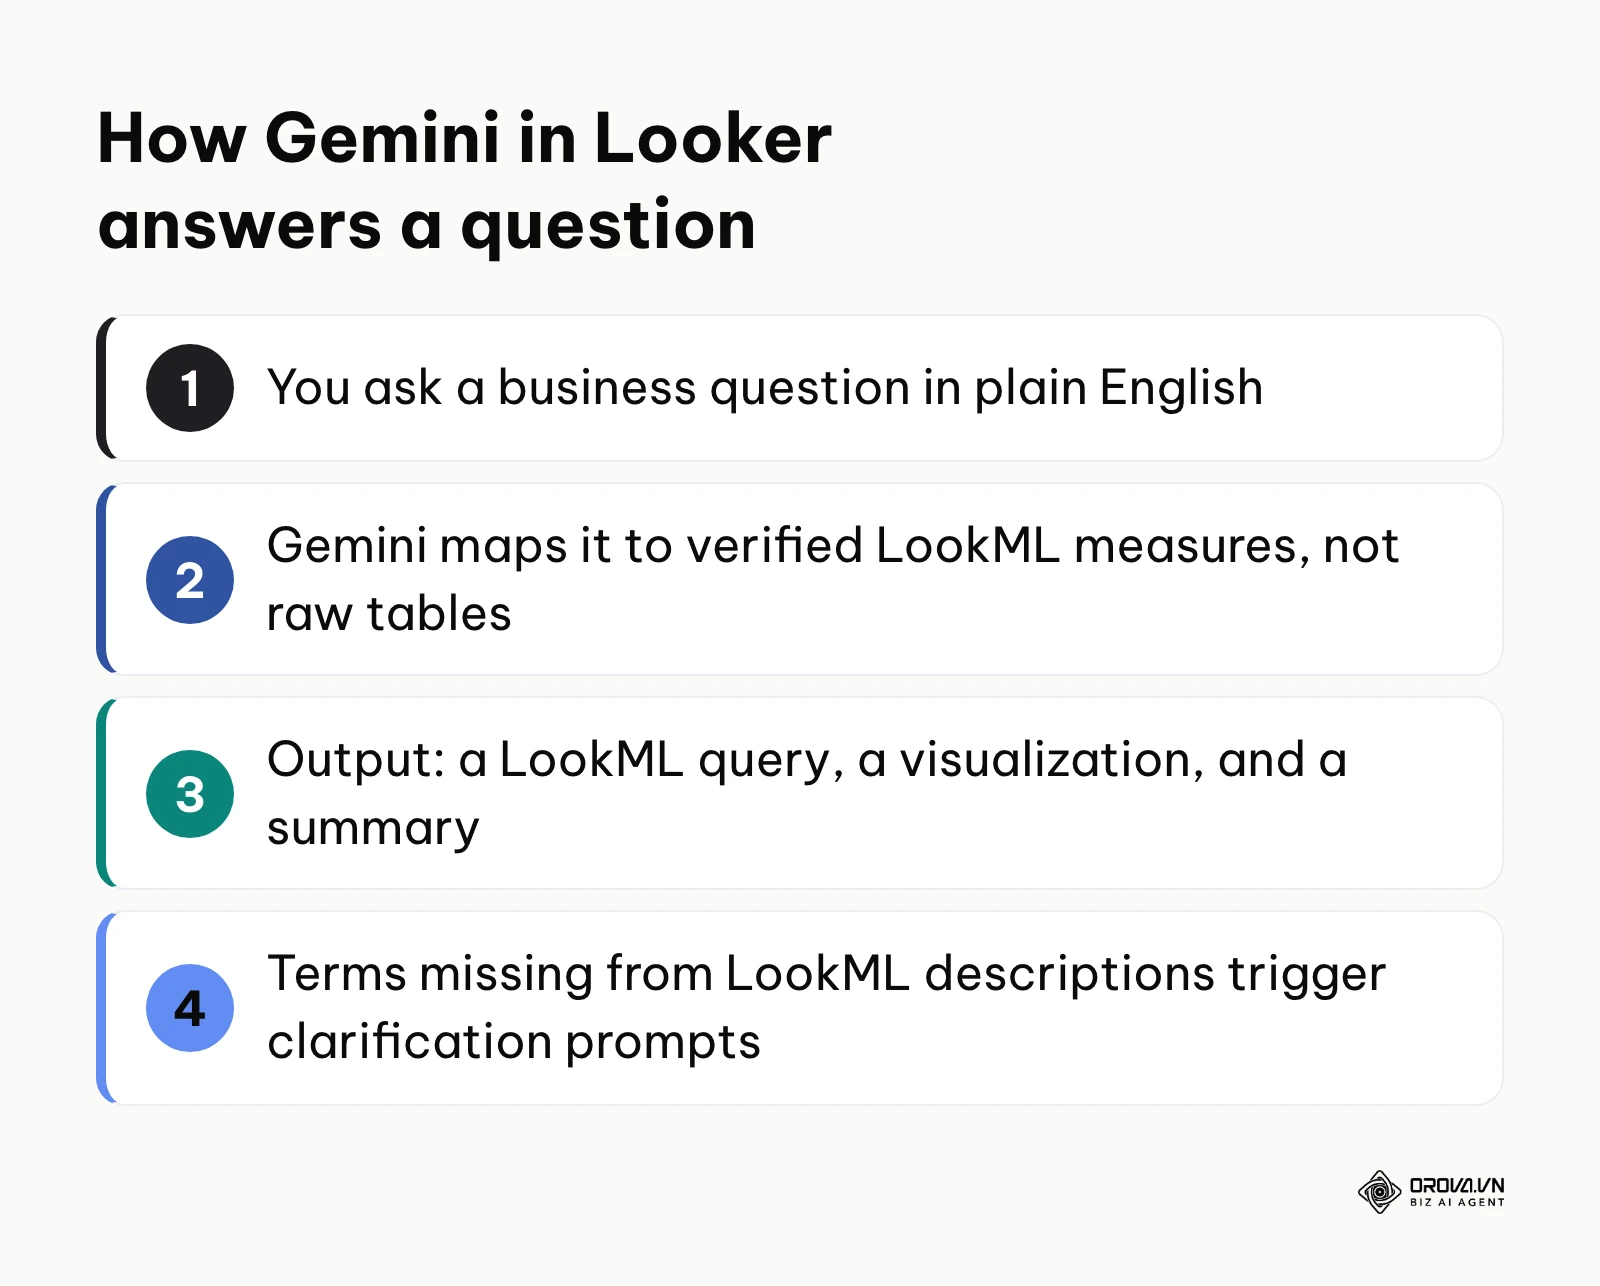
Google Cloud has added Gemini features to Looker, including conversational analytics that let teams ask plain English questions about business trends. Traditional AI models hallucinate when querying raw SQL because they lack business context. Gemini inside Looker queries through LookML, using the semantic layer as a governance boundary that maps questions to verified measures. The input is a conversational prompt; the output is a verified LookML query, visualization, and summary. It stumbles when business terms are omitted from LookML descriptions, triggering clarification prompts.
Google Looker Editions and Architectures
The Looker name now covers several products, so it helps to separate them before talking to anyone about licenses:
| Product | Core Technical Architecture | Best Fit For |
|---|---|---|
| Looker (Google Cloud core), Standard edition | LookML modeling on an instance created and managed in the Google Cloud console | Smaller teams starting with governed BI on Google Cloud |
| Looker (Google Cloud core), Enterprise edition | Same LookML platform with enterprise security and administration options for larger user bases | Large organizations requiring strict data governance across many departments |
| Looker (Google Cloud core), Embed edition | LookML platform oriented toward embedding analytics into external applications | Companies building customer-facing data products and portals |
| Looker (original) | The original Looker platform with LookML, Git integration, and API access, still used by many long-time customers | Existing Looker customers who have not moved to Looker (Google Cloud core) |
| Looker Studio Pro | Looker Studio with team workspaces, shared asset ownership, and Google Cloud support | Departmental analytics teams needing collaborative dashboards without modeling code |
| Looker Studio | Free drag-and-drop report canvas with direct connectors, subject to each source's API quotas | Freelancers, small businesses, and agencies building quick marketing dashboards |
Looker Enterprise vs Looker Studio: Direct 8-Criteria Head-to-Head Comparison
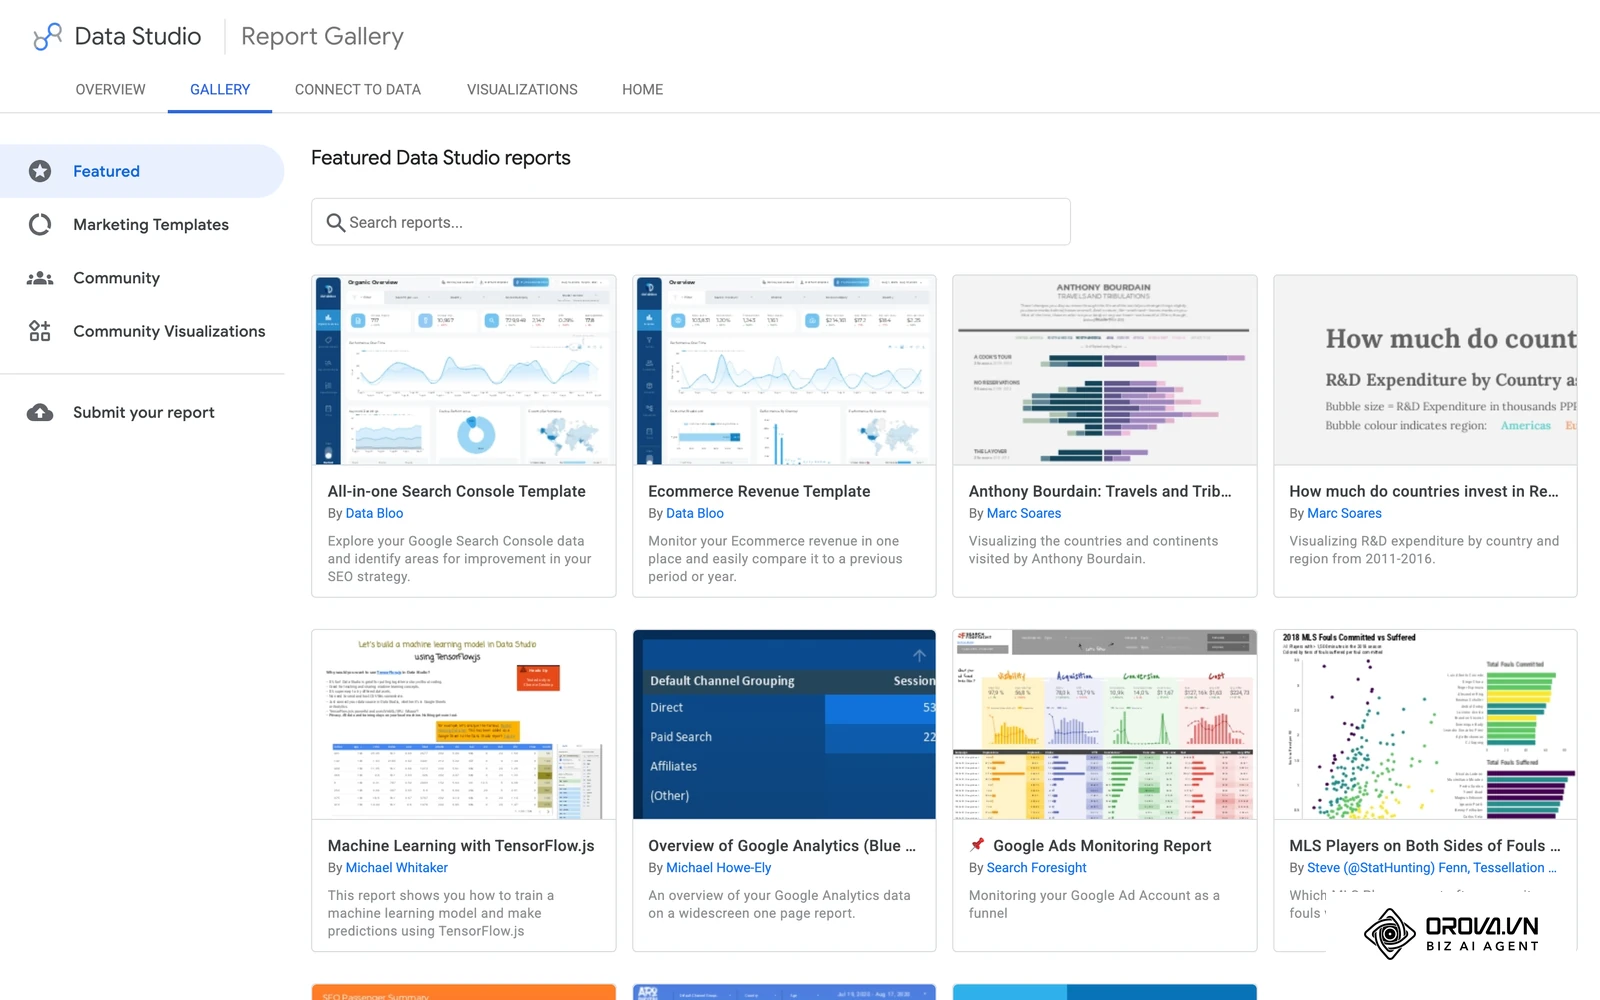
The rebranding of Google Data Studio into Looker Studio caused widespread confusion. The table below provides an objective head-to-head comparison across eight structural criteria:
| Evaluation Criteria | Google Looker (Enterprise) | Google Looker Studio (Free / Pro) |
|---|---|---|
| Cost and Pricing Model | Quoted annual contract through Google Cloud sales, combining platform and user licensing | Free to use; Pro is a per-user monthly subscription |
| Semantic Modeling Layer | Centralized LookML code repository with Git version control and automated testing | No centralized semantic layer; calculations live inside individual visual widgets |
| Query Processing Mechanism | In-database SQL compiled dynamically for the connected warehouse dialect | Each chart queries its source through a connector; some connectors cache or extract data |
| Large Dataset Performance | Scales with the compute capacity of the connected cloud warehouse | Slows noticeably on large raw event tables unless data is pre-aggregated |
| Embedded Analytics | Embed SDK and APIs with single sign-on and row-level access control | Basic report embedding without programmatic row-level security |
| GA4 API Quota Resilience | Typically queries GA4 data exported to BigQuery, so the GA4 Data API quota is not involved | Live GA4 connector dashboards can hit Google Analytics Data API token quota errors |
| Target Audience & Maturity | Mature data teams with dedicated data engineers and SQL specialists | Marketers, business analysts, and agencies needing fast visual reporting without code |
| Implementation Barrier | High; requires weeks of schema design, LookML modeling, and database indexing | Low; users connect a data source and assemble charts within thirty minutes |
For teams managing multi-channel marketing, understanding Looker Studio data integration is critical before committing to complex architectures. When tracking organic search visibility alongside paid campaigns, combining curated views with Google Search Console reports provides immediate marketing clarity without enterprise overhead.
Step-by-Step Checklist to Eliminate GA4 Token Quota Exceeded Errors
Direct connectors to GA4 rely on the Google Analytics Data API, which enforces token quotas per property, measured per hour and per day. Exporting raw GA4 events into BigQuery sidesteps those limits, because dashboards then run SQL against warehouse tables instead of calling the Data API. Follow this five-step checklist to resolve this issue:
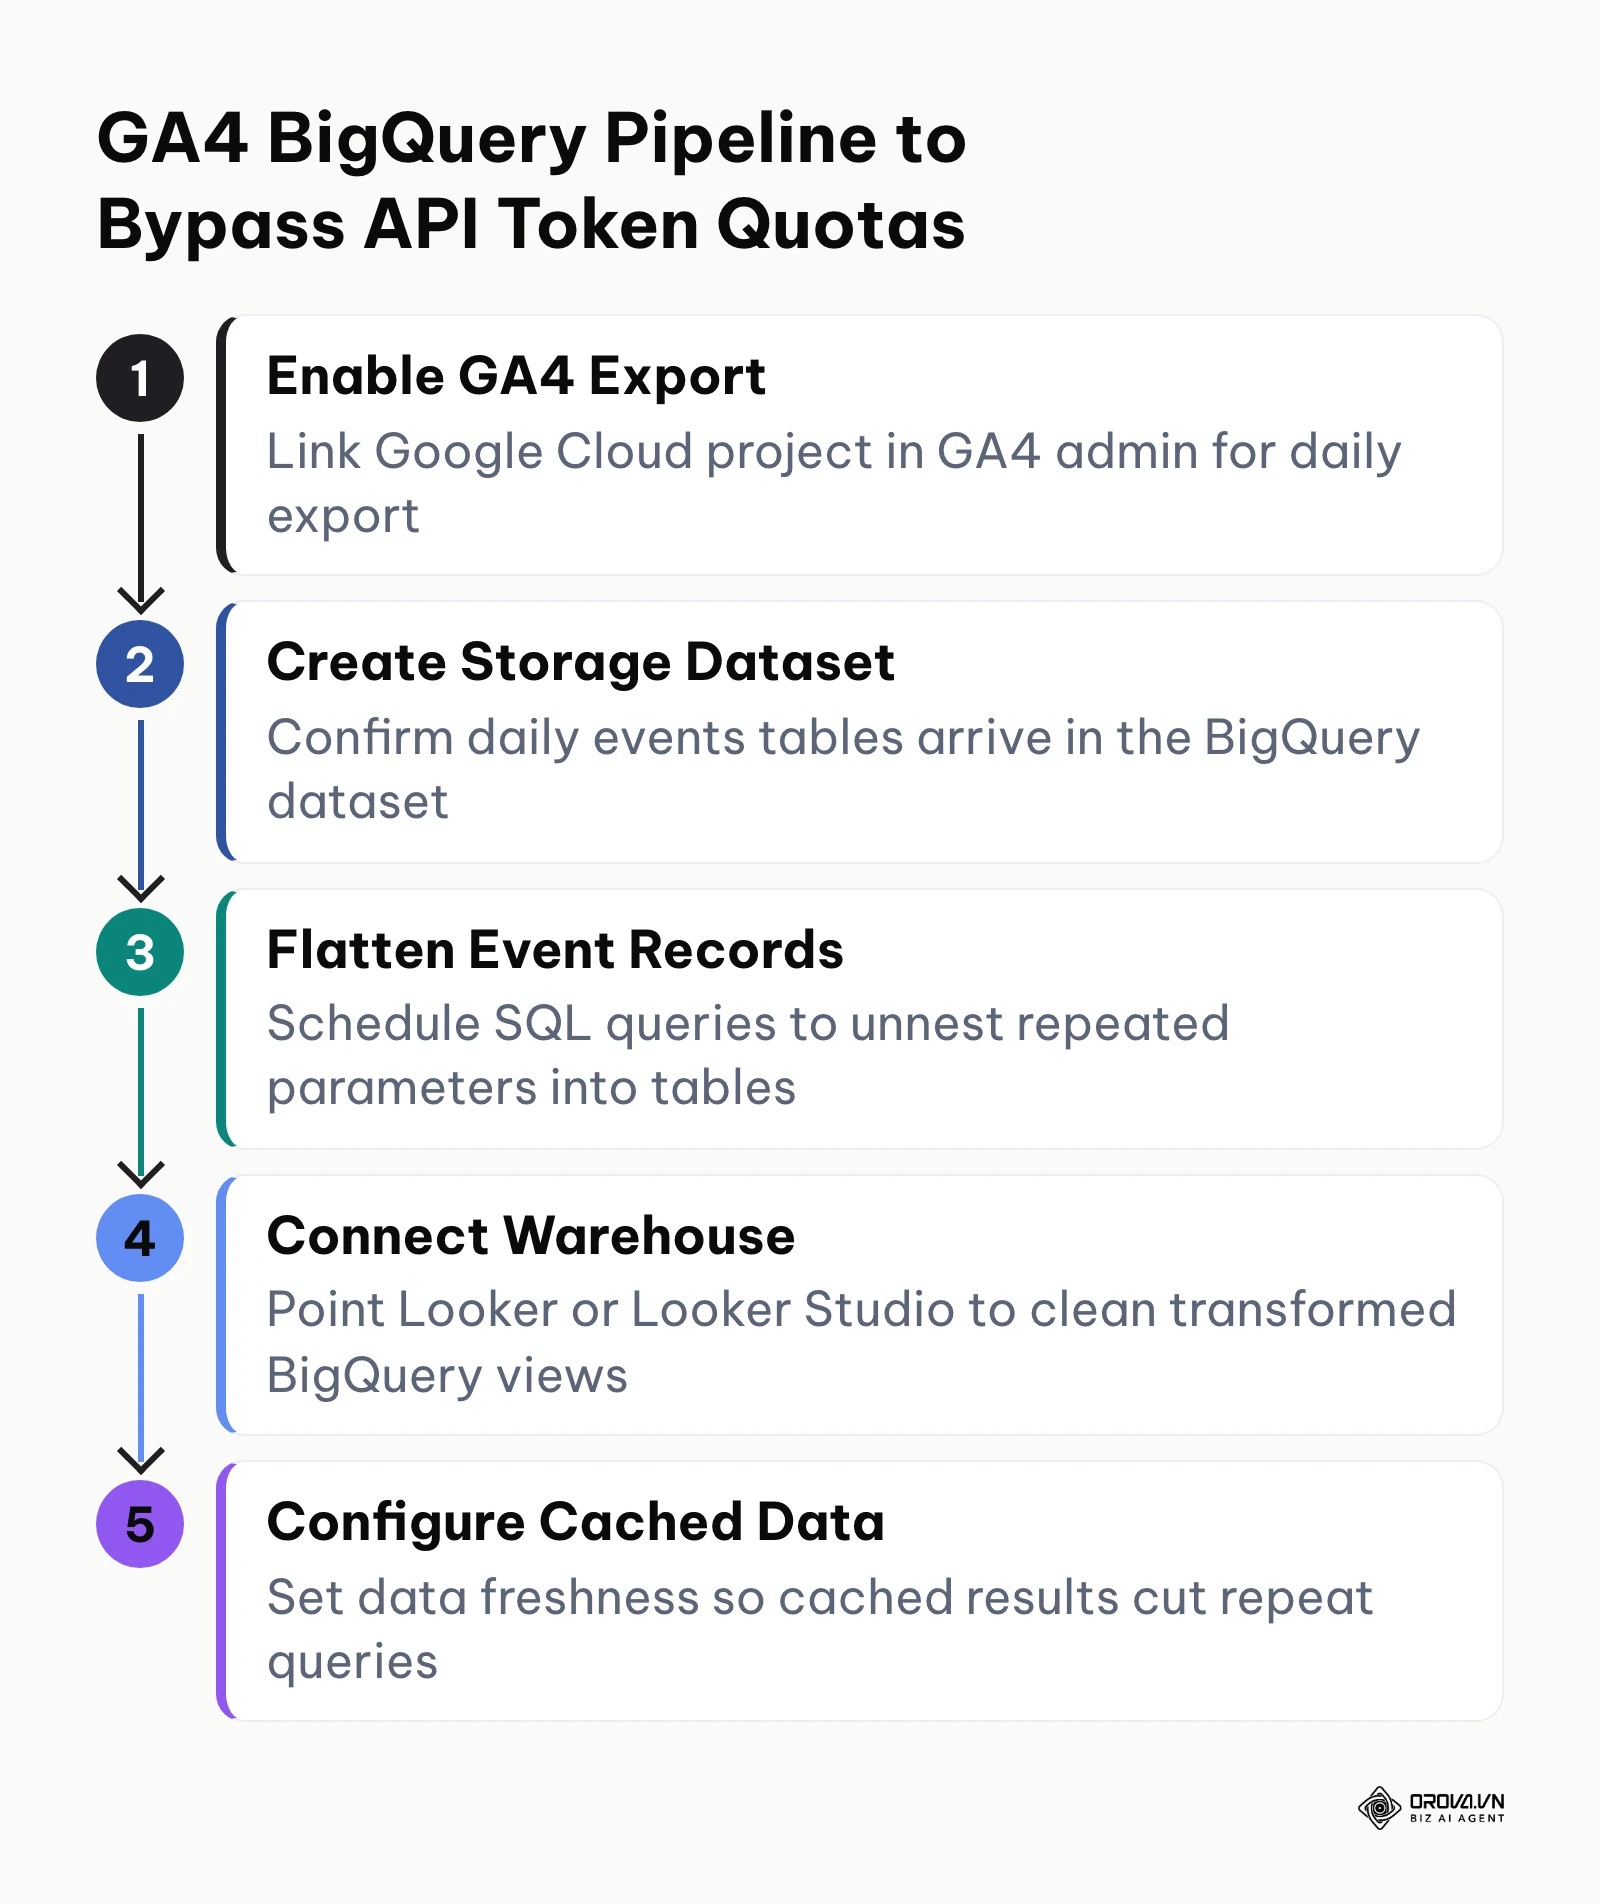
- Step 1: Enable BigQuery Export in Google Analytics 4 Admin. In Admin > Product Links > BigQuery Links, select your Google Cloud project and configure daily export schedules.
- Step 2: Establish the Google Cloud BigQuery Storage Dataset. Confirm the export creates the daily events tables inside your BigQuery dataset without errors.
- Step 3: Schedule Automated SQL Transformations to Flatten Event Data. Create a scheduled query in BigQuery that un-nests essential parameters into clean, partitioned daily reporting tables.
- Step 4: Connect the Native BigQuery Connector in Looker or Looker Studio. Add a new data source using the native BigQuery connector pointing to your flattened view.
- Step 5: Configure Cached Data Extracts to Minimize Query Frequency. Set viewer credentials and configure data freshness to four or twelve hours to query cached results.
The sequential diagram below illustrates the end-to-end data pipeline routing GA4 events through BigQuery to prevent API token crashes.
Illustrative example: An international retail brand running multi-region e-commerce campaigns experienced constant reporting crashes during seasonal promotions. The lead growth analyst connected five regional Google Analytics 4 properties directly to Looker Studio to track campaign performance, configuring hourly scorecards for executive stakeholders. During peak campaign traffic, six executive managers simultaneously opened the dashboard, triggering the error: 'Google Analytics 4 token quota exceeded' and crashing ten primary conversion widgets; the analytics team resolved the failure by enabling GA4 BigQuery export, scheduling an automated daily flattening query in BigQuery, and swapping the direct connector for an optimized BigQuery table connection. The updated reporting dashboard refreshed within two seconds across all regional views, eliminated API token errors entirely, and allowed the team to analyze conversion trends without service interruptions.
How to Get Started and Adapt to Google Looker
Adopting a modern business intelligence architecture requires matching technical investments to operational readiness.
For Small Business Owners and Marketing Leaders
Small business leaders must avoid over-investing in infrastructure prematurely.
- Audit commercial metric definitions this week: write down how your business defines a qualified lead, an acquisition, and active customer churn, ensuring all department heads agree on formulas.
- Maintain lightweight reporting layers using direct spreadsheet models or Looker Studio while your reporting fits within a handful of direct connectors.
- Centralize your advertising exports into Google BigQuery using automated native transfers before purchasing enterprise software licenses.
- Transition to semantic modeling only when departmental metric arguments regularly consume leadership meeting time.
For In-House Data Analysts and Marketing Specialists
In-house analysts must balance rigorous modeling with user adoption.
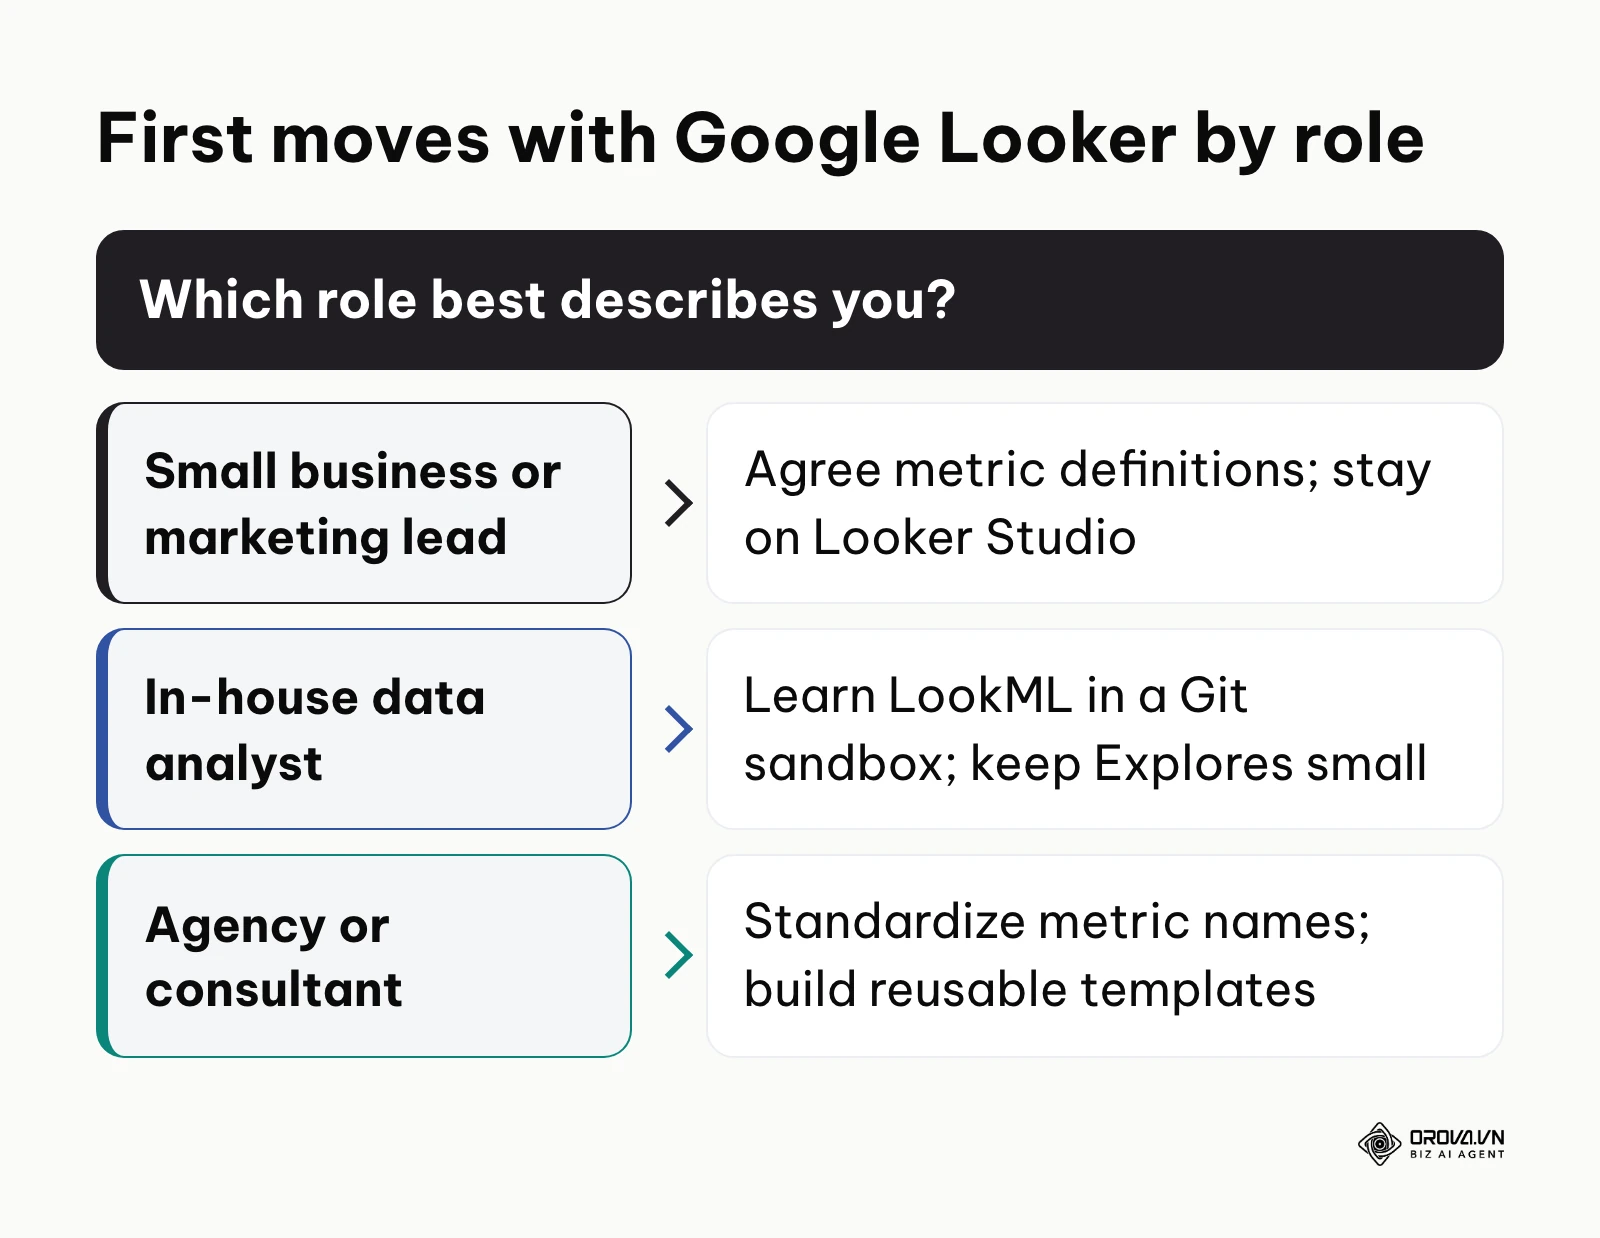
- Complete Google Cloud LookML developer tutorials this week to master the syntax of views, dimensions, and derived tables.
- Establish a Git-controlled sandbox environment and build a prototype semantic model for your organization's core transaction table.
- Build focused, curated Explores containing fewer than thirty essential fields to prevent cognitive overload for commercial users.
- Implement persistent derived tables (PDTs) and mandatory timestamp filters to protect your cloud warehouse from runaway query costs.
For Growth Agencies and Analytics Consultants
Agencies must deliver repeatable, scalable reporting across diverse client stacks.
- Standardize your client reporting metric taxonomy this week, aligning naming conventions for cost-per-acquisition and return-on-ad-spend across platforms.
- Develop modular reporting templates in Looker Studio or reusable LookML blocks that can be deployed rapidly for new client onboarding.
- Eliminate fragile manual CSV exports by establishing automated warehouse pipelines for client ad accounts.
- Educate client stakeholders on data freshness boundaries to avoid unreasonable real-time streaming expectations.
Illustrative example: A regional consumer services firm with 45 employees sought to streamline advertising accountability across three metropolitan branches. The operations specialist attempted to integrate Google Ads, Facebook Ads, and local point-of-sale exports into a combined reporting spreadsheet to track customer acquisition efficiency. The manual spreadsheet frequently broke due to misaligned date formats and duplicate transaction IDs, leaving branch managers with contradictory cost-per-lead figures; the specialist resolved this by standardizing all timestamps to UTC, consolidating campaign spend through standardized channel connectors, and establishing a unified Looker Studio reporting template. The resulting branch performance report updated consistently every Monday morning, providing store managers with synchronized cost-per-acquisition figures across all regional advertising campaigns.
Common Implementation Mistakes and Prevention Strategies
Building sustainable analytics infrastructure requires steering clear of predictable organizational traps:
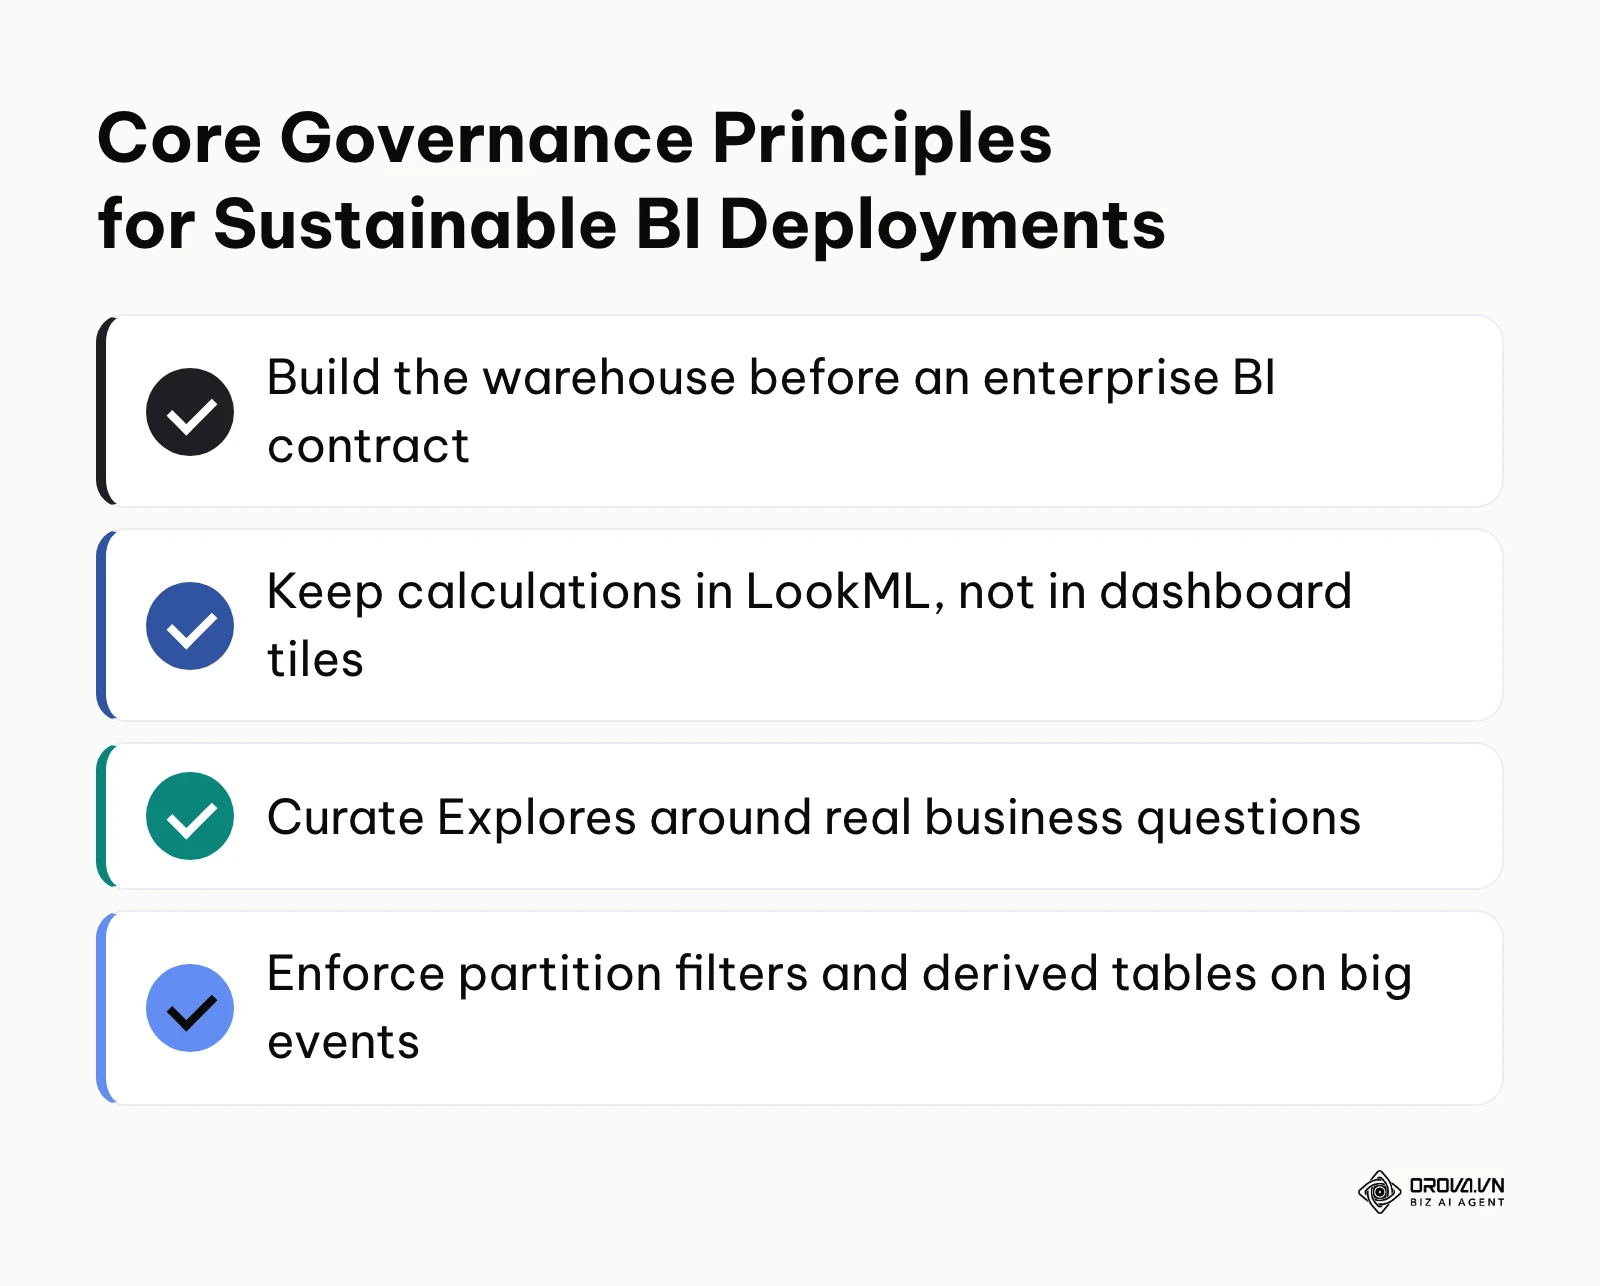
| Common Implementation Mistake | Real Operational Consequence | Recommended Prevention Strategy |
|---|---|---|
| Purchasing Looker Enterprise without an established warehouse | Paying expensive platform license fees while spending months engineering basic database tables | Build and validate your cloud warehouse in BigQuery or Snowflake before signing enterprise BI contracts |
| Writing business calculations inside individual dashboard tiles | Fragmenting metric definitions and recreating spreadsheet discrepancies Looker was bought to fix | Enforce a strict governance rule: all calculations must live inside version-controlled LookML view files |
| Exposing raw database schemas directly in user Explores | Intimidating business users with hundreds of technical fields, driving them back to spreadsheets | Curate Explores strictly around specific business questions, hiding unneeded technical foreign keys |
| Querying unpartitioned event tables on live dashboards | Generating large, surprise cloud warehouse compute bills on routine refreshes | Enforce partition filters and build persistent derived tables to summarize high-volume event data |
The summary below highlights foundational governance rules that protect business intelligence projects from technical debt.
Total Cost of Ownership: What You Actually Pay For at Three Business Sizes
A major gap in public discussions is total cost of ownership. Looker platform pricing is quoted through Google Cloud sales rather than shown as a simple public price list, and the license is only one part of the operating budget. The table below shows which cost lines appear at each business size, so you can collect real quotes for each line before deciding:
| Cost Category | Small Business | Mid-Market | Large Enterprise |
|---|---|---|---|
| BI software license | Looker Studio at no cost, or a per-user Looker Studio Pro subscription | Looker (Google Cloud core) Standard or Enterprise edition, quoted annual contract | Looker Enterprise or Embed edition, quoted annual contract plus user licenses |
| Cloud warehouse compute and storage | Often none; light BigQuery usage if GA4 export is enabled | Ongoing BigQuery or Snowflake query and storage fees | Dedicated or committed warehouse capacity |
| Data engineering and modeling talent | A generalist marketing analyst handles reports | Part of an analytics engineer's time maintains LookML | One or more full-time LookML and data engineers |
| Pipeline and connector software | Free Google connectors or a basic ETL tool | Managed pipeline tools for ads, CRM, and product data | Enterprise data integration suite |
| Hidden cost to watch | Analyst hours spent fixing broken connectors | Runaway queries on unpartitioned tables | Governance, code review, and training for many departments |
How to use this table: ask Google Cloud sales for a written Looker quote, ask your warehouse provider for a usage estimate based on your current data volume, and price the engineering time internally. If the people cost alone is out of reach, Looker Studio on top of BigQuery views is the realistic stage for now.
5-Criteria Decision Matrix: Choosing Your BI Architecture
To determine which analytics architecture fits your current operational needs, evaluate your organization against five critical criteria:
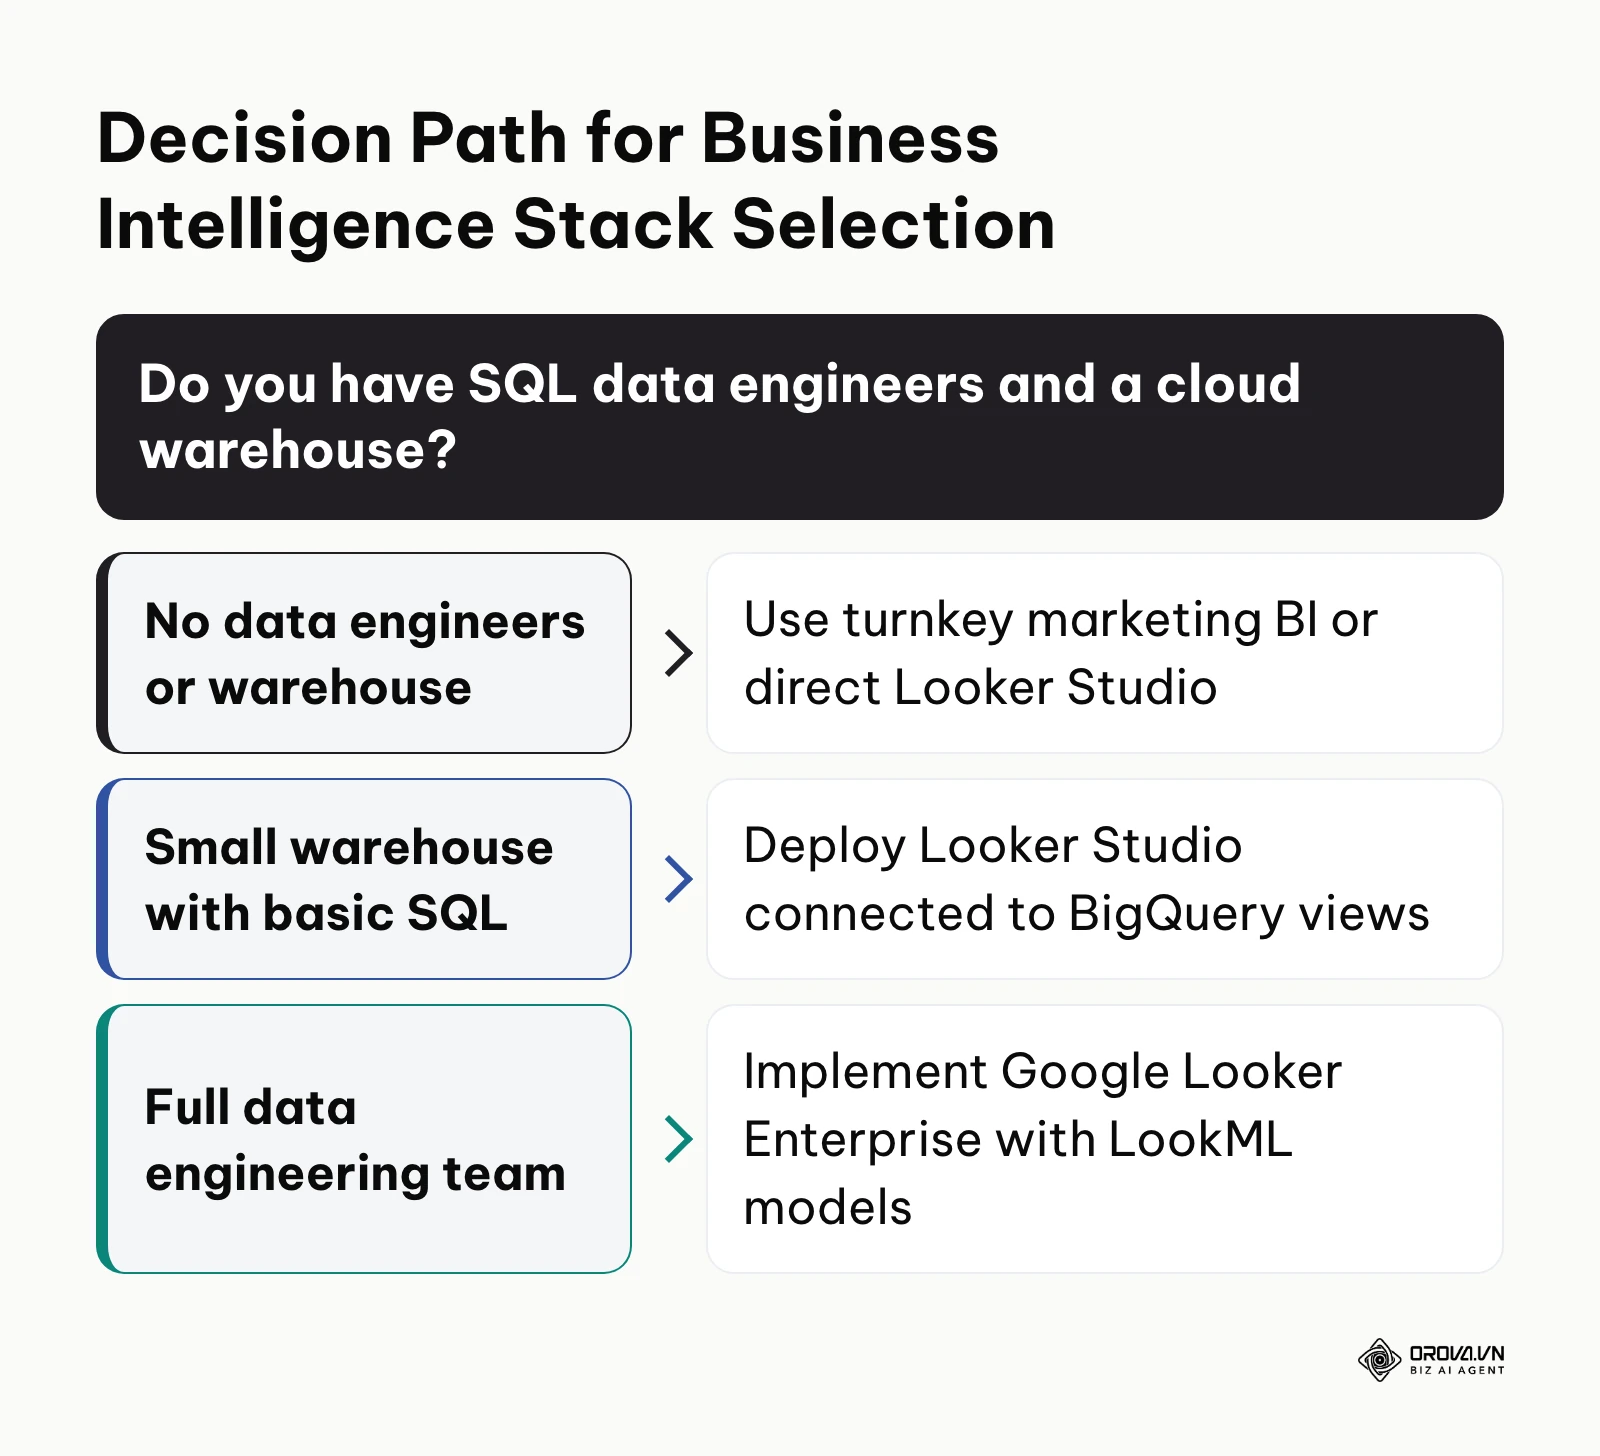
| Evaluation Criteria | Looker Studio (Free / Pro) | Looker Studio + BigQuery | Google Looker Enterprise | Turnkey Marketing BI |
|---|---|---|---|---|
| Data Volume & Sources | Low volume; a few direct connectors | Medium to high; millions of events in BigQuery | High volume; complex cross-system relational databases | Many ad, social, and web sources |
| Technical Team Skills | Minimal; spreadsheet formula familiarity | Moderate; ability to write basic SQL queries | Advanced; dedicated Git, SQL, and data modeling engineers | Non-technical; intuitive drag-and-drop report building |
| Metric Governance Needs | Low; individual team reports | Moderate; standardized SQL views feeding tiles | Critical; enterprise single source of truth across divisions | High for marketing; standardized cross-channel metrics |
| Cost Profile | Free tool; the main cost is analyst time | Warehouse usage fees plus analyst SQL time | Quoted enterprise contract plus warehouse and engineering costs | Predictable SaaS subscription |
| AI Exploration Readiness | Basic charts | Manual SQL prompts | Gemini-powered conversational analytics on LookML | Plain-language questions that build charts, depending on the tool |
The decision framework below outlines the primary criteria for selecting between enterprise modeling, lightweight cloud reporting, and turnkey platforms.
No more lag in data management. Unlock the power of the OROVA Insight system to sync O2O (Online-to-Offline) data flows and visualize every report in real time.
OROVA Insight: Integrate Online - Offline data, visualize reports in Real-time.
Future Trends in Google Looker and Semantic BI: Author Perspective
The trajectory of enterprise analytics suggests significant architectural shifts across cloud ecosystems. Below are three key trends that I believe will define the next phase of business intelligence:
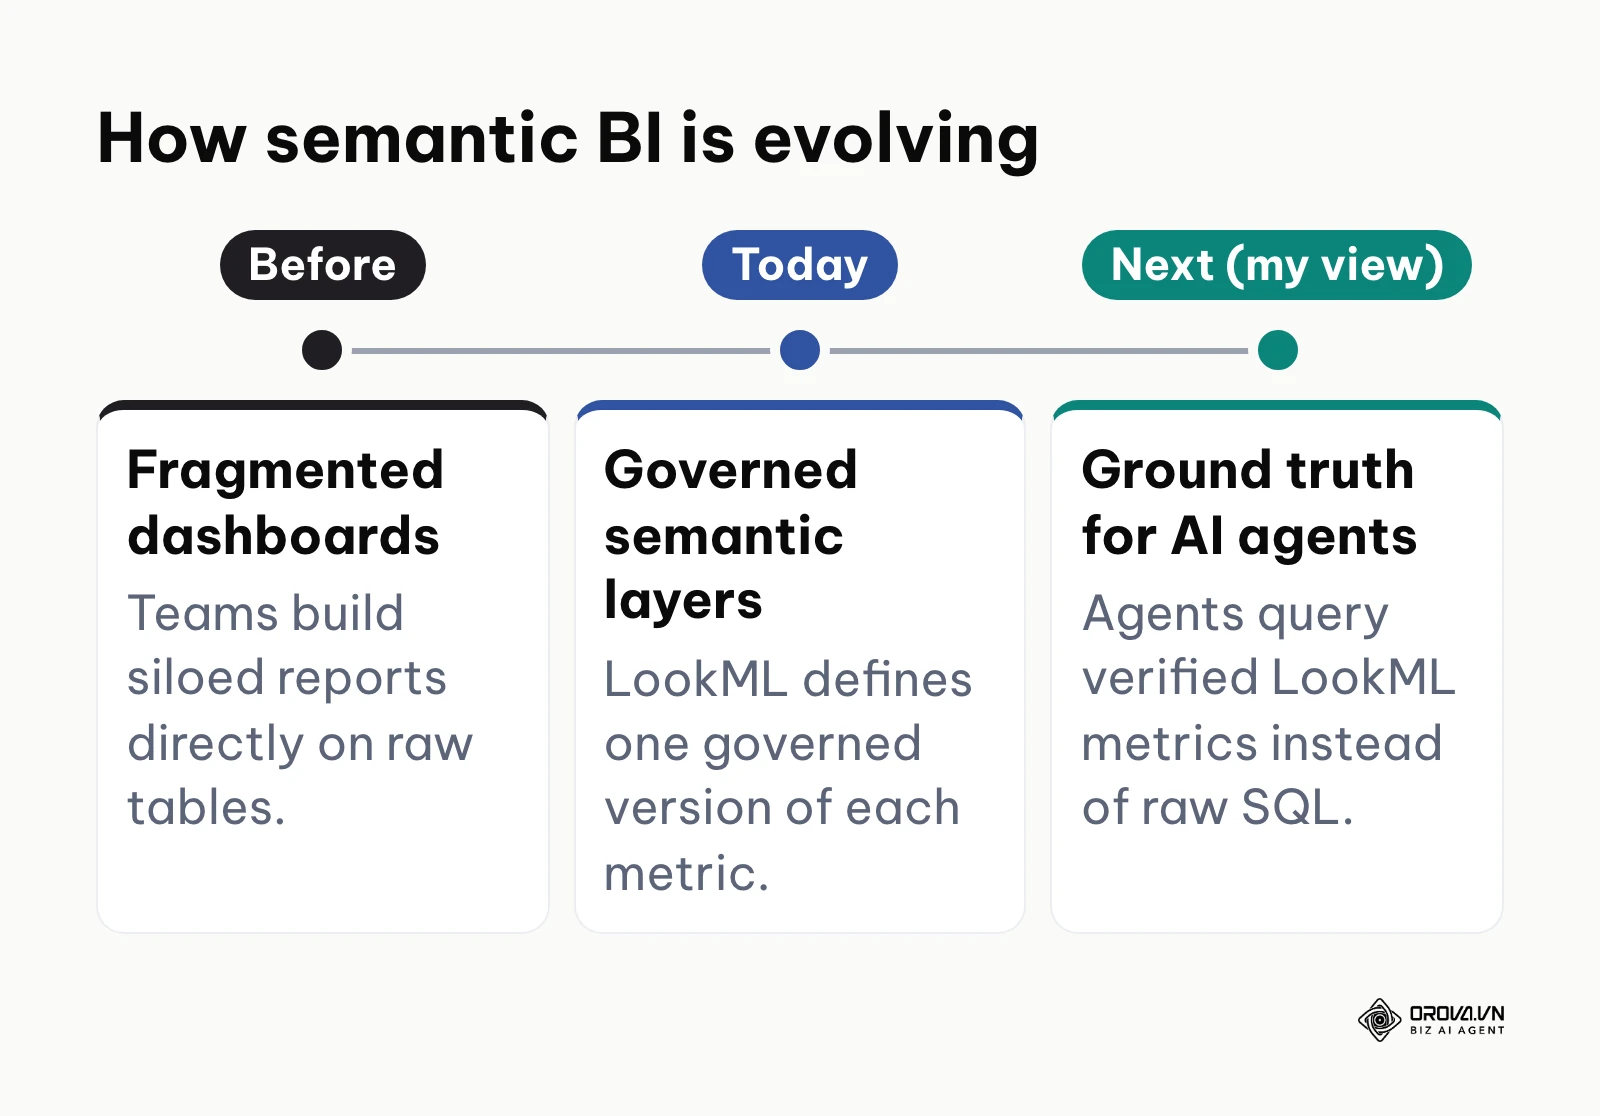
Semantic Layers Will Become the Mandatory Foundation for Autonomous AI Agents
Today, enterprise teams observe that generative AI models hallucinate when querying raw warehouse schemas directly because language models lack commercial context. In my view, the semantic layer is likely to evolve from a human dashboard modeling tool into the primary ground truth layer for autonomous AI agents. Rather than writing raw SQL, autonomous agents will query verified LookML interfaces to retrieve governed business data before triggering external business operations. To prepare, data teams should start documenting dimensions and measures with explicit business definitions today. This prediction could prove incorrect if foundation model providers develop self-correcting schema reasoning that infers context without curated models.
Looker Core and Looker Studio Will Converge into a Unified Hybrid Spectrum
Today, organizations navigate an awkward operational gap between the high technical barrier of Looker Enterprise and the un-governed flexibility of Looker Studio. I expect Google Cloud to keep narrowing this divide by bringing governed LookML models closer to the Looker Studio canvas. Business users will likely gain the ability to build visual drag-and-drop reports freely while binding individual sensitive charts to governed LookML models on demand. Forward-looking teams should organize their reporting layers cleanly today, avoiding un-governed report sprawl. This projection could fail if Google decides to preserve strict licensing paywalls to drive enterprise cloud infrastructure commitments.
Headless Metrics Architectures Will Force Enterprise BI Platforms toward Open Protocols
Today, developers increasingly resist proprietary vendor lock-in, favoring decoupled metric layers that define business logic outside monolithic visualization platforms. I argue that Looker will face intensifying pressure to expose LookML definitions as open metric application programming interfaces (APIs). Instead of restricting modeled metrics to the Looker web portal, organizations will demand that LookML serve verified calculations to external notebooks, spreadsheets, customer applications, and competing front-ends alike. Engineering leaders should design modular metric logic today rather than burying core business rules inside proprietary visualization widgets. This trend may reverse if enterprise buyers continue favoring single-vendor integrated ecosystems over modular tooling.
Frequently Asked Questions about Google Looker
Is Google Looker still necessary now that generative AI can write SQL queries?
Yes, Google Looker is more essential with AI because large language models require verified business context to generate accurate queries. While generative AI can write valid SQL syntax, it cannot know your organization's specific definition of revenue or active users without a semantic layer. LookML constrains AI queries to governed metrics, preventing expensive and inaccurate hallucinations.
Do small and medium marketing teams need Looker Enterprise, or is Looker Studio sufficient?
Small and medium marketing teams rarely need Looker Enterprise, as the platform requires substantial financial commitments and dedicated LookML engineering talent. Looker Studio paired with Google BigQuery export provides sufficient analytical power for most growing marketing teams at a fraction of the cost. Enterprise Looker becomes necessary only when dozens of departmental users require unified metric governance across complex relational databases.
What does Google Looker really cost to run?
The real cost of Google Looker has three parts: the platform license quoted by Google Cloud sales, cloud warehouse compute and storage fees, and the engineers who build and maintain LookML. For most mid-market and enterprise deployments, the people cost is as significant as the license itself, so get a written quote and a warehouse usage estimate before committing.
Why does the Looker Studio GA4 connector fail with quota exceeded errors, and how do you resolve it?
Direct Looker Studio connections fail because Google Analytics 4 enforces strict hourly and concurrent token limits on its Data API. When multiple dashboard tiles refresh simultaneously, the request quota exhausts and charts collapse. You can permanently resolve this by exporting GA4 data into Google BigQuery and connecting Looker Studio to clean, flattened BigQuery tables instead.
Can Google Looker connect to databases other than Google BigQuery?
Yes, Google Looker connects to many SQL databases and cloud warehouses beyond BigQuery, including Snowflake, Amazon Redshift, Databricks, and PostgreSQL. Looker generates SQL specific to the connected database dialect, allowing organizations to maintain their semantic layer regardless of where underlying data resides.
How long does an initial LookML semantic modeling rollout typically take?
An initial LookML deployment for a mid-market company usually takes several weeks to a few months. This timeline includes connecting warehouse schemas, defining foundational views and dimensions in Git, building persistent derived tables, and validating Explores with business stakeholders before opening self-service access.
Where Should You Start with Google Looker?
Choosing your starting point depends entirely on the maturity of your existing data infrastructure and operational workflows.
If your organization is starting with nothing: do not purchase enterprise software licenses. Instead, dedicate a single afternoon to inventorying your five most critical commercial metrics, writing down their exact calculation formulas on paper, and confirming that department heads agree on how customer acquisition and revenue are defined. Establishing agreed business logic before touching software prevents costly modeling mistakes later.
If you operate a disconnected stack with scattered advertising accounts, marketing channels, and isolated spreadsheets: spend an afternoon connecting your primary data streams into a central repository or a consolidated marketing reporting tool. Standardizing campaign naming conventions and establishing consistent timestamp formatting across your channels provides clean inputs that any downstream analytics platform can readily consume.
If your team is already tracking data without measuring outcomes, maintaining bloated dashboards that stakeholders rarely open: conduct a two-hour audit to identify and archive every reporting tile that does not directly influence a weekly operating decision. Trimming reporting clutter down to three actionable scorecards forces teams to focus on commercial impact before introducing complex modeling layers.
Taking these foundational steps helps your team build a reliable analytics culture before investing significant capital into enterprise data modeling with google looker.
About the author

Builder of Orova
Nguyễn Đỗ Trọng Ân has 8 years of experience in marketing, including 6 years managing market development across Asia. He builds Orova, a Biz AI Agent that never sleeps: it plans, runs and optimizes work for businesses.
Run your business with AI Agents
Orova is the always-on Biz AI Agent — it plans, runs, and optimizes the work for you.
Save time, unlock productivity.