
Google search console reports explained: what each report measures

Google search console reports are the free diagnostic screens Google gives every site owner to show how the site performs in Google Search: which queries bring clicks, which pages are indexed, how fast pages feel to real users, whether structured data is valid, who links to you, whether a penalty or security issue exists, and how Googlebot crawls your server. You publish a new post, optimize the title, and wait for visitors, but weeks later the organic traffic needle barely moves. Without these reports you are guessing whether Google even knows the page exists. This guide walks through each report one by one: what it measures, which columns to read first, and the misreadings that send people chasing the wrong problem.
What are Google search console reports?
Google search console reports are diagnostic dashboards provided directly by Google to help website owners track organic search visibility, identify technical indexing errors, and monitor user experience metrics. Unlike general web analytics tools that track post-click user behavior, these reports focus exclusively on pre-click performance data directly from the search engine.
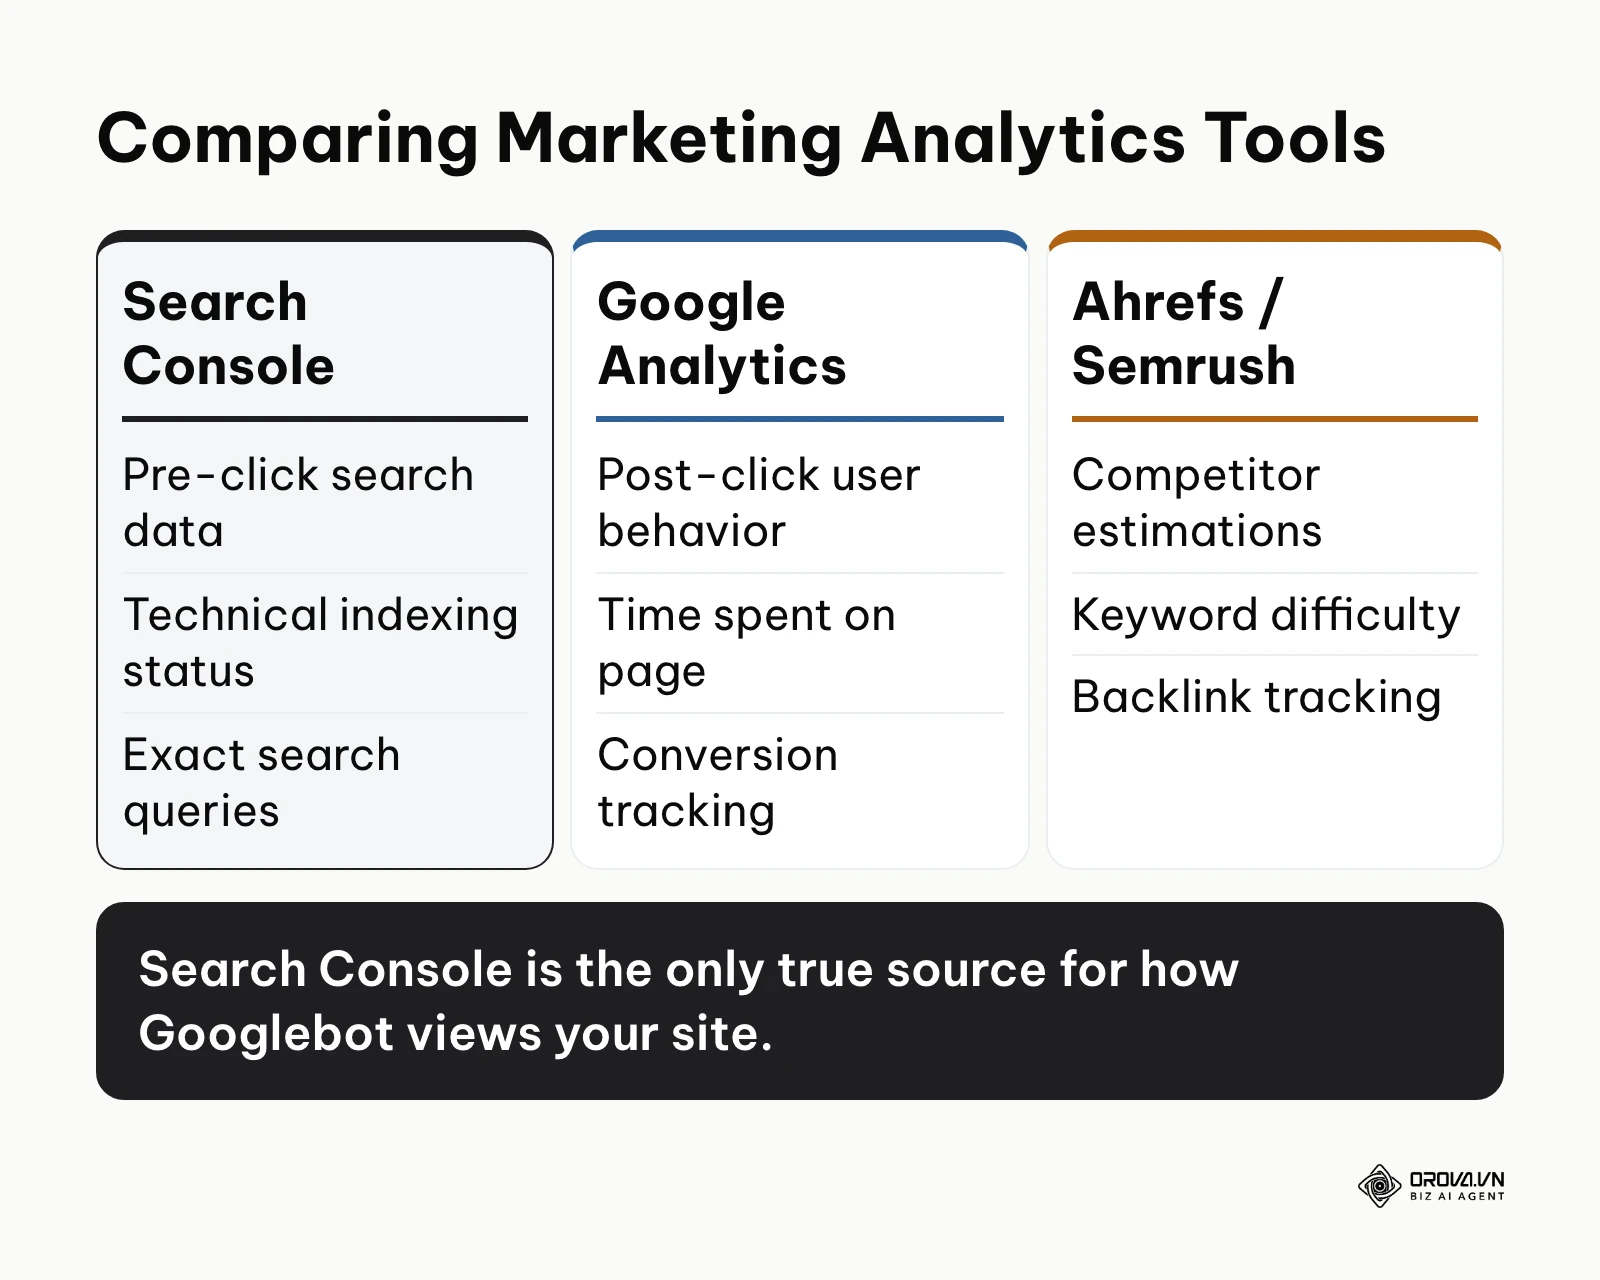
Originally launched as "Google Webmaster Tools" back in 2006, the platform was rebranded to Search Console in 2015. The name change was a deliberate move to reflect its broader audience; it was no longer just for technical webmasters managing servers, but for marketing professionals, content creators, and business owners who needed to understand their search presence. Despite its popularity, many beginners still confuse its purpose with other platforms.
| Concept | How it differs from Search Console | Example |
|---|---|---|
| Google Analytics 4 | Measures user behavior after they load your site. | Tracking how many minutes a user spends reading an article. |
| Ahrefs / Semrush | Estimates data using third-party scrapers and clickstream data. | Checking the theoretical keyword difficulty of a competitor. |
| Google Ads | Tracks paid search performance and financial ad spend. | Monitoring the Cost-Per-Click (CPC) of a specific campaign. |
Everyday Example: Imagine your website is a physical retail store on a busy street. Google Analytics tells you which aisles your customers walk down and what they put in their shopping carts once they are inside. Google Search Console, on the other hand, tells you how many people walked past your window display, what they stopped to read on your exterior sign, and whether the front door is jammed so they cannot physically enter the building.
The Significance of Google Search Console Reports in Your Data Ecosystem
The digital landscape is incredibly vast, and without a reliable compass, your optimization efforts can easily get lost in a sea of algorithmic changes. Google Search Console exists to solve a fundamental problem for website owners, SEO professionals, and developers: the severe lack of transparency from search engines. Before these comprehensive reports were widely available, determining exactly why a specific page was not ranking was an exercise in pure speculation.
In the broader picture of your digital marketing ecosystem, these reports sit at the very beginning of the user journey. They represent the critical "discovery and consideration" phase that occurs on the Search Engine Results Page (SERP) before a user even decides to visit your site. The workflow flows sequentially from Search Console (discovery) to Google Analytics (engagement) and finally to your CRM (conversion). If you choose to ignore this foundational tool, you lose the ability to detect critical technical failures, such as server configuration errors that silently block crawlers. More importantly, you lose access to the exact search queries driving your audience, forcing you to operate completely blind.
Why Search Console Clicks Rarely Match GA4 Sessions
One of the most persistent frustrations for digital marketers is the glaring discrepancy between the Clicks reported in Search Console and the Sessions reported in Google Analytics 4. Beginners often panic when GA4 reports noticeably fewer organic sessions than the clicks shown in GSC.
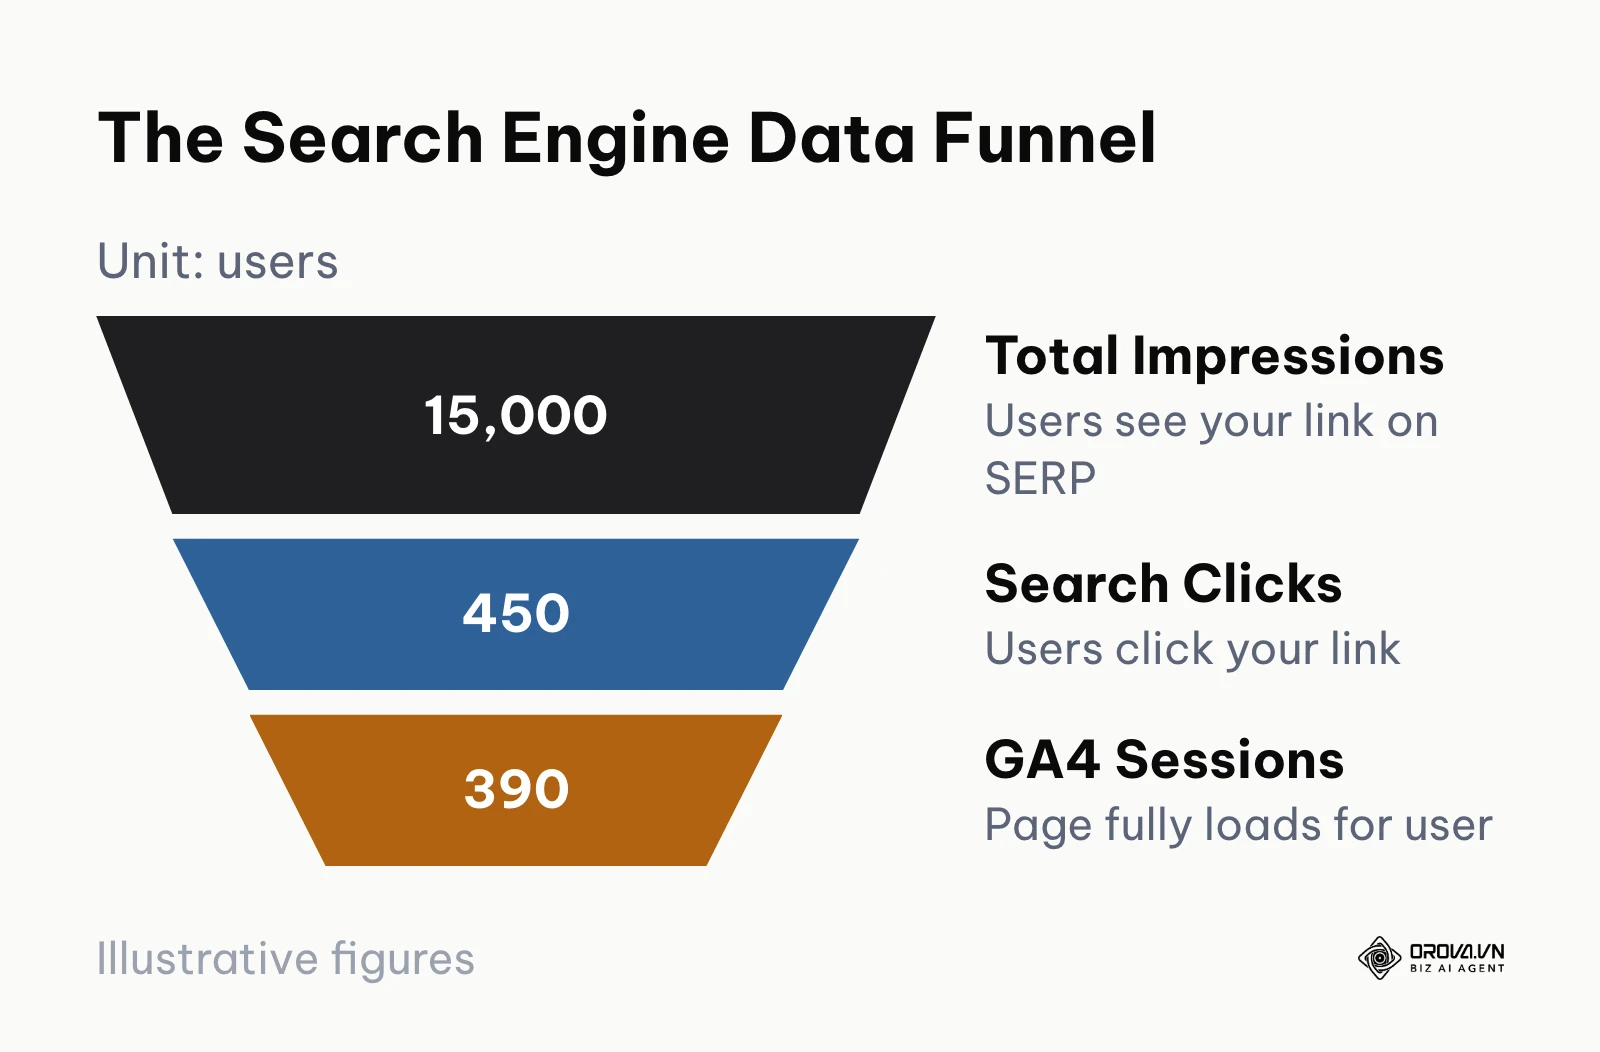
Why does this frustrating mismatch happen? The answer lies in the fundamental way each platform defines and records a metric. A "Click" in Search Console is recorded the exact millisecond a user clicks your link on the SERP. However, a "Session" in GA4 is only recorded if the Javascript tracking code embedded on your website fully loads and executes in the user's browser. If a user clicks your link, but your server is slow and they close the tab before the page renders, Search Console accurately counts a click, but GA4 records absolutely nothing.
Furthermore, the data processing rules differ wildly. Search Console only counts clicks from Google's own results. GA4, depending on your setup, might include traffic from other search engines (like Bing or DuckDuckGo) in its "Organic Search" bucket unless you explicitly filter for the "Google" source.
To effectively bridge this gap and stop comparing apples to oranges, you must link your Search Console account directly into your GA4 property. This crucial integration allows you to view pre-click query data alongside post-click engagement metrics (like bounce rate and conversion rate) within a single interface, giving you a truly holistic view of the entire user journey.
When you don't need it yet: If you have just launched a single-page personal portfolio today, or if your business model relies entirely on outbound cold-calling and you do not expect to acquire customers through organic search, obsessing over these reports daily is a massive waste of time. In the first few weeks of a new website's life, there is simply not enough historical data to make statistical decisions. Instead of refreshing the dashboard waiting for impressions, you should focus your efforts on creating high-quality foundational content, networking in your industry, and building initial brand awareness through social media channels.
Business Values and Direct Benefits of Google Search Console Reports
Implementing a rigorous, scheduled review of your search data yields substantial returns across two distinct layers: strategic business value for stakeholders (focusing on money, time, and risk) and tactical benefits for the individuals executing the daily campaigns.
Protecting Revenue Through Early Error Detection
For the business owner or executive, the most critical value this platform provides is severe risk mitigation. A sudden server configuration error, an expired SSL certificate, or a poorly coded plugin update can accidentally deploy a "noindex" tag, effectively blocking search engine crawlers. Without continuous monitoring, this fatal issue could persist for weeks unnoticed, resulting in a serious loss of organic sales. By acting as an early warning system, the platform ensures technical glitches are caught before they devastate the bottom line.
Example illustration:
- Context: A mid-sized e-commerce store that earns most of its revenue from organic search.
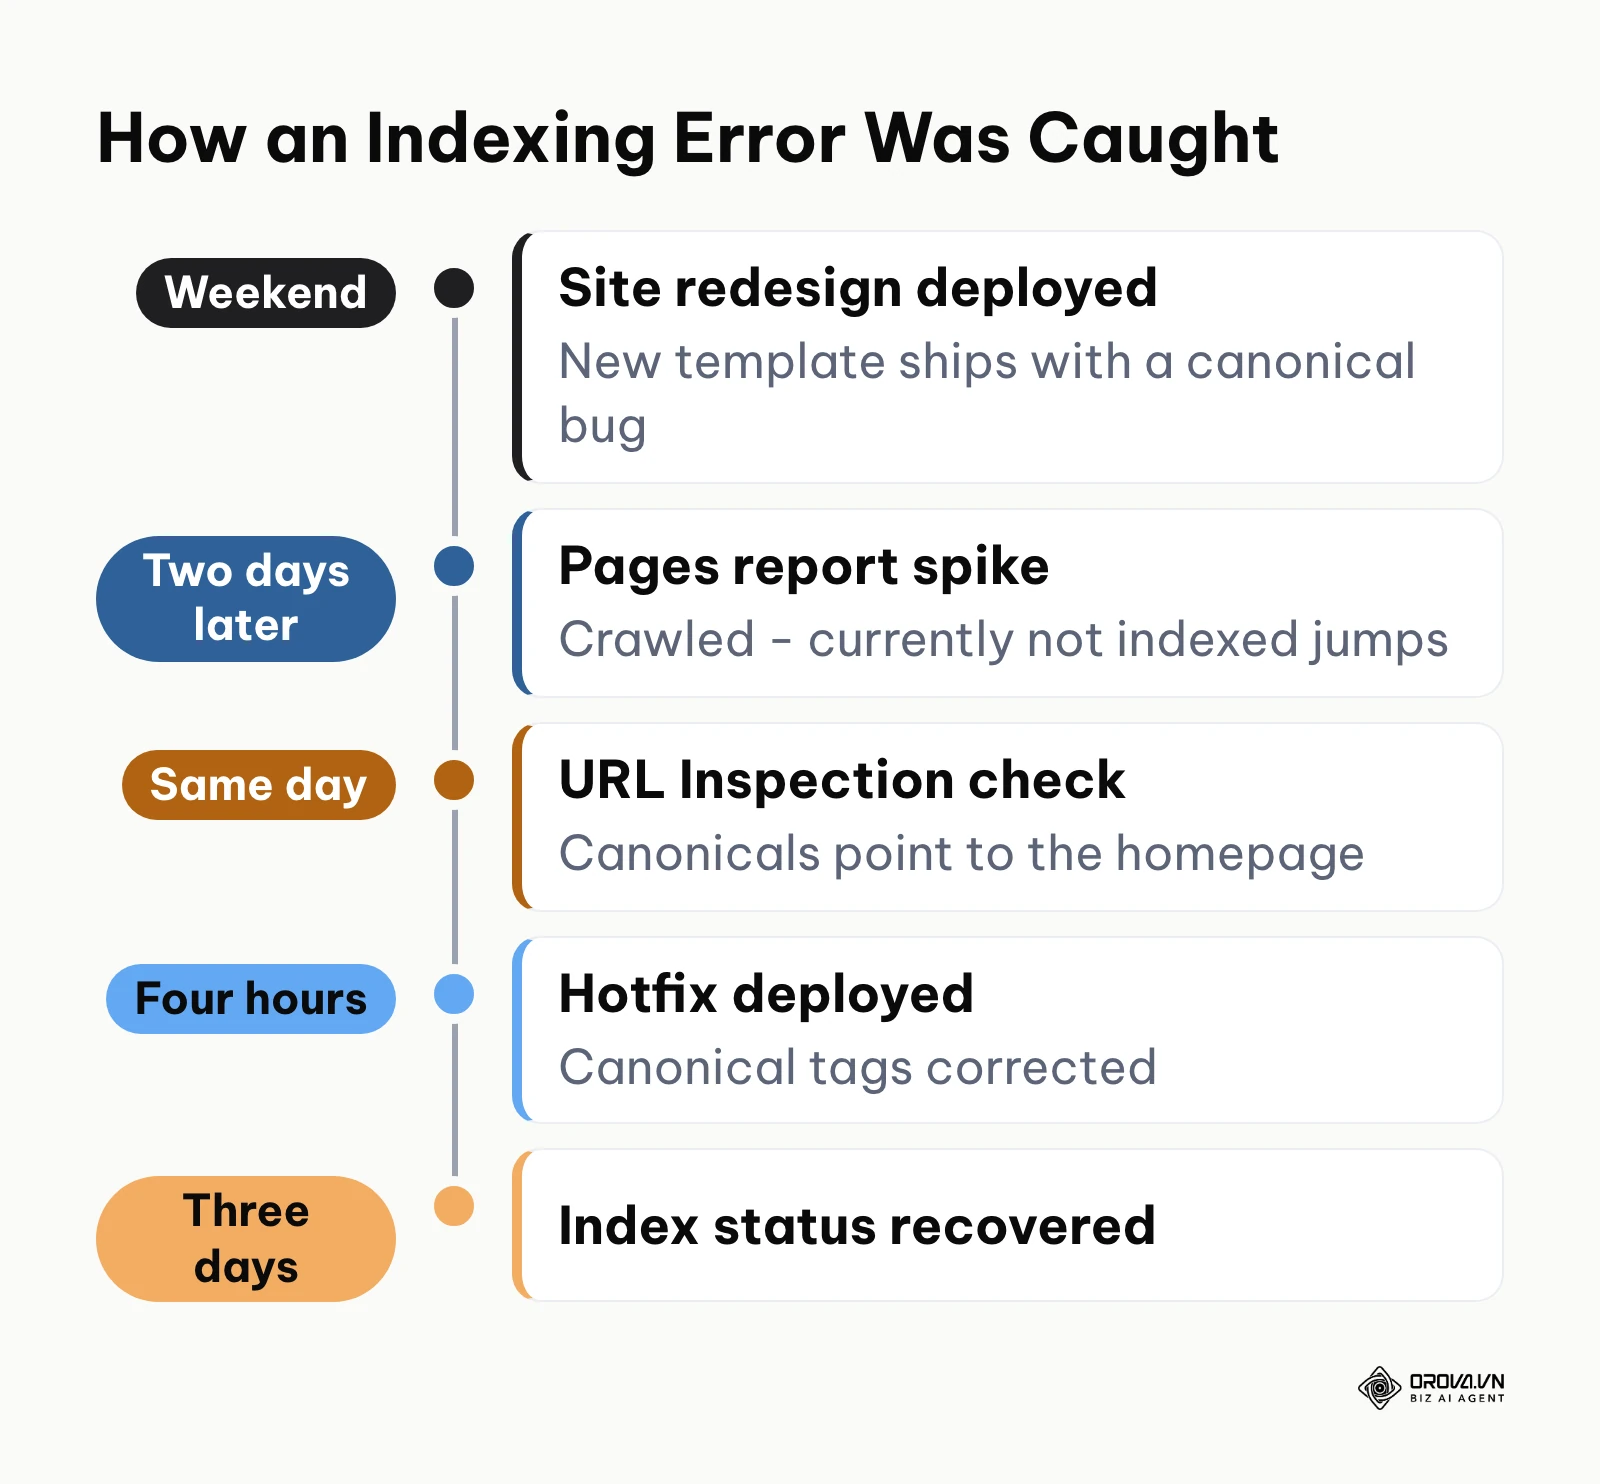
- Steps: The development team deployed a massive site-wide aesthetic redesign over the weekend. Two days later, the SEO manager checked the Pages report (under Indexing) and noticed an unprecedented spike in "Crawled - currently not indexed" pages affecting the entire product catalog. They quickly investigated the affected URLs using the URL Inspection tool.
- Stumble and fix: The development team initially argued it was a temporary caching issue and refused to roll back. The SEO manager exported the specific URLs from the report, proving that hardcoded canonical tags in the new template were pointing every single product page back to the homepage, creating a massive loop. Armed with this undeniable data, they forced a hotfix deployment within four hours.
- Result: The site successfully recovered its index status within three days, avoiding what would have been a costly month of lost product traffic.
Prioritizing Content Updates
For the direct worker, the SEO specialist, content writer or marketing coordinator, the Performance report replaces guesswork about which old articles to update. Pages that already collect many impressions on page two of the results are usually the cheapest wins. The exact filtering routine for finding them is laid out in Google Search Console for SEO: 8 practical workflows, so this guide focuses on how to read the columns correctly.
Saving Engineering Time on Technical Audits
For development teams and technical SEOs, debugging crawling issues without direct feedback can be a massive time sink. The specific, granular error logs provided by Google essentially eliminate the need to constantly run heavy third-party crawling tools for basic diagnostics. The reports provide the exact URLs, the specific error code (like a 503 Service Unavailable), and the precise timestamp when Googlebot encountered the problem, streamlining the QA process.
| Benefit | Measured By Which Metric | Seen After How Long |
|---|---|---|
| Revenue Protection | Drop in 404 and 5xx errors | 1 to 3 days |
| Targeted Traffic Growth | Increase in Non-Branded Clicks | 4 to 8 weeks |
| Development Efficiency | Engineering hours saved on debugging | Immediately |
Discover Orova.vn – a Biz AI Agent platform with OROVA SEO, a complete solution for every website. The system supports search engine optimization from A to Z with features including keyword research, writing new SEO-ready articles, optimizing existing content, rank tracking, plus competitor analysis and in-depth technical analysis. Sign up today to experience OROVA SEO completely free (offer valid through July 7, 2027).
How Google Search Console Reports Work: Report by Report
Search Console groups its reports into seven areas: Performance, Indexing (the Pages report), Experience, Enhancements, Links, Security & Manual actions, and Crawl stats. Each one answers a different question, uses a different data source, and has its own way of misleading a hurried reader. This section explains what each report measures, which columns deserve your attention, and the most common misreading. If you want step-by-step routines built on top of these reports, see Google Search Console for SEO: 8 practical workflows; for a structured health check, follow the Google Search Console SEO audit.
The Performance Report: Clicks, Impressions, CTR and Position
What it measures: how your pages appear in Google Search, Discover and Google News. The search results view takes real user searches as input and returns four metrics: Clicks, Impressions, Click-Through Rate (CTR) and Average Position. You can break them down by Query, Page, Country, Device, Search appearance and Date.
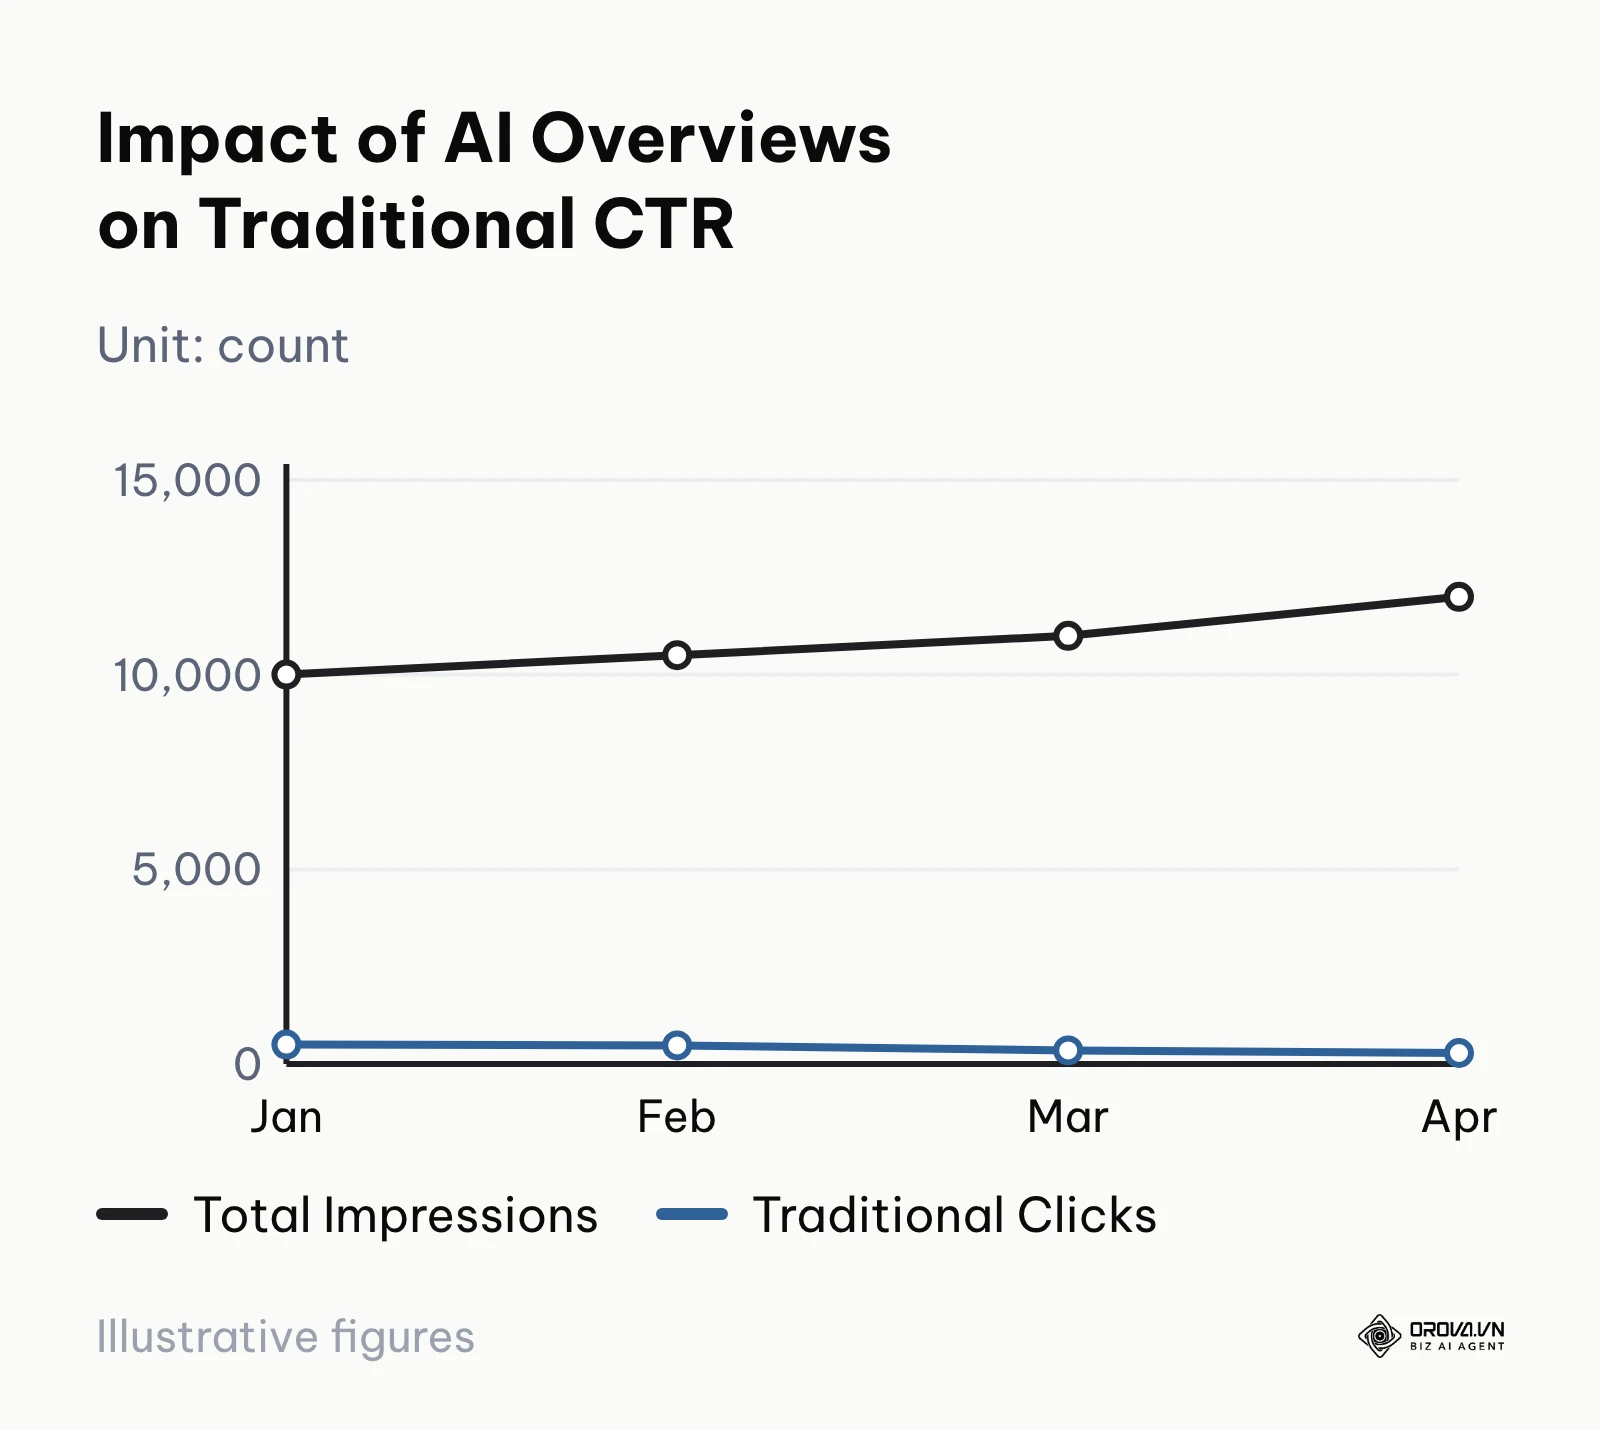
Which columns to read: start with Impressions and Clicks side by side. Impressions tell you whether Google still shows you; clicks tell you whether people still choose you. CTR is only meaningful when you compare similar queries, because a brand query and a generic question naturally have very different click rates. Average Position is calculated from the topmost position your site held each time it was shown, then averaged, so one page ranking 2 for a niche query and 40 for a broad one can produce a misleading "21".
Common misreadings:
- Reading site-wide Average Position as a ranking. It is a blend of every query, so it can drop simply because you started appearing for many new long-tail queries at low positions.
- Expecting the query table to add up to the total. Google hides rare, potentially identifying queries for privacy, so the sum of the rows is usually lower than the chart total.
- Treating today's numbers as final. Data usually arrives with a delay of a couple of days, and the report keeps a limited history, so export what you need for long-term comparisons.
- Blaming content for every CTR drop. AI Overviews and other SERP features can push classic results down. Your page may still record an impression while far fewer people click, so stable impressions with falling clicks often point to a changed results page rather than a weaker page.
The Pages Report (Indexing): Which URLs Google Keeps
What it measures: the Pages report, which replaced the older Coverage report, sorts every URL Google knows on your property into two buckets: Indexed and Not indexed. Under Not indexed, it lists the reason for each group of URLs. The same Indexing area also holds the Sitemaps report, which shows whether your submitted sitemaps were read, and the Removals tool.
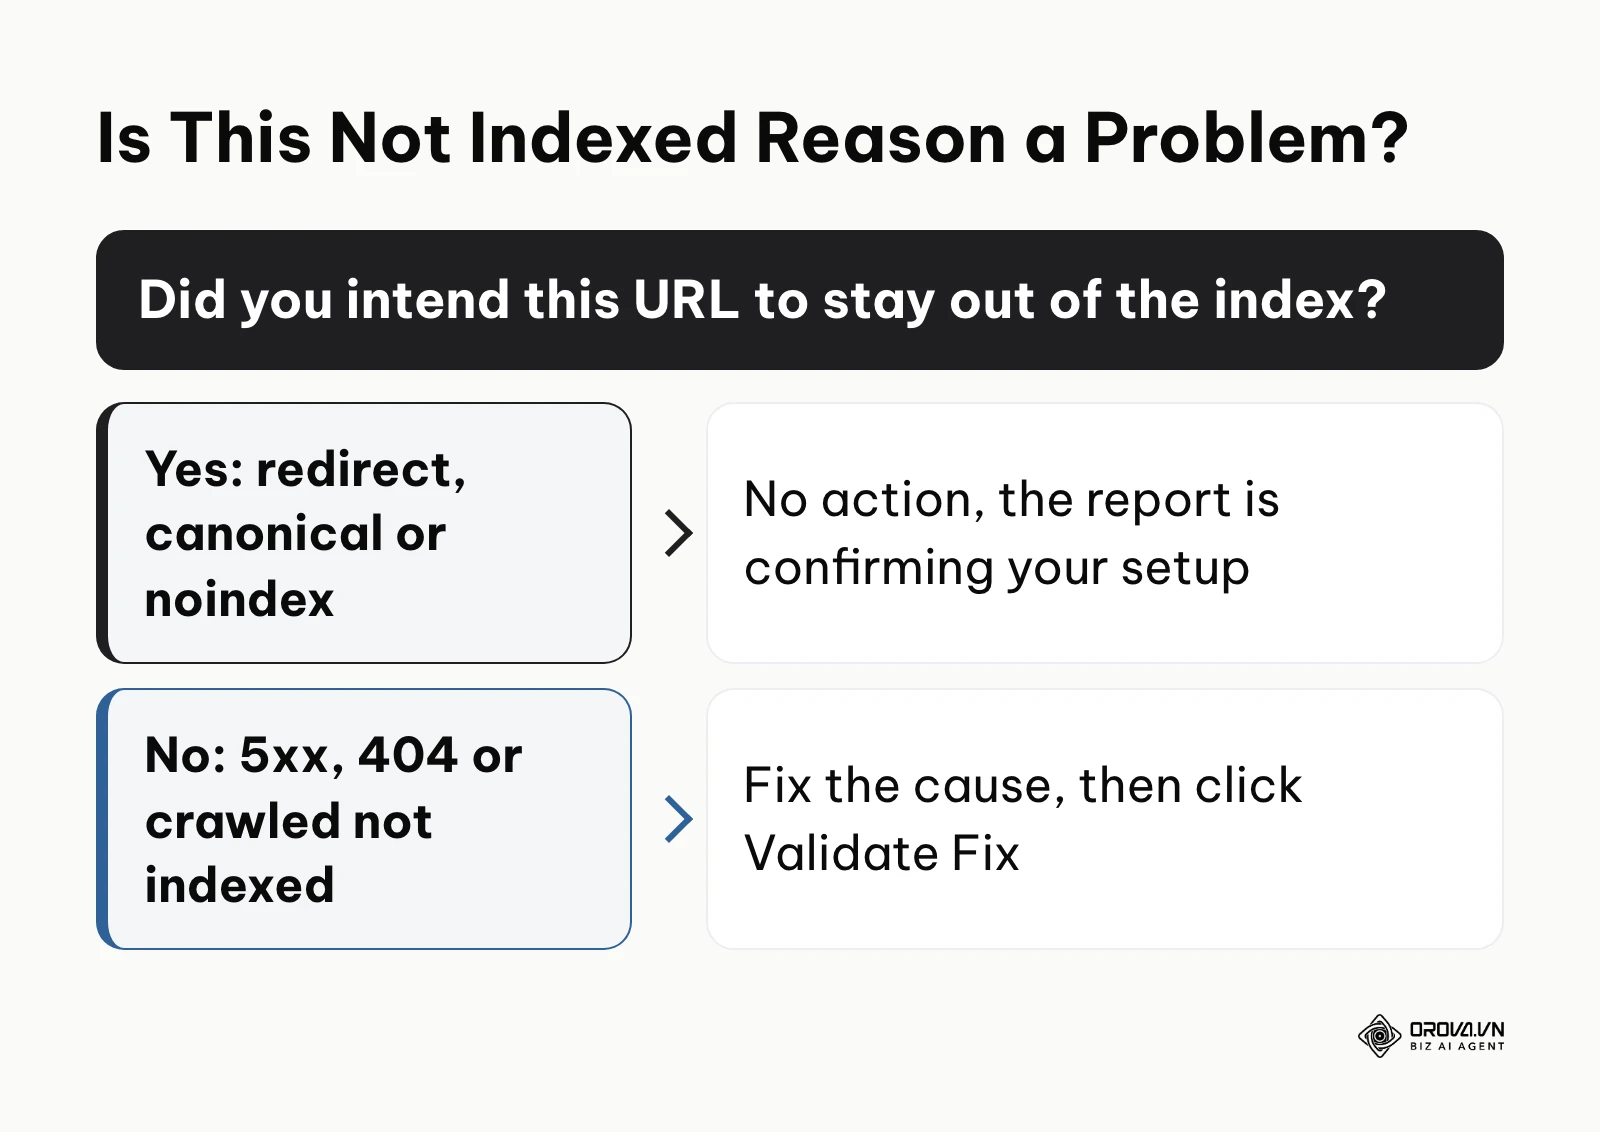
Which columns to read: for each reason, look at Source (Website means something on your side caused it, Google means it was Google's choice), Validation (whether you have asked Google to recheck a fix) and Pages (how many URLs are affected). Click a reason to see example URLs, then open any URL in the URL Inspection tool to see the live status.
Common misreadings:
- Treating every "Not indexed" URL as an error. "Alternate page with proper canonical tag", "Page with redirect" and "Excluded by 'noindex' tag" are often exactly what you intended.
- Confusing the two "currently not indexed" statuses. "Discovered - currently not indexed" means Google knows the URL but has not crawled it yet; "Crawled - currently not indexed" means Google fetched it and decided not to keep it, which usually points to quality or duplication. To understand the mechanics behind both, read How search engines work: crawling, indexing, ranking and serving.
- Assuming the example list is complete. The report shows a sample of affected URLs, not necessarily all of them.
When traffic suddenly falls, the Pages report is where you check whether the drop is technical. The full diagnostic routine (core update versus technical fault) is covered step by step in the 8 practical workflows guide, so it is not repeated here.
Example illustration:
- Context: An agency SEO specialist managing a lead-generation blog for a B2B client.
- Steps: The client reported a sharp overnight drop in organic traffic. The specialist opened the Pages report and saw a new "Server error (5xx)" reason growing quickly from the day before.
- Stumble and fix: The hosting provider insisted uptime was fine. The specialist ran a live test in the URL Inspection tool, which showed Googlebot receiving a 503 error. A new firewall rule was blocking Google's crawler as if it were an attack.
- Result: After the firewall rule was adjusted, the specialist clicked Validate Fix in the report, crawling resumed and traffic returned to its usual level over the following days.
The Experience Report: Core Web Vitals and HTTPS
What it measures: the Experience area now combines two reports: Core Web Vitals and HTTPS. The older standalone Mobile Usability report is no longer part of Search Console. Core Web Vitals uses real-world, anonymized field data from the Chrome User Experience Report (CrUX) and rates groups of similar URLs as Good, Needs improvement or Poor for loading (Largest Contentful Paint), responsiveness (Interaction to Next Paint) and visual stability (Cumulative Layout Shift). The HTTPS report shows which indexed pages are served over HTTPS and which are not.
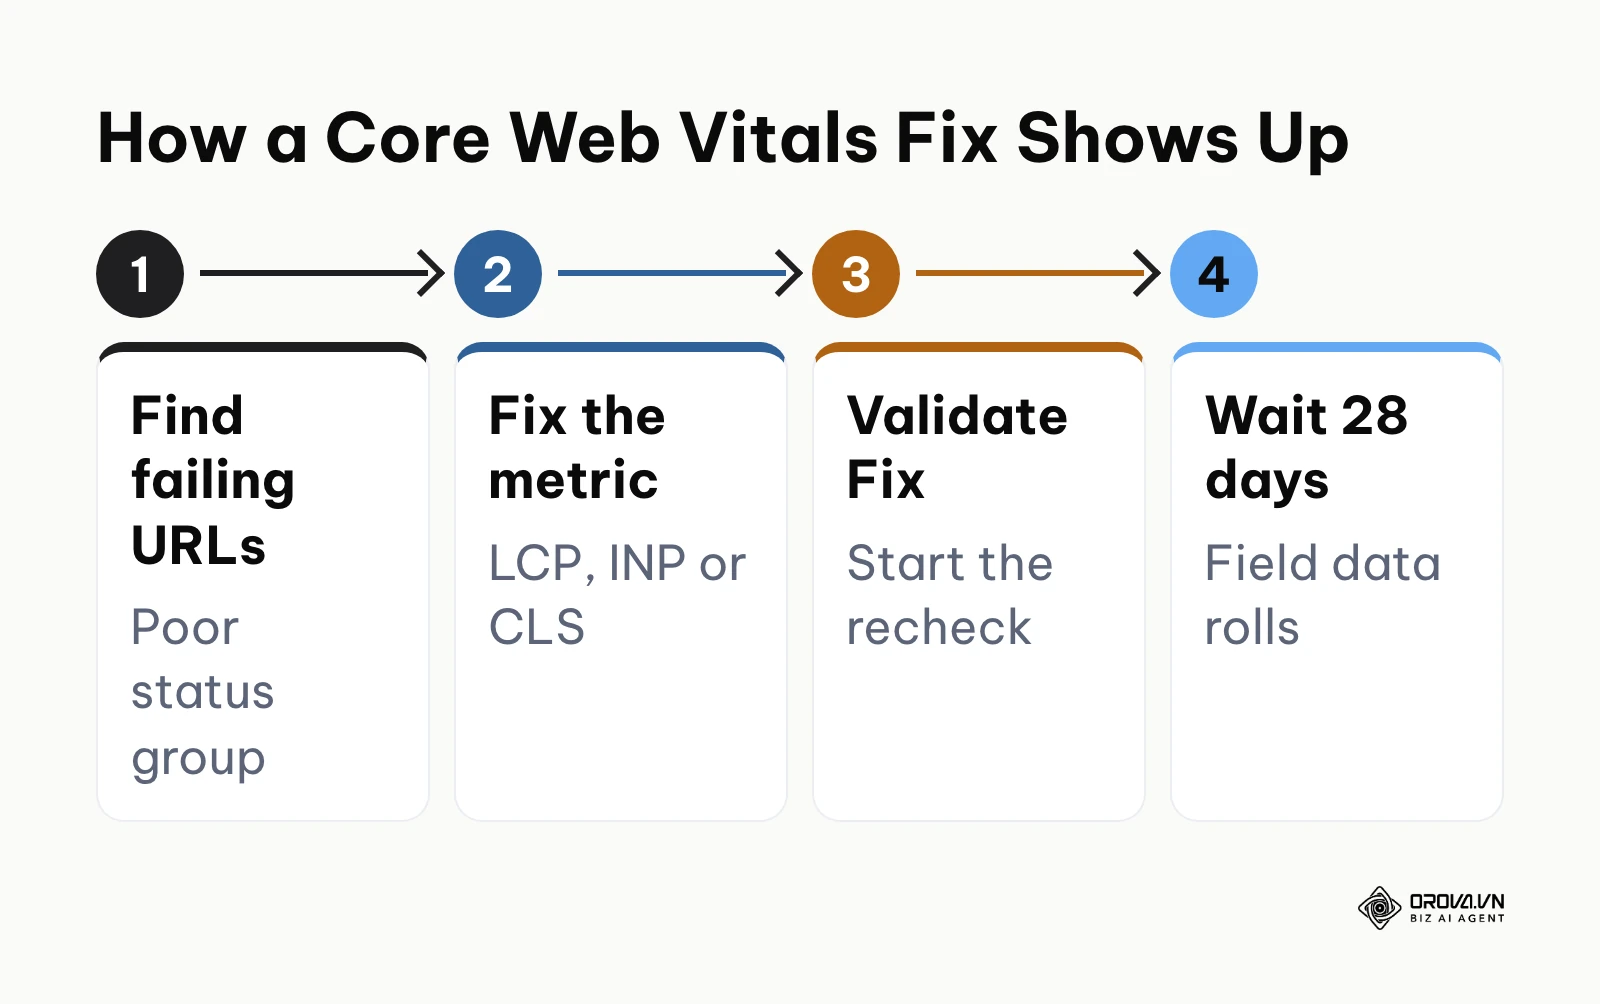
Which columns to read: the mobile and desktop charts are separate, so check both. Click a status to see the URL groups, the metric that failed, and the group's aggregate value. Google's "Good" thresholds are an LCP of 2.5 seconds or less, an INP of 200 milliseconds or less, and a CLS of 0.1 or less.
Common misreadings:
- Expecting a fix to show up the next day. Field data is collected over a rolling 28-day window, so improvements appear gradually, even after you click Validate Fix.
- Reading one example URL as the whole problem. URLs are grouped by similarity, and the example only represents the group.
- Assuming an empty report means a fast site. Pages without enough real Chrome traffic have no field data, so a small site may see "Not enough data" rather than a pass.
Mobile experience still matters under mobile-first indexing; without the old Mobile Usability report, check tap targets and font sizes with Lighthouse or Chrome DevTools instead.
Enhancements and Merchant Listings: Rich Result Eligibility
What it measures: the Enhancements section reads the structured data (Schema markup, usually JSON-LD) on your pages and reports, per rich result type, which items are valid and which have errors. Typical reports include Product snippets, Merchant listings, Breadcrumbs, Review snippets and Videos, depending on what your site uses. A report only appears when Google finds that type of markup on your site.
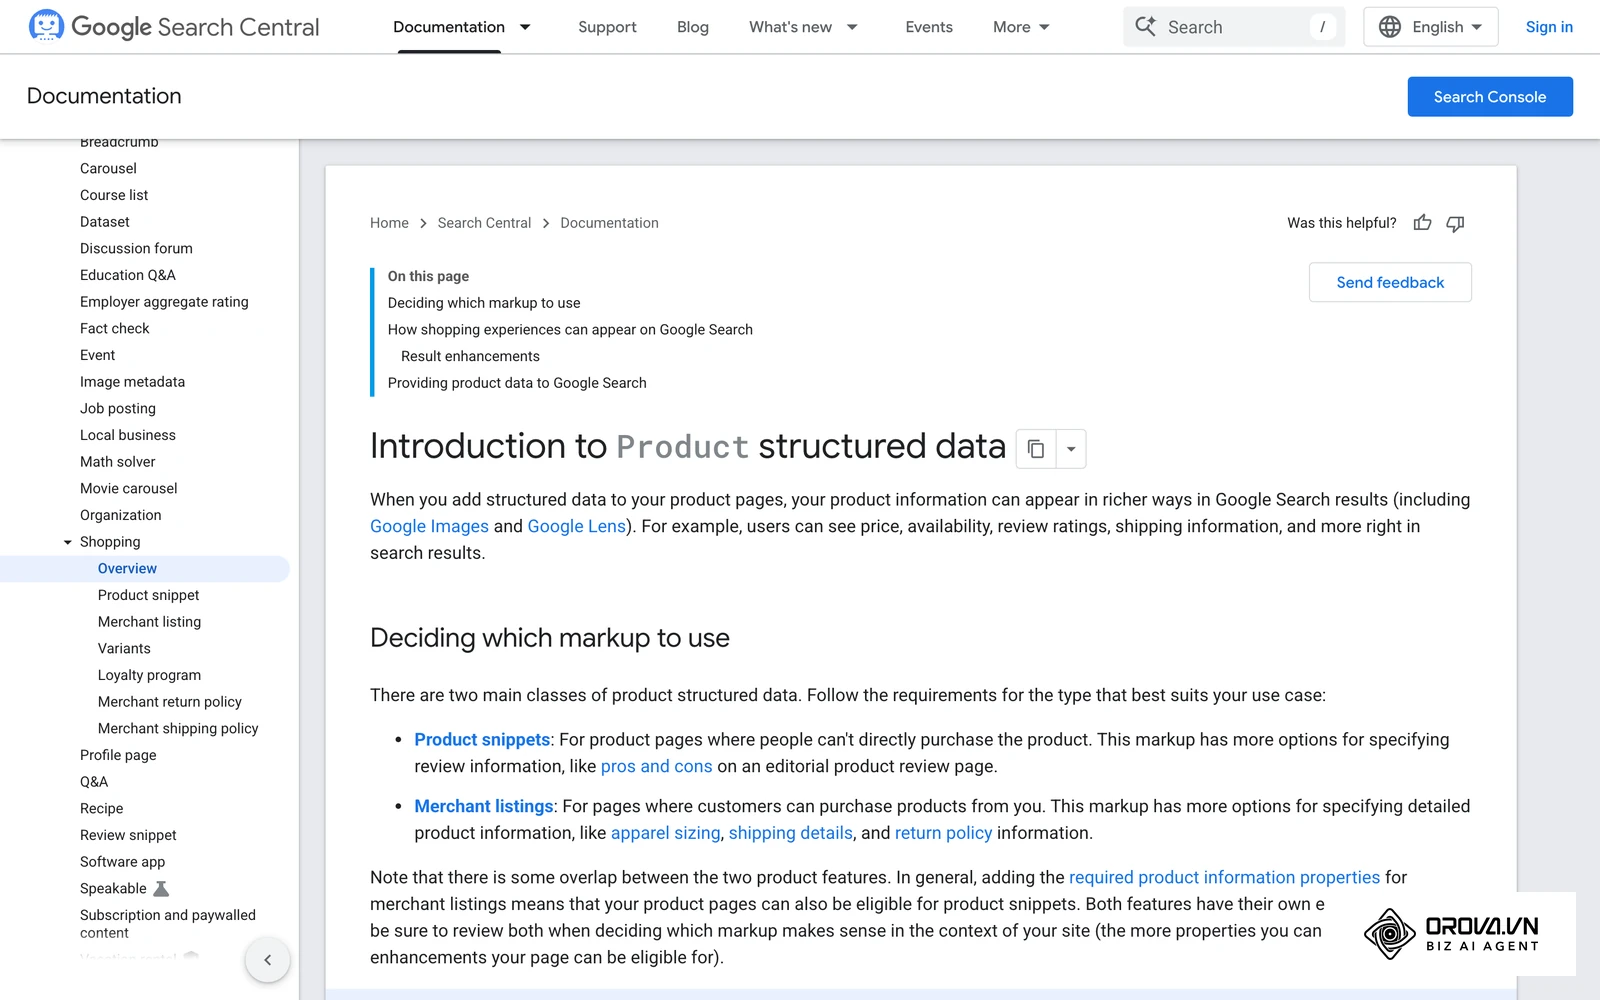
Which columns to read: the split between Invalid and Valid items, then the issue name (for example a missing required field such as "offers", "review" or "aggregateRating") and the number of affected items.
Common misreadings:
- Treating "Valid" as a promise. Valid markup makes a page eligible for a rich result; Google still decides whether to show it.
- Chasing retired rich results. Google stopped showing FAQ rich results from May 7, 2026, so FAQ markup is no longer a reason to expect extra space in the results page.
- Ignoring warnings on product pages. Missing optional fields do not block eligibility, but they can make your listing less complete than a competitor's.
Example illustration:
- Context: An e-commerce marketing manager for a growing jewelry brand running on WooCommerce.
- Steps: They noticed their best-selling products had lost their review stars in Google. In the Product snippets report, 200 items were flagged as Invalid because of a missing "aggregateRating" or "review" field.
- Stumble and fix: A random schema plugin conflicted with the theme and broke the checkout layout. After rolling it back, they had a developer add the correct JSON-LD to the product template.
- Result: About two weeks after validation, the stars returned and the organic CTR of those pages rose from 2.1% to 4.5%.
The Links Report: Who Links to You and How You Link Internally
What it measures: the Links report summarizes links Google has found, in four tables: Top linked pages (external links), Top linking sites, Top linking text, and Internal links.
Which columns to read: in Internal links, compare the number of internal links pointing to each important page; a key page with very few internal links is a structural warning sign. In Top linking text, check whether external anchors describe your pages accurately.
Common misreadings:
- Treating it as a full backlink database. The report shows a sample and is not updated in real time.
- Expecting disavowed links to disappear. Links you disavowed can still be listed, because the report shows links found, not links counted.
For an architecture workflow based on this report, see step 8 of the 8 practical workflows guide.
Security & Manual Actions: The Reports You Want to Stay Empty
What it measures: Manual actions lists penalties applied by a human reviewer at Google for violating spam policies, with the reason, the affected pages or sections, and a Request Review button once you have fixed the problem. Security issues lists detections such as hacked content, malware and social engineering (deceptive pages).
Which columns to read: the issue type and the sample URLs. Fix every listed page, not only the examples, before you request a review.
Common misreadings:
- Reading "No issues detected" as "nothing is wrong". Algorithmic ranking changes, including core updates, never appear here.
- Requesting a review too early. A rejected request costs time; describe exactly what you fixed and how.
Crawl Stats: How Googlebot Spends Time on Your Server
What it measures: the Crawl stats report, found under Settings rather than in the main menu, shows Googlebot's crawling history for your site: Total crawl requests, Total download size and Average response time, plus Host status (robots.txt fetching, DNS resolution and server connectivity). It is available for root-level properties, such as a Domain property.
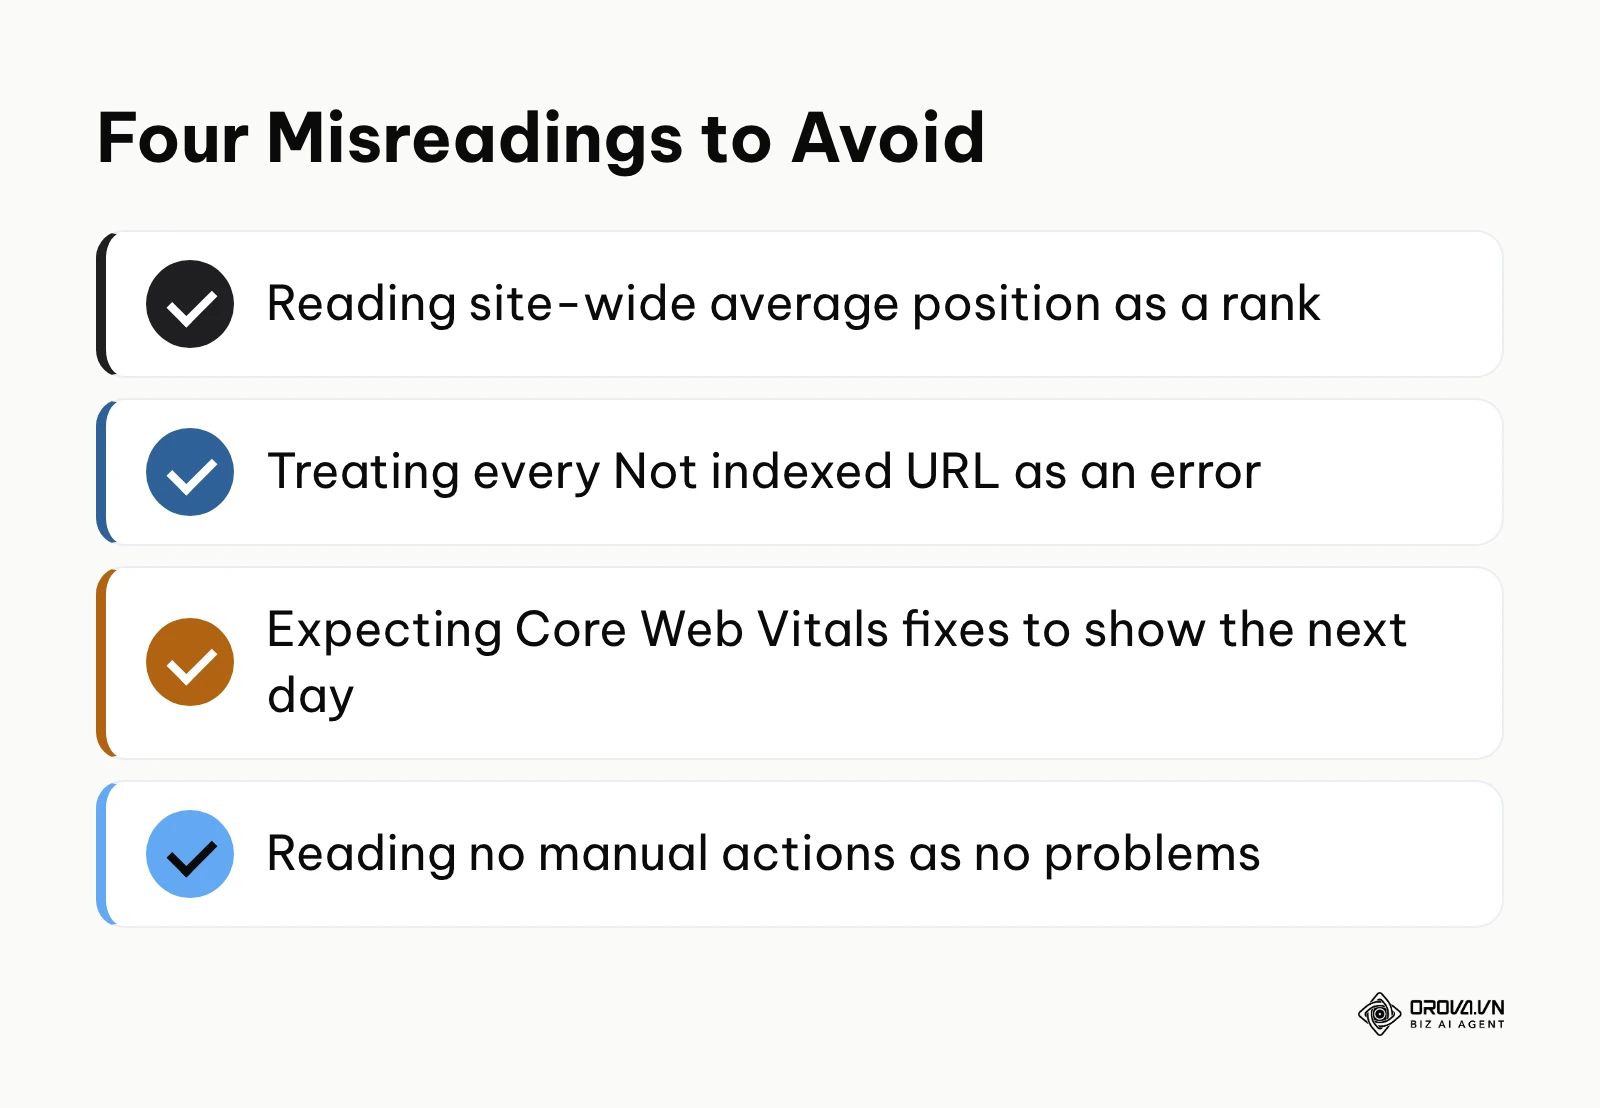
Which columns to read: the breakdowns by response code, file type, purpose (Discovery for new URLs, Refresh for known ones) and Googlebot type. A rising share of 5xx or 404 responses, or a jump in average response time, is the early signal worth acting on.
Common misreadings:
- Treating more crawling as better. A crawl spike can mean Google is wasting requests on parameter URLs or redirect chains.
- Ignoring Host status. A red host status means Google had trouble reaching your server, which affects every other report.
| Report | What it measures | Column to read first | Common misreading |
|---|---|---|---|
| Performance | Clicks, impressions, CTR, position | Impressions vs Clicks | Treating site-wide average position as a rank |
| Pages (Indexing) | Indexed vs not indexed URLs | Reason + Source | Treating every "Not indexed" as an error |
| Experience | Core Web Vitals and HTTPS | Status per URL group | Expecting fixes to show the next day |
| Enhancements | Structured data validity | Invalid items + issue | Treating "Valid" as guaranteed rich results |
| Links | External and internal links | Internal links per page | Using it as a complete backlink list |
| Security & Manual actions | Penalties and security problems | Issue type + sample URLs | Reading "no issues" as "no problems" |
| Crawl stats | Googlebot activity on your server | Response codes + Host status | Treating more crawling as better |
With OROVA.VN and the OROVA SEO module, you put an end to the exhausting days of manual work for good. Instead of struggling for hours to write articles and compile reports, the entire process is now optimized and completed in just 5 minutes.
What to Do to Start Adapting to Google Search Console Reports
Adopting this powerful tool requires vastly different approaches depending on your daily role and technical expertise. While executing a comprehensive Google Search Console SEO audit is a fantastic starting point to establish a baseline, the daily and weekly habits you build matter much more for long-term success.
For Small Business Owners
As a busy founder wearing multiple hats, you absolutely do not need to live inside the diagnostic dashboard. Your goal is high-level oversight.
- Week 1: Verify your domain ownership using the DNS TXT record method (this is the most secure and permanent method compared to uploading HTML files).
- Week 2: Locate your website's XML sitemap (usually at /sitemap_index.xml) and submit it to the Sitemaps report to accelerate discovery.
- Monthly: Briefly check the Performance report and filter by your brand name. Ensure that your branded queries (people searching for your exact company name) are maintaining a high CTR and position 1.
- Quarterly: Check the "Security & Manual Actions" tab. If there is a manual penalty listed here, your site has been flagged for violating spam policies, and you must hire a professional immediately.
For In-house SEO Managers
You need a rigorous, structured, and highly analytical approach to consistently prove ROI to your stakeholders.
- Daily: Spend a few minutes checking the Overview page for unexpected spikes in Pages report errors or sudden drops in total clicks.
- Weekly: Export the Performance data to a spreadsheet to track the specific CTR of your top 20 revenue-driving landing pages. If the CTR drops while impressions hold, investigate the SERP for new competitors.
- Bi-weekly: Review the Experience report after any major code deployments by the engineering team to ensure new interactive features haven't degraded the INP or LCP metrics.
- Monthly: Review the "Crawled - currently not indexed" and "Discovered - currently not indexed" reasons in the Pages report. Identify pages with thin content and make a strategic decision to either rewrite them, redirect them, or intentionally delete them to conserve crawl budget.
For Agency SEO Specialists
Your primary goal is clear client communication and executing deep technical diagnostics that justify your retainer.
- Onboarding: Request "Owner" level access immediately, and as your very first task, link the client's GSC property directly to their GA4 account to unify the reporting pipeline.
- First 30 days: Read the Crawl stats report and the Pages report together, then use the URL Inspection tool on sample URLs to find canonical loops and wasted crawling.
- Ongoing: Check Security & Manual actions and the Experience report every month, and report Performance with clicks and impressions side by side.
| Common Mistake | Severe Consequence | How to Avoid It |
|---|---|---|
| Focusing solely on Clicks | Missing massive impression drops | Always analyze Clicks and Impressions side-by-side to spot visibility loss early. |
| Ignoring actual user intent | Wasting months optimizing the wrong keywords | Manually search the query on Google to see if they prefer videos, lists, or products. |
| Not submitting a sitemap | Incredibly slow discovery of new content | Submit the sitemap in the Sitemaps report and check that its status reads Success. |
Future Trends for Search Console in the Next Few Years: My Perspective
As the search ecosystem evolves at a breakneck pace, the tools we rely on must adapt or face obsolescence. Based on the subtle algorithmic shifts and technological advancements I am closely observing today, here are three critical trends that I believe will fundamentally shape the future of this platform.
AI Overviews Will Force a Restructuring of Performance Metrics
Looking at the SERPs today, generative AI answers are consuming massive amounts of premium real estate, pushing traditional links below the fold. I believe that within the next two to three years, Google may introduce a specific, isolated segment within the Performance report dedicated entirely to AI Overviews. Right now, impressions are frustratingly blended, making it nearly impossible to distinguish a traditional blue-link view from an AI citation view. I would not be surprised to see AI visibility reported separately from classic blue-link clicks. To prepare for this possible shift, you should start structuring your content defensively today—using clear, factual bullet points and strict hierarchical formatting that Large Language Models prefer to extract and cite.
Faster Indexing Diagnostics Will Matter More
Today, the Pages report updates with a delay, which frustrates publishers and e-commerce sites that change content daily. My view is that pressure for fresher indexing data will keep growing, and that push-style signals from sites to search engines will gradually play a bigger role alongside XML sitemaps rather than replacing them overnight. That is an opinion, not an announced plan, so keep your sitemaps healthy in the meantime.
Shift from Keyword Metrics to Entity and Intent Tracking
Today, the platform still heavily relies on exact string matching for queries (e.g., matching "best running shoes" exactly). I think the future of Search Console lies in deep semantic reporting. Rather than just showing a messy list of a thousand keyword variations, I believe the tool will begin automatically categorizing queries by their underlying entities and user intents (e.g., grouping everything under an "Informational Intent related to Footwear" bucket). To stay ahead of this curve, you must move beyond basic, repetitive keyword placement. You need to adopt a highly sophisticated holistic SEO approach that focuses on building deep topical authority rather than chasing isolated search volumes. Note that this is my personal projection; if global privacy regulations tighten significantly, Google may actually be forced to restrict query data further to protect user anonymity, rather than expanding it.
Frequently Asked Questions about google search console reports
Are Google search console reports still needed with AI search engines?
Absolutely. Even as AI-driven search engines and chatbots gain massive traction, Google remains the dominant, primary entry point for web navigation globally. Furthermore, the technical health data—such as Indexing statuses and Core Web Vitals—provided by these reports is essential for ensuring that any crawler, whether it is an AI language model or a traditional search bot, can effectively access, parse, and understand your website's architecture.
How often should I check the reports to avoid missing critical errors?
For most small to medium-sized businesses with relatively static content, checking the dashboard once a week is entirely sufficient to catch major issues before they cause damage. However, if you are actively migrating a website, changing domain names, or launching a massive redesign, you should monitor the Pages report and utilize the URL Inspection tool daily for the first two weeks to ensure a smooth, error-free transition.
Which Google search console report should I read first?
If you are entirely overwhelmed and must choose only one, the Performance report is undeniably the most critical starting point. It provides immediate, highly actionable data on exactly which queries are currently driving traffic and precisely where your low-hanging fruits lie, allowing you to prioritize your content optimization efforts efficiently without wasting time on vanity metrics.
Why does my Performance report show a sudden drop in impressions?
A sudden, steep drop in impressions typically indicates a severe loss of overall visibility, rather than just a loss of clicks due to an unappealing title. This alarming symptom could be due to a technical manual penalty, a sudden core algorithmic update pushing your pages off the first page, or simple seasonal trends. It is crucial to immediately cross-reference this drop with the Pages report and Crawl stats to rule out fatal server errors.
Where is the Crawl stats report in Google Search Console?
It is not in the main left-hand menu. Open Settings, then Crawl stats, and click Open report. It is available for root-level properties such as a Domain property, and it shows crawl requests, download size, average response time and host status.
Where to Start with Google Search Console Reports?
Implementing a truly data-driven culture takes time, patience, and a willingness to confront uncomfortable metrics. Depending on your current situation and technical maturity, your immediate next step will vary wildly. Here is exactly what you should do right now, in one single sitting, to build momentum.
If you have nothing yet: Do not worry about advanced optimization; your only goal today is verification. Go directly to the platform's landing page, select the "Domain property" option, and add the provided TXT record to your DNS provider (such as Cloudflare or your hosting panel). This secures data across all subdomains. Do not panic when the dashboard is empty; the platform needs a few days to begin collecting historical information. Make sure you also immediately submit your primary XML sitemap. For a deeper dive into foundational setup, you should carefully review the Google SEO optimization tool guide: Google's own toolkit and how to connect it.
If you have data but it is scattered: Your singular task for this session is technical integration. Log into your GA4 account, navigate deep into the Admin panel settings, find the "Search Console links" option located under Product Links, and formally connect your verified property. This single, five-minute action will permanently bridge the gap between your pre-click query data and your post-click engagement metrics, instantly eliminating the constant confusion between clicks and sessions during your monthly reporting.
About the author

Builder of Orova
Nguyễn Đỗ Trọng Ân has 8 years of experience in marketing, including 6 years managing market development across Asia. He builds Orova, a Biz AI Agent that never sleeps: it plans, runs and optimizes work for businesses.
Run your business with AI Agents
Orova is the always-on Biz AI Agent — it plans, runs, and optimizes the work for you.
Save time, unlock productivity.