
What is Looker Studio data? How to connect, refresh and optimize it

Looker Studio data is the layer of data sources (connector, field schema and credentials) that sits between your platforms, such as GA4, Google Ads, Google Sheets or BigQuery, and every chart in a report. When numbers look stale, charts show errors or a dashboard crawls, the cause almost always lives in this layer, not in the charts. (Google's help pages now call the product Data Studio again; the data source concepts below apply under either name.)
You have likely spent hours dragging and dropping charts, adjusting color palettes, and meticulously aligning text boxes, only to find that your dashboard remains empty, showing only a series of frustrating system errors. This is the exact moment most professionals realize that the visual interface is merely the surface of the reporting puzzle. The real engine driving any reliable, high-performing dashboard is your looker studio data configuration.
Historically, teams treated data connections as a minor setup step, simply clicking the "authorize" button and hoping for the best. However, this outdated mindset is exactly why reports shatter when a single column name changes, or why a dashboard takes three agonizing minutes to load during a critical client presentation. If the underlying data infrastructure is weak, the most beautifully designed charts become completely useless. This guide is built to change how you handle that infrastructure. Instead of just showing you where to click, this article explains how to connect, blend, refresh and optimize your data sources so your reports stay accurate, fast and reliable.
What is Looker Studio data?
Looker Studio data is the foundational layer of raw information that feeds your dashboards and reports. It acts as the bridge connecting external platforms to your visualization interface. Unlike static spreadsheet exports, it maintains an active pipeline, ensuring your charts display accurate metrics without requiring manual file uploads every week.
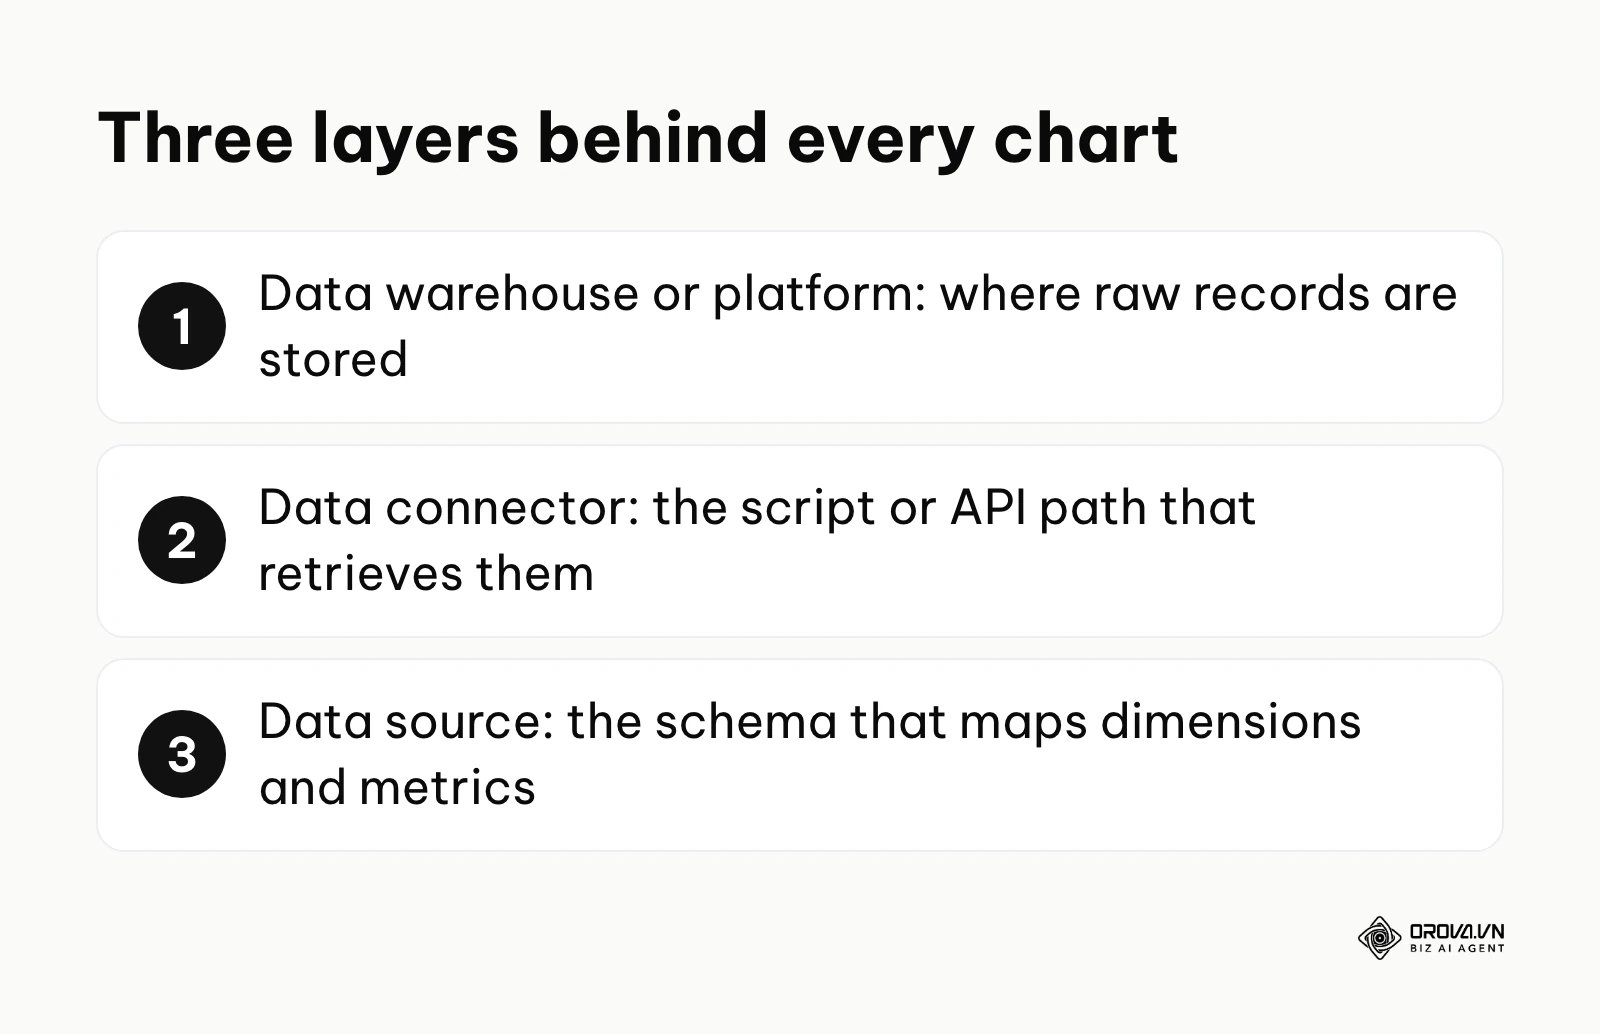
The terminology dates back to Google Data Studio, which was renamed Looker Studio in 2022; Google's current help pages use the name Data Studio again. Through every rename, the core concept of the 'Data Source' has stayed the same. It is a distinct entity that holds the connection schema, acting as the translator between your database and your screen.
Looker Studio data is frequently confused with other parts of the data ecosystem. Understanding the distinction is vital for proper setup.
| Concept | How it differs | Example |
|---|---|---|
| Data Source | This is the specific schema definition inside Looker Studio that maps dimensions and metrics. | The internal Looker file named "GA4 - Website Setup". |
| Data Connector | The actual software script or API path that retrieves the information from the outside world. | The native Google Analytics connector or a Supermetrics connector. |
| Data Warehouse | The external database where raw information is permanently stored before being connected. | A Google BigQuery project holding years of historical logs. |
To understand this easily, imagine the plumbing system in a modern house. The water reservoir holding all the water is your database. The actual pipes carrying the water are the data connectors. The Looker Studio data source is the specific faucet mechanism that dictates whether the water comes out hot or cold, while the dashboard itself is merely the sink you see.
The strategic role of Looker Studio data
Looker Studio data exists to solve a massive operational problem: organizational data silos. Modern businesses generate metrics across dozens of platforms. Marketing teams use Meta Ads and Google Analytics, sales teams use a CRM (Customer Relationship Management platform), and finance teams rely on dedicated accounting software. Without a centralized data layer, understanding holistic business performance requires downloading CSV files from every single platform and manually pasting them together.
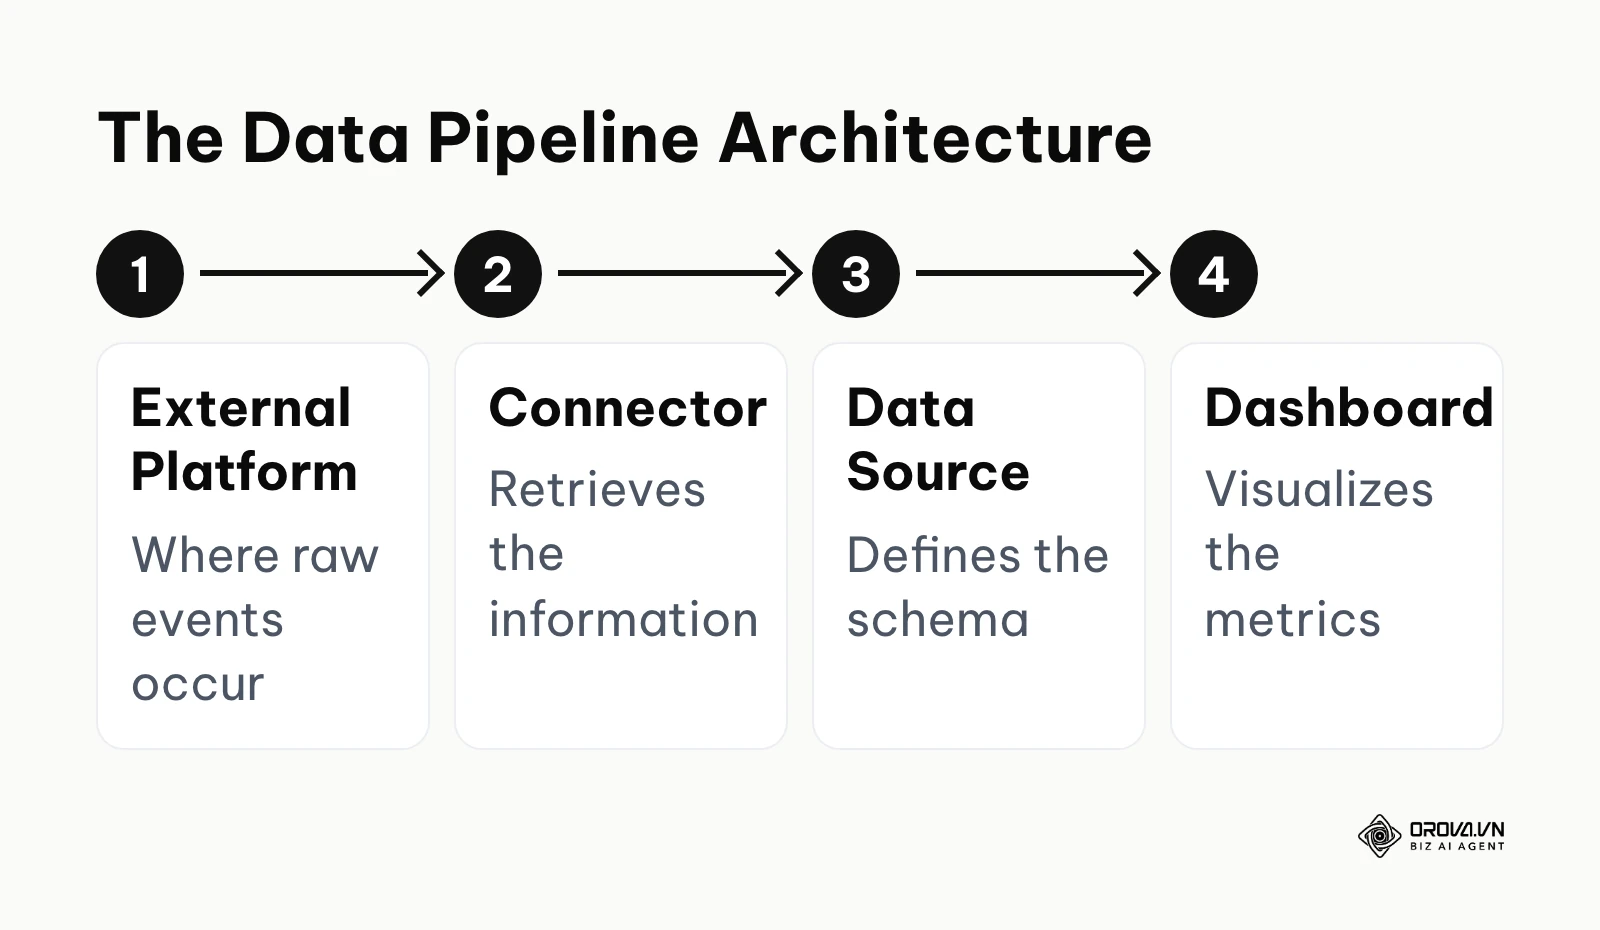
The Looker Studio data layer sits exactly in the middle of this chaotic landscape. It is positioned directly between the raw storage environments and the final presentation layer. Its strategic purpose is to translate the unique, proprietary API languages of various software platforms into a single, unified visual format that non-technical stakeholders can understand. If you skip over properly architecting this layer, the consequences are severe. You will inevitably face broken reports, agonizingly slow dashboard load times, and a high risk of exposing sensitive financial information to the wrong viewers due to mismanaged credentials.
When you don't need Looker Studio data: If your company only reviews a handful of high-level performance metrics once a quarter, setting up complex data pipelines is a massive waste of resources. A simple spreadsheet presentation might suffice. Similarly, if you are building an enterprise-grade financial forecasting system that requires complex real-time predictive modeling and strict compliance auditing, a lightweight visualization tool might not be enough. In those specific cases, you should invest directly in dedicated business intelligence software or use basic spreadsheet charts.
If you are new to the tool itself, start with our guide to what Looker Studio is and how its reports work; this article focuses on the data layer underneath those reports.
Business value and benefits of optimized data connections
Investing time in configuring your Looker Studio data correctly yields massive returns, but these benefits manifest differently depending on your role in the organization. We must separate the high-level business value from the practical advantages experienced by the people building the reports.
Value for the broader business
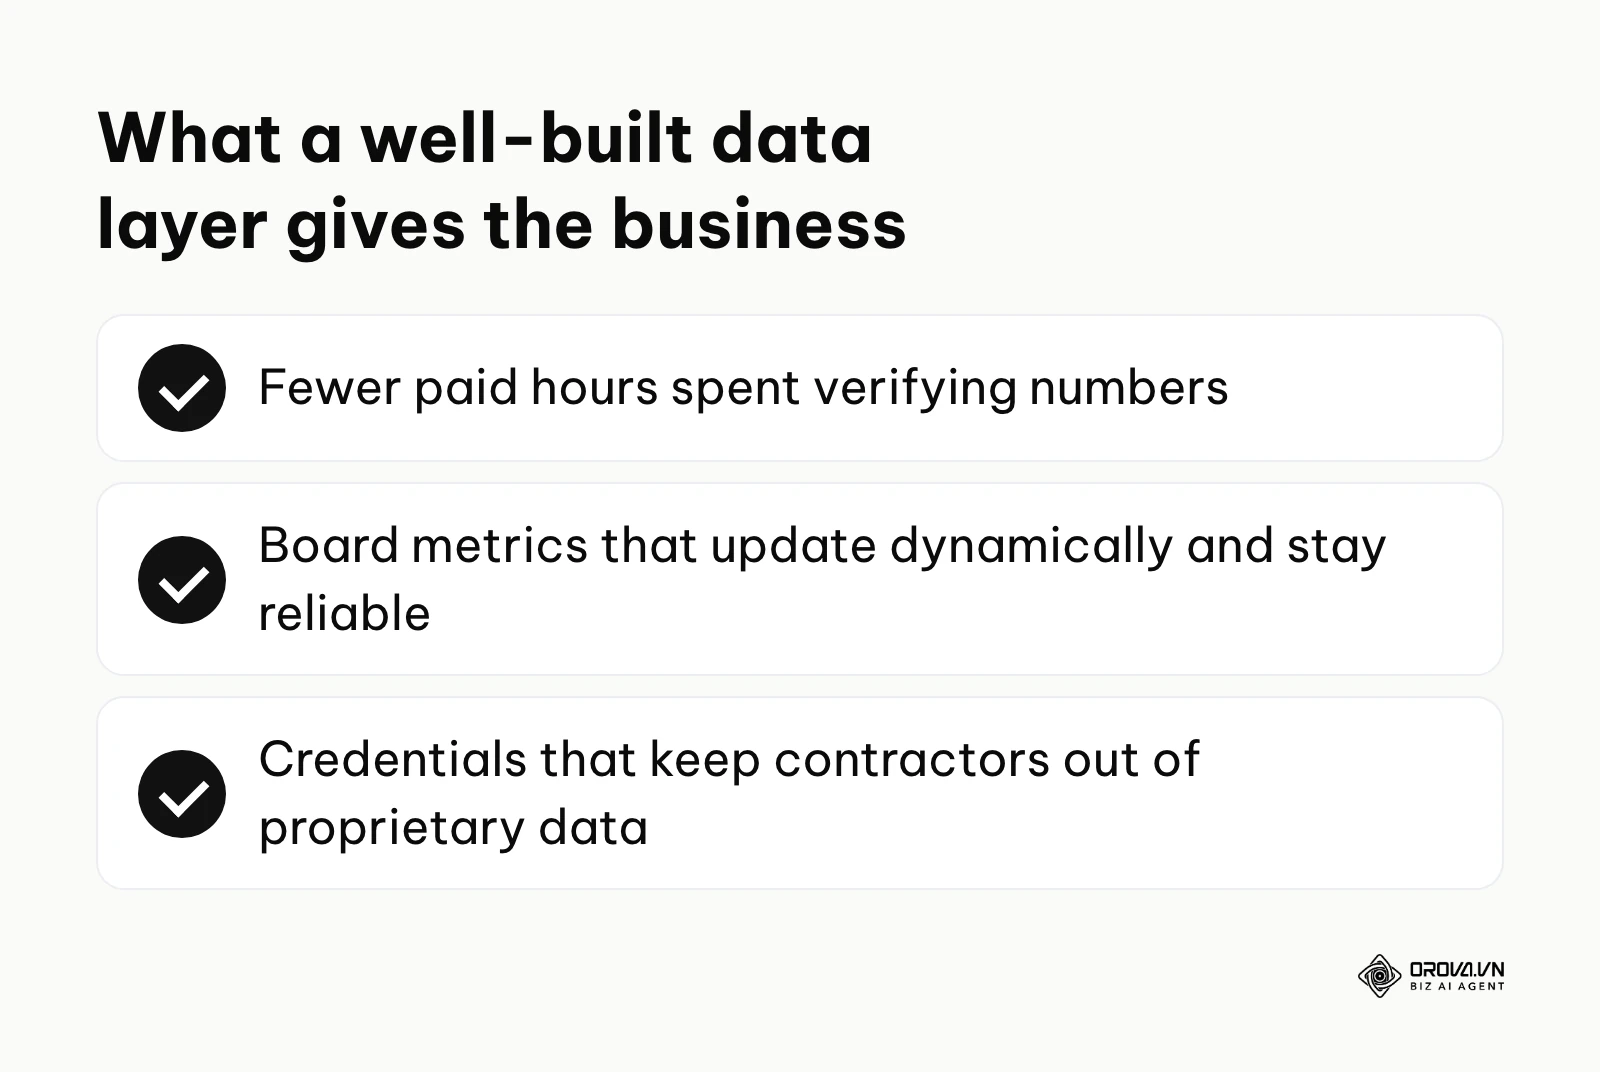
From an executive perspective, an optimized data layer is primarily about cost efficiency and risk mitigation. When data connections are brittle, teams spend countless paid hours verifying numbers rather than acting on them. An optimized connection ensures that the metrics presented in board meetings are dynamically updated and highly reliable. Furthermore, proper data source management enforces strict security protocols. By carefully controlling the credentials at the connection layer, leadership mitigates the risk of external contractors or unauthorized personnel accessing deep, proprietary datasets.
Benefits for the reporting specialist
For the analysts and marketers actually building the dashboards, a clean Looker Studio data setup fundamentally transforms their daily workflow. It provides deep automation, eliminating the dreaded "copy-paste" reporting routines at the end of every month. It also drastically reduces error rates. When schema changes are managed properly, analysts no longer receive frantic emails about charts displaying system errors.
Building a strong data foundation is the first step in any robust marketing reporting strategy, allowing teams to trust the numbers they present.
Turn multi-channel data into instant decisions. OROVA Insight seamlessly connects APIs from Online to Offline, helping you see the full picture of your business through a Real-time chart reporting system.
OROVA Insight: Integrate Online - Offline data, visualize reports in Real-time.
How Looker Studio data architecture actually works
This is the most critical aspect of mastering the platform. The visual interface is easy to learn, but the underlying data architecture requires a deep understanding of APIs, security protocols, and blending mechanics. We will break down exactly how this engine operates beneath the surface.
The connection layer: APIs and connectors
When you look at a bar chart on your screen, the data does not actually live inside the dashboard file. Instead, the platform relies on software intermediaries called connectors. A connector is a highly specific script designed to communicate with an external platform through its API (Application Programming Interface, a software intermediary that allows two applications to talk to each other). When a user opens a dashboard, the connector sends a specific query to the original database, asking for the exact dimensions and metrics required to render the charts on that specific page. The database processes this request and sends the numbers back to the browser.
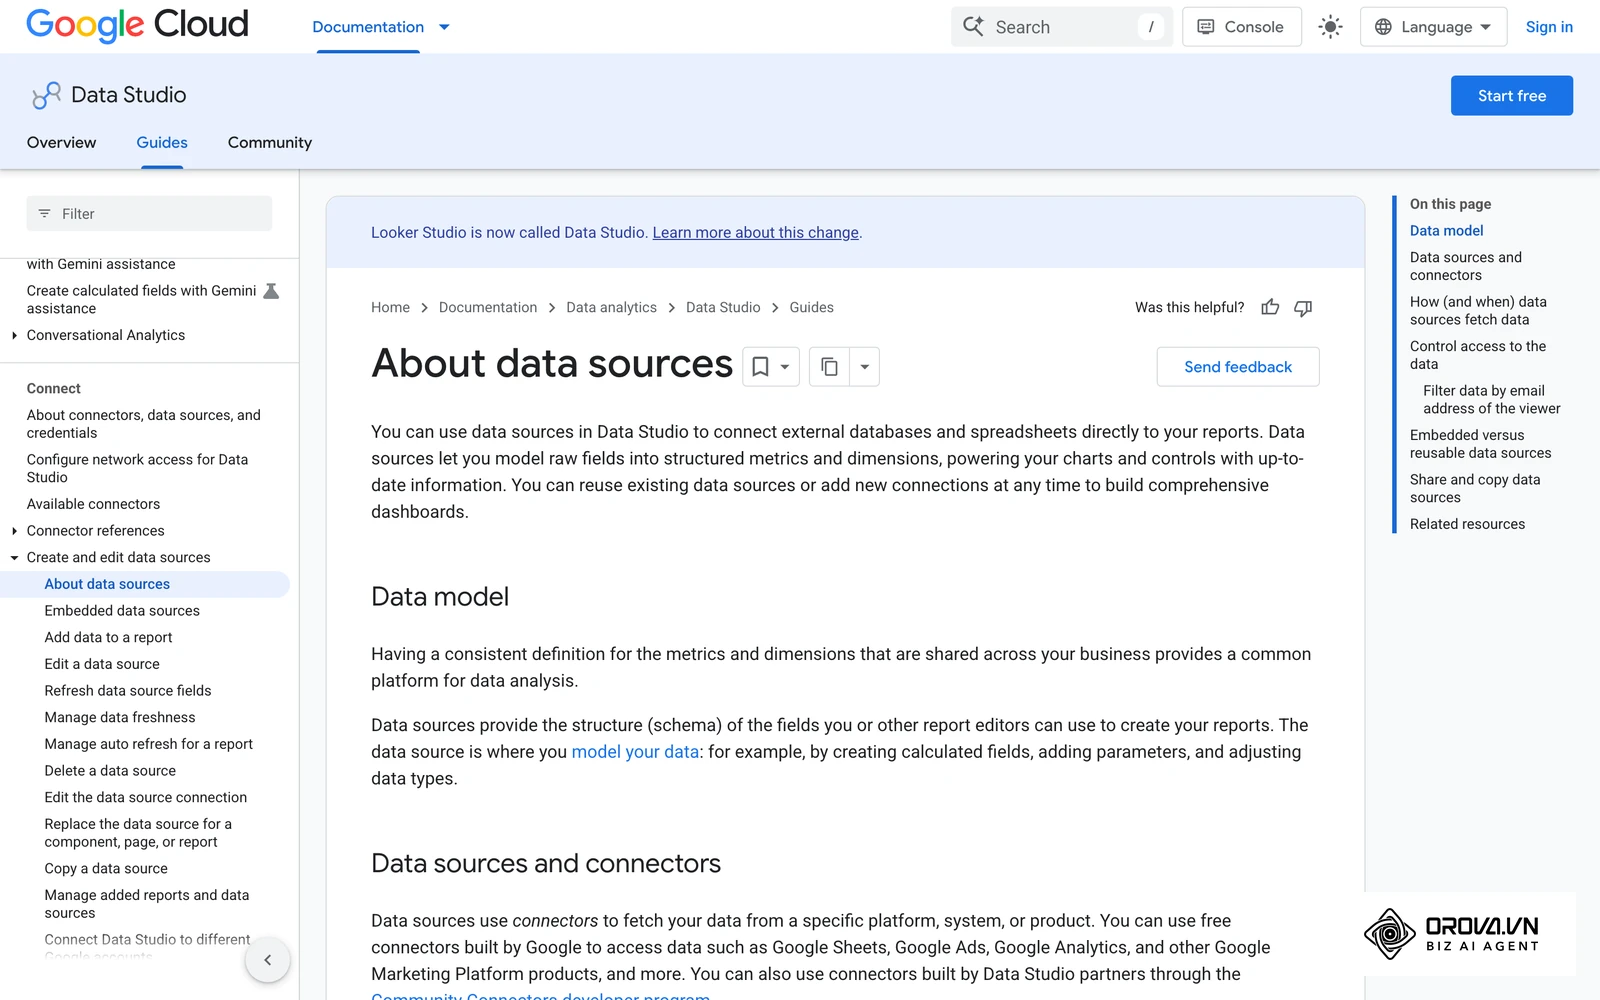
Google provides numerous native connectors for its own ecosystem, such as Google Analytics, Google Sheets, and Google Ads. These native connections are highly optimized and generally stable because they operate entirely within the internal Google Cloud infrastructure. However, for external platforms like TikTok Ads or legacy CRM systems, you must rely on community connectors or third-party paid services.
These external connectors face significant technical challenges. They must navigate complex API rate limits, which strictly restrict how much data can be pulled in a given timeframe. If your dashboard contains twenty complex charts and multiple executives open it simultaneously, the connector might attempt to send hundreds of requests at once. This often exceeds the API limits of the source platform, resulting in broken charts and ugly error messages across the dashboard. Understanding this limitation dictates how you design your reports; you cannot treat a live API connection the same way you treat a static, unmoving spreadsheet.
Embedded vs. reusable data sources
When you create a new data connection, Looker Studio forces you to make an architectural choice that many beginners completely ignore: whether to make the data source embedded or reusable. This seemingly minor choice dictates how easily you can scale your reporting in the future.
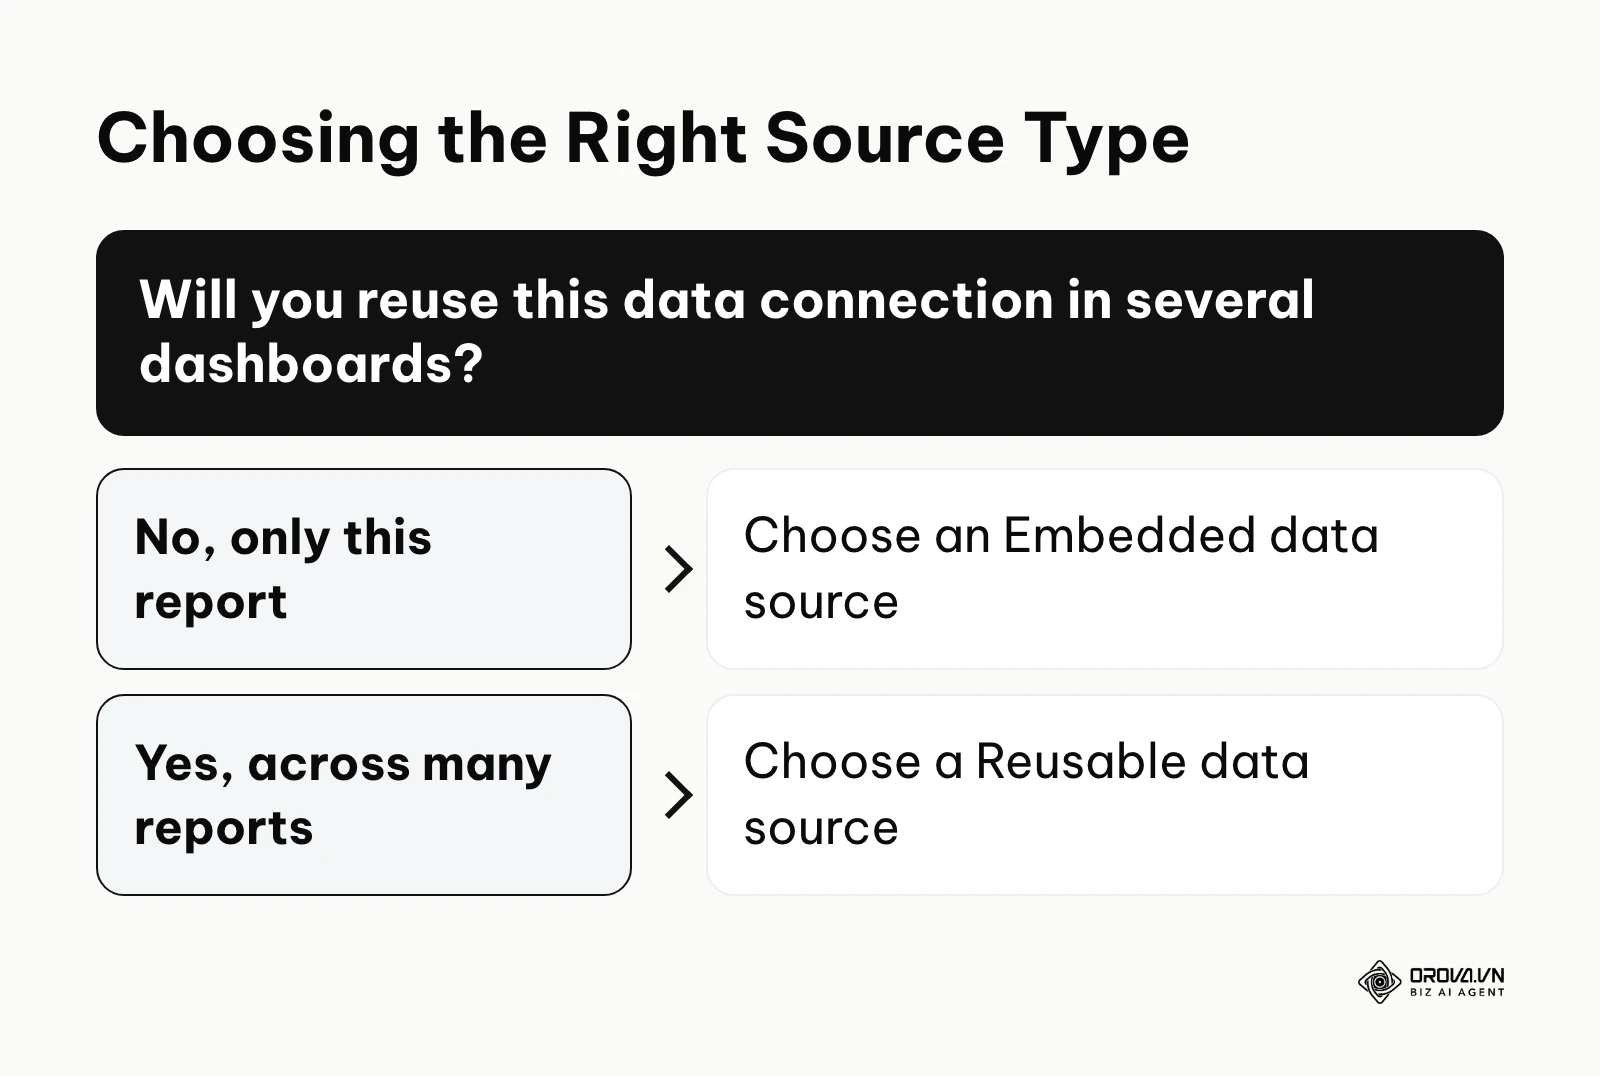
An embedded data source lives exclusively inside the specific report where it was created. If you create a dashboard for the SEO team and embed a Google Search Console connection into it, that connection belongs to that dashboard alone. If you later want to build a separate dashboard for the executive team using that exact same Search Console data, you must build the connection entirely from scratch. Embedded sources are fantastic for quick, one-off investigative reports because they keep your main account environment clean.
A reusable data source, on the other hand, exists as a standalone asset in your Looker Studio home directory. It acts as an independent file. You can connect this single, unified reusable source to ten different dashboards. If you ever need to add a custom calculated field (for example, creating a custom formula to calculate profit margin), you only add it once to the reusable source, and that new metric instantly becomes available across all ten connected dashboards. For serious organizational reporting, reusable sources are mandatory to maintain a single source of truth and avoid redundant maintenance work.
Data credentials: Securing your raw information
One of the most dangerous and frequently misunderstood aspects of Looker Studio data is the credential system. When you connect a database to a dashboard, you must declare whose "keys" are used to unlock that data for the people viewing the final report. You have two distinct options, and choosing the wrong one can lead to massive data leaks.
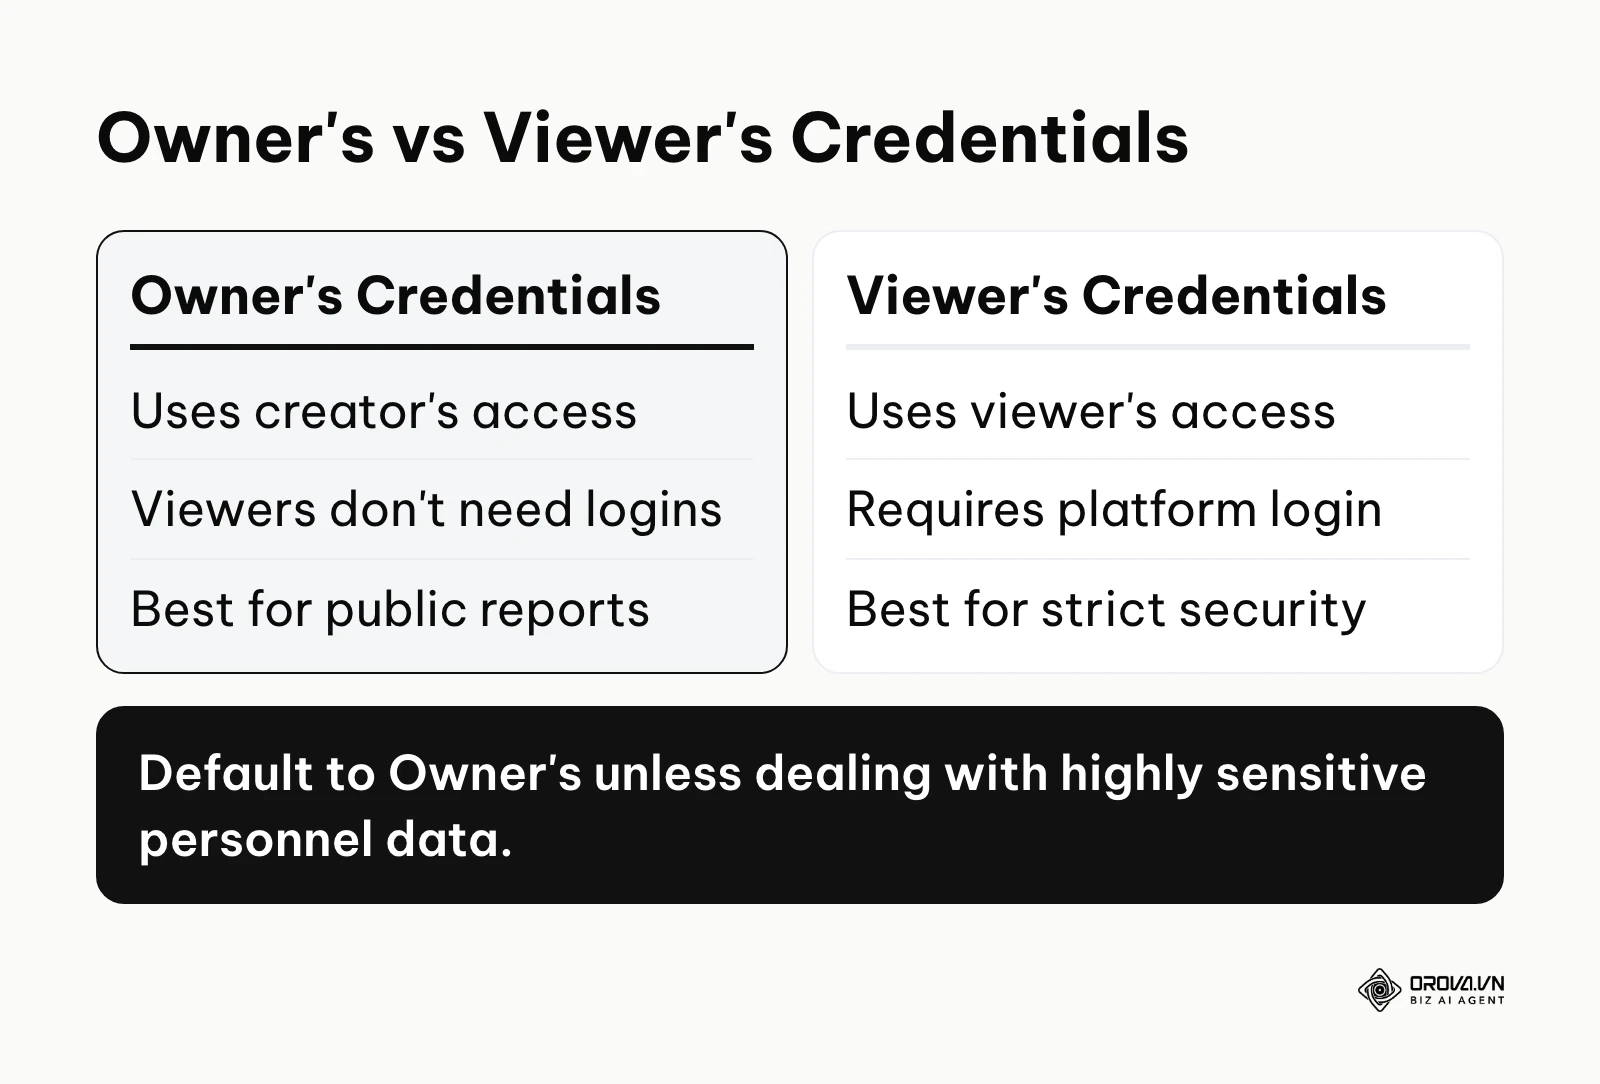
The first option is Owner's Credentials. Under this setting, Looker Studio uses the access rights of the person who originally built the data source. If you have admin access to a secure financial database and you use Owner's credentials, anyone you share the report with can see the charts, regardless of whether they have a login to the actual financial database. This is incredibly useful for sharing high-level marketing reports with external clients who shouldn't be forced to create new accounts just to view a chart.
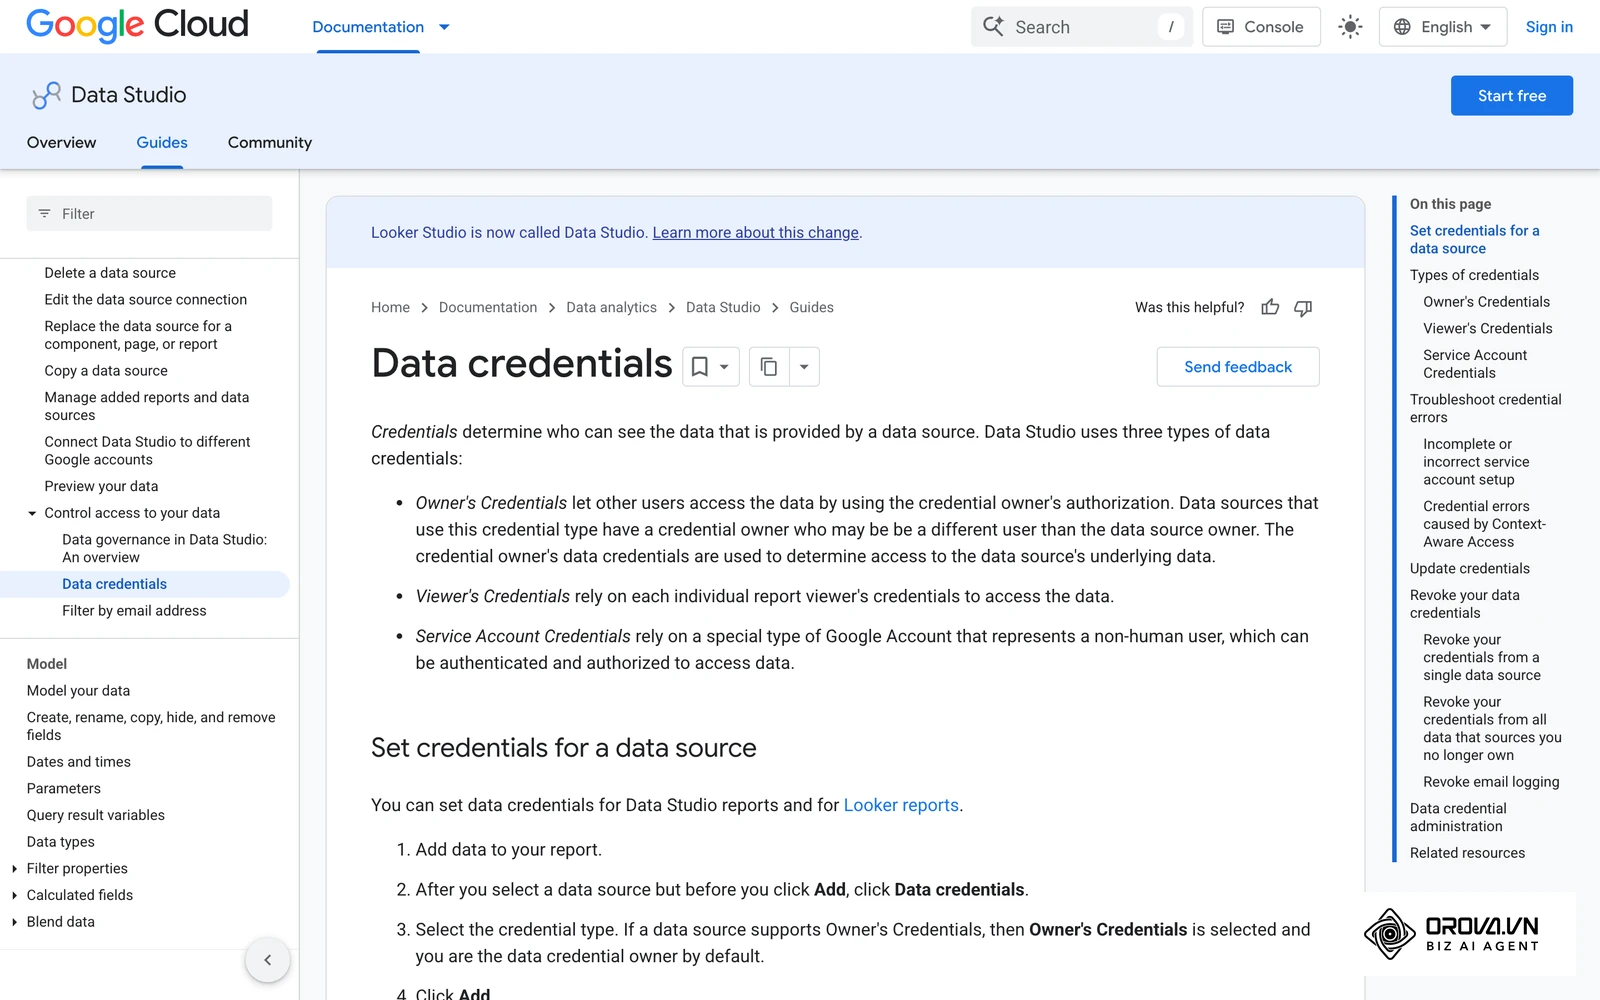
The second option is Viewer's Credentials. Under this strict setting, the dashboard essentially acts as an empty shell. When a person opens the dashboard link, the system demands that they log in using their own personal Google account to verify their access rights to the underlying platform. If they do not have explicit permission granted in the original database, the charts will refuse to load and will display an access error. Data governance practice generally favors role-based access control at the data source level, and Viewer's Credentials enforce this principle, ensuring highly sensitive personnel or financial records remain locked down, even if the dashboard URL is accidentally leaked to the entire company.
Data blending: Merging diverse datasets
Data blending is the powerful feature that elevates Looker Studio from a simple charting tool into a highly capable analytical platform. Blending allows you to take data from completely different platforms and merge them into a single, cohesive table or chart, provided they share at least one common element.
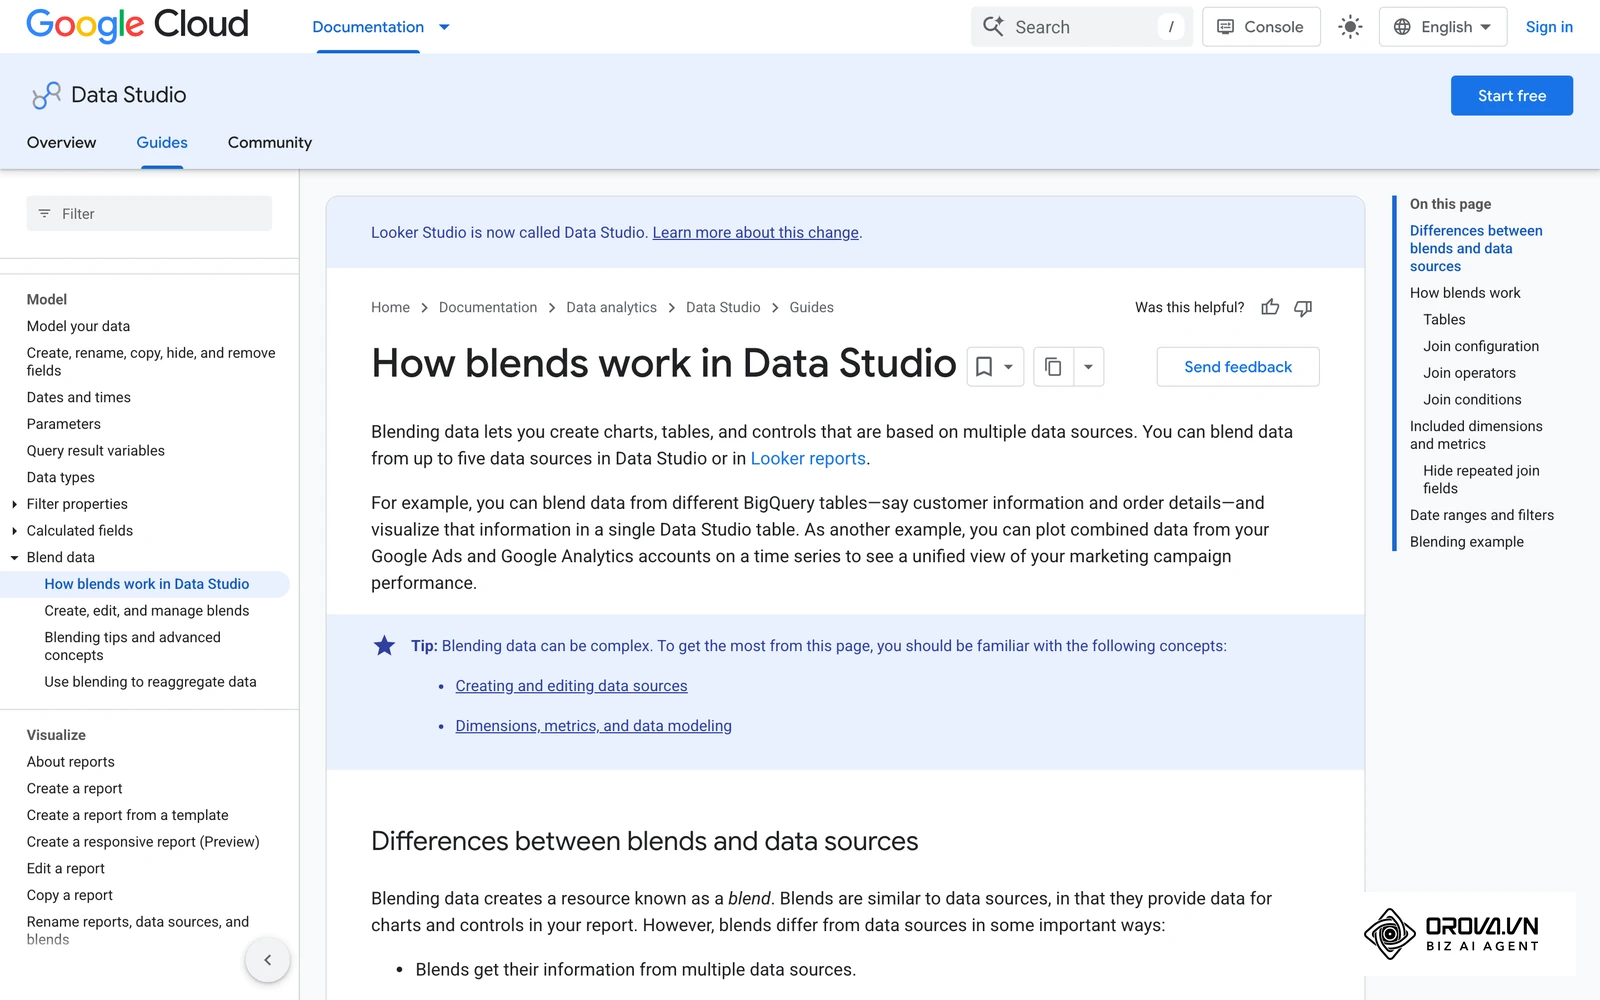
By default, a blend performs what is known in database management as a 'Left Outer Join': it takes all the rows from your primary (left) data source and attaches matching information from your secondary (right) data source. You can switch the join type to inner, right outer, full outer or cross join when your analysis needs it. To make this attachment, you must define a Join Key—a dimension that exists identically in both datasets. Most commonly, this join key is the 'Date' dimension. If both Google Analytics and Meta Ads have a 'Date' field, you can blend them to see your Meta Ad Spend right next to your Google Analytics Conversions on the exact same row for a specific day.
Illustrative example: An in-house marketing manager at a mid-sized e-commerce company needed to track true return on ad spend across multiple platforms on a daily basis. First, they connected Google Analytics 4 to retrieve conversion revenue data, and Facebook Ads to retrieve daily ad spend data. Second, they created a blend in the dashboard using the 'Date' field as the primary join key. They encountered a massive discrepancy because Facebook reported dates in a different timezone format than GA4, causing the join to fail entirely and displaying null values. They fixed this by adding a calculated field in the Facebook data source to explicitly parse and align the date format before initiating the blend. The resulting unified dashboard displayed exact daily profit margins side-by-side, allowing the team to see immediate campaign performance without downloading and aligning separate spreadsheets manually.
This capability allows you to create far more complex data visualization options than standard single-source reporting allows, giving executives a holistic view of the business.
Speed optimization: Extract data versus live connection
The most common complaint regarding Looker Studio data is performance speed. When a dashboard contains multiple pages, complex blended sources, and a long date range, it can take minutes to load. This happens because standard connections are 'live'. Every time you adjust a filter, the platform fires dozens of heavy API requests back to the source database, waiting for it to calculate and return the new numbers.
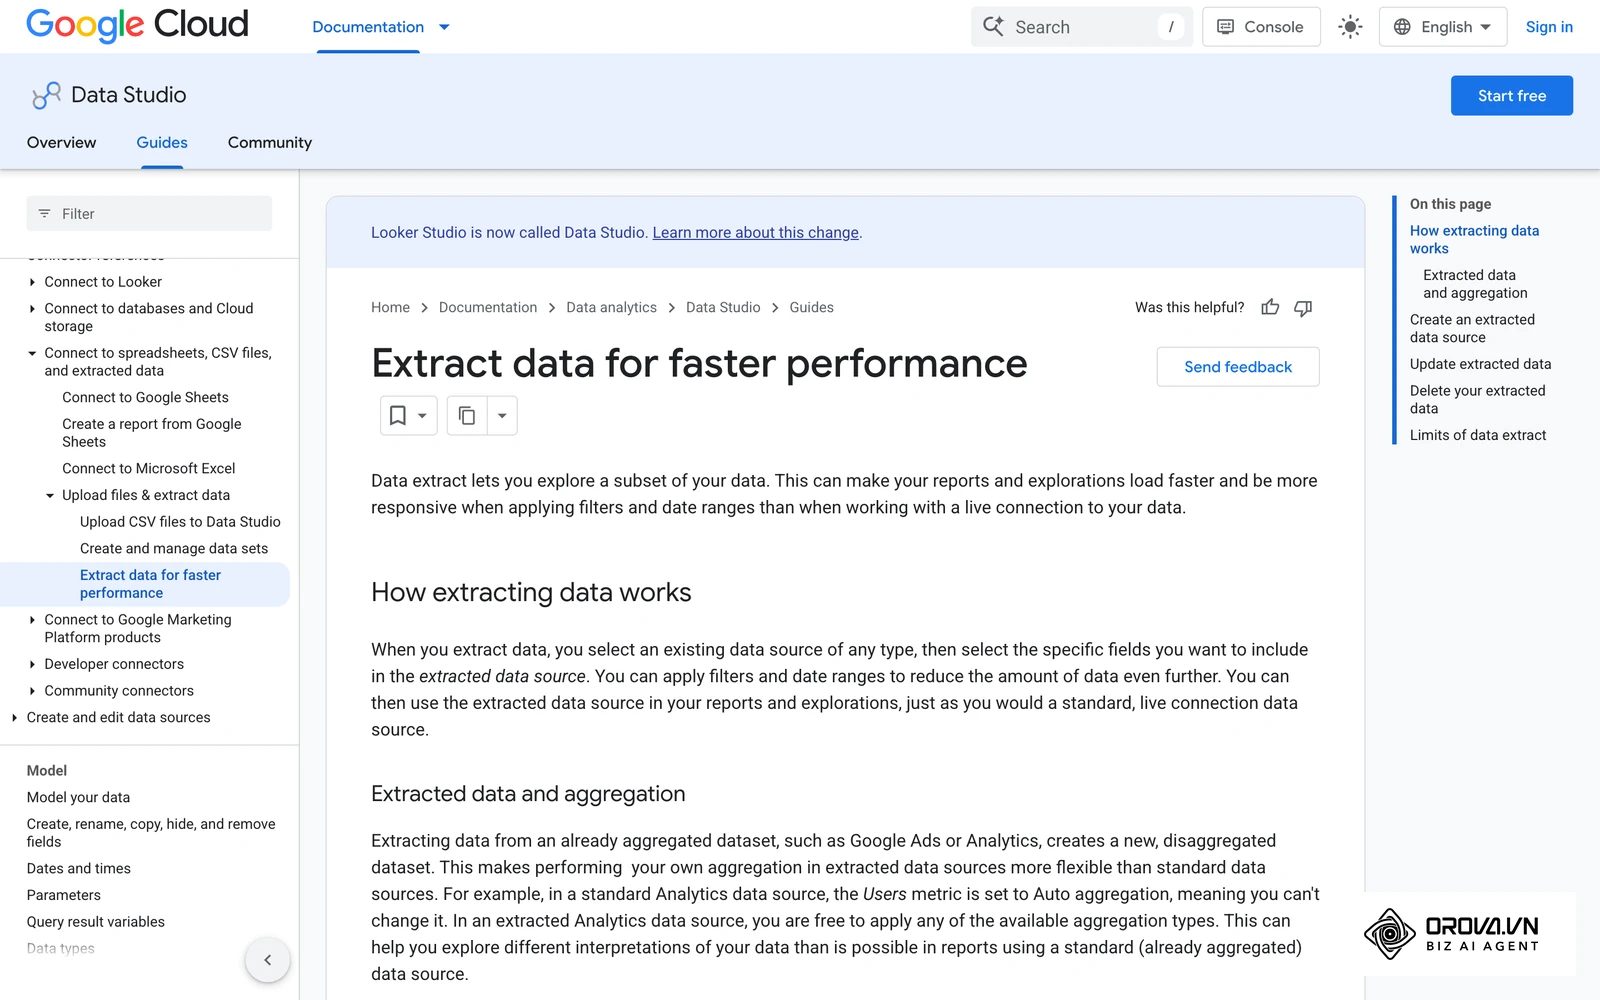
To solve this, Google provides a highly specialized native connector called Extract Data. Instead of querying the live database every single time a user clicks something, the Extract Data connector takes a snapshot of your specified metrics and dimensions and stores them inside Looker Studio. You can schedule this extract to automatically update daily, weekly, or monthly. Because the dashboard now reads from a small, prepared snapshot rather than sending API requests across the internet, charts usually render much faster. The trade-off is freshness: an extract only changes when its scheduled update runs.
Illustrative example: An agency reporting lead handling fifty distinct client accounts struggled with dashboards taking three minutes to load during live client presentation meetings. They first identified the heaviest report page, which contained many complex time-series charts pulling from a live MySQL database. Next, they replaced the live database connector with the native Extract Data connector. They initially tripped up by forgetting to include the 'Campaign Name' dimension in the strict extract schema, which instantly broke all campaign-level dropdown filters on the dashboard. They edited the extract configuration to add the missing dimension and forcefully refreshed the schema. Client dashboards subsequently loaded in a few seconds, allowing account managers to click through filter tabs instantly while presenting on video calls.
Data freshness: Why your report shows old numbers
When a report does not show today's figures, the connection is usually working; the numbers are simply coming from memory. To speed up reports and reduce quota hits, Looker Studio temporarily stores the queries a report runs and their results. Until the data source's freshness threshold expires, a repeated query is answered from that memory instead of the original platform. A new query, such as a different filter or date range, still goes to the source.
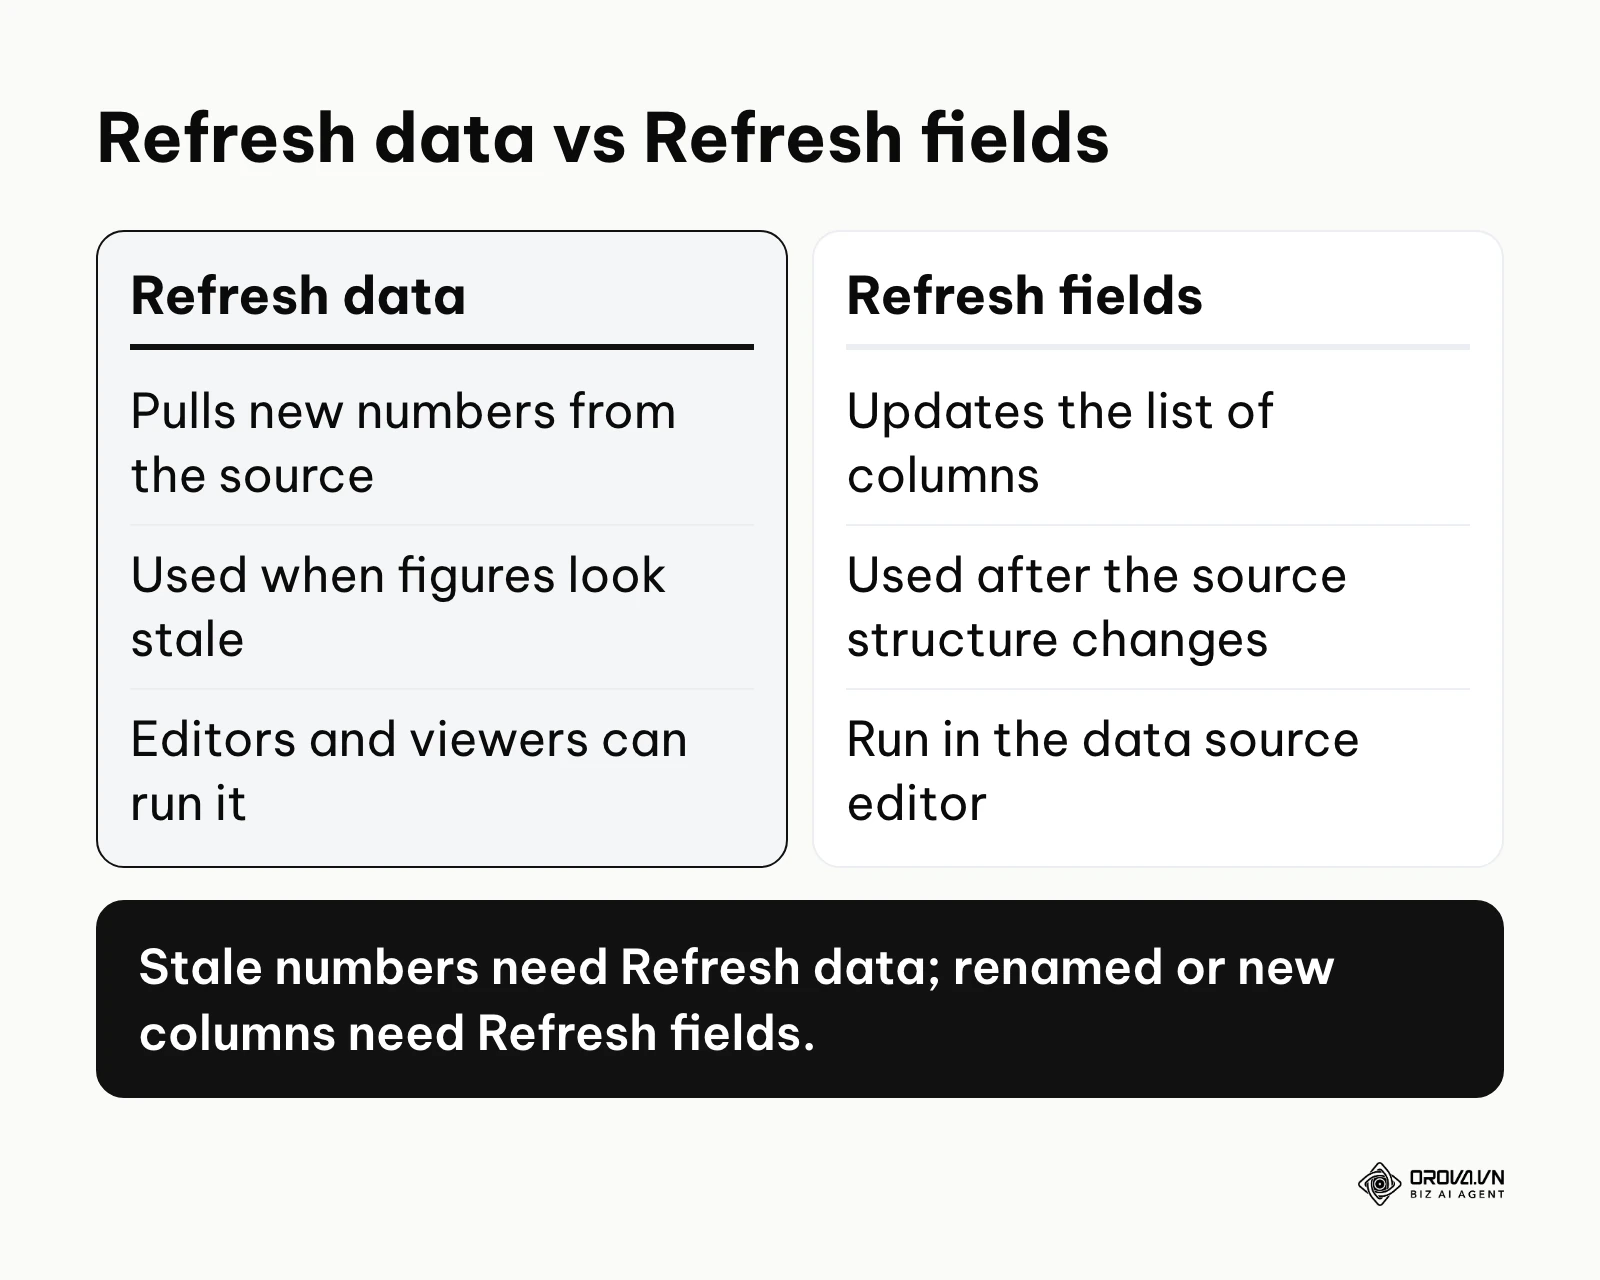
Each data source has its own Data freshness setting in the data source editor, and the options depend on the connector:
| Connector | Freshness options | Default |
|---|---|---|
| Google Sheets | Every 15 minutes, 1 hour, 4 hours or 12 hours | Every 15 minutes |
| Google Analytics | Every 1 hour, 4 hours or 12 hours | Every 12 hours |
| BigQuery, MySQL, PostgreSQL | Every 1 to 50 minutes, or every 1 to 12 hours | Every 12 hours |
| Google Ads, Search Console and other Google ad products | Fixed | Every 12 hours |
| Community and partner connectors | Varies by connector | Varies |
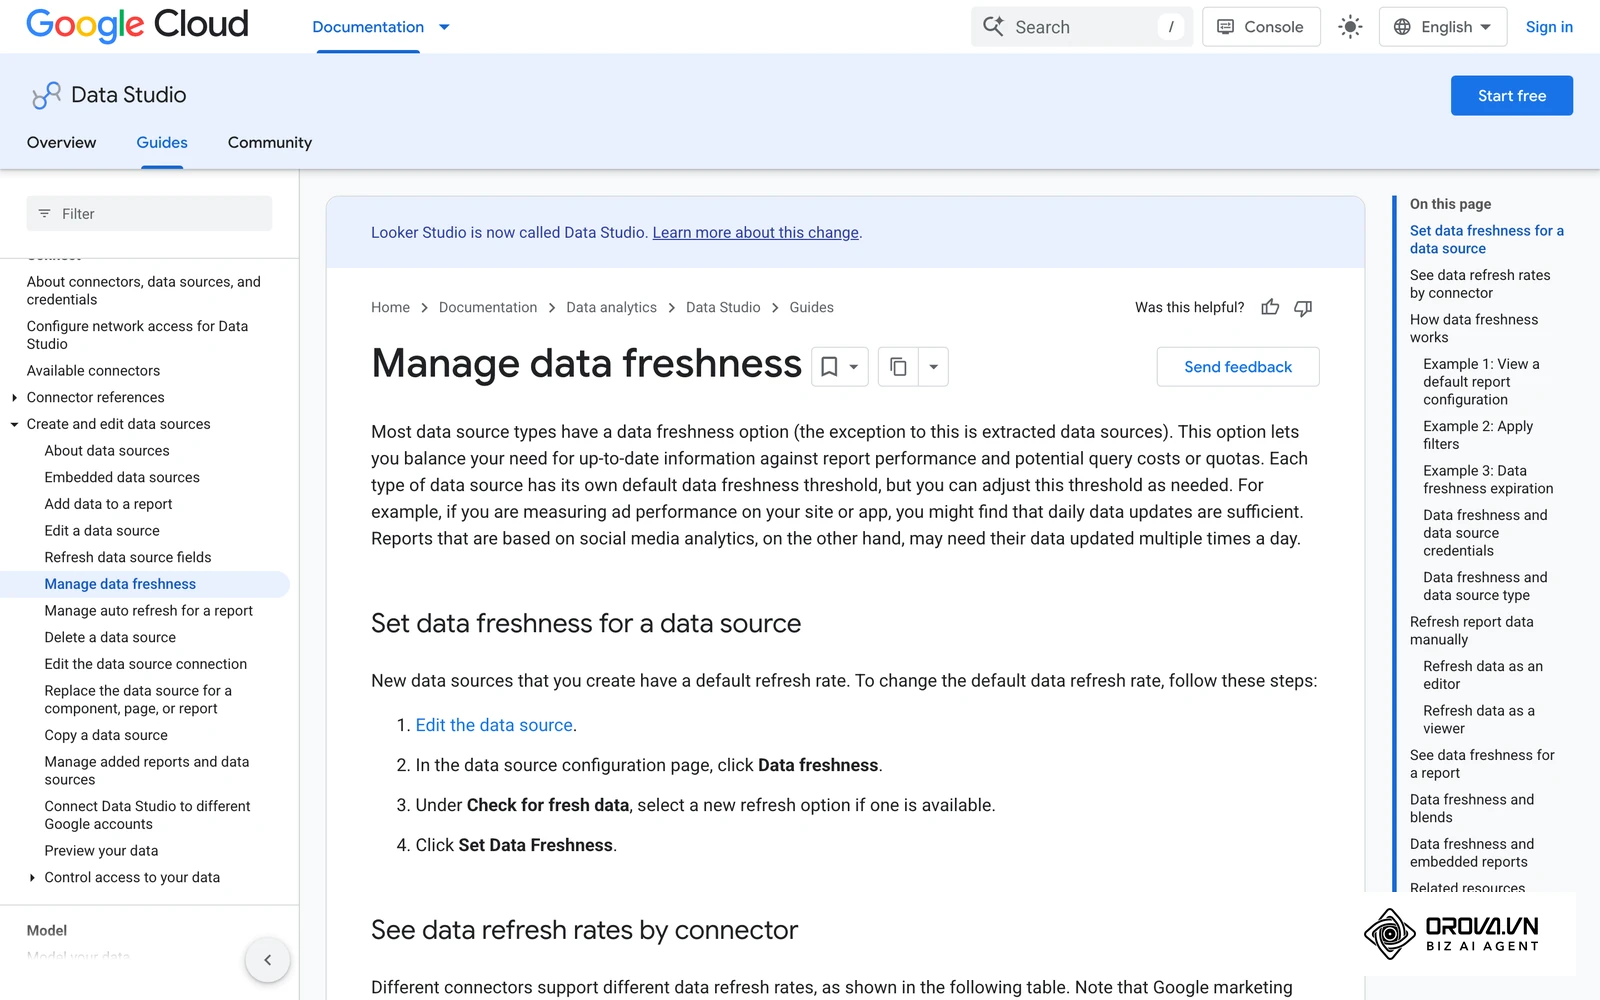
Report editors and viewers can also refresh the data manually from the report menu. Keep two commands apart: Refresh data pulls new numbers from the source, while Refresh fields in the data source editor updates the list of columns after the source structure changes. Also remember that a platform can lag behind on its own side; for example, Google Analytics may take a while to finish processing recent data, so the latest hours can look low even after a refresh.
Troubleshooting: Fixing configuration errors
Even with perfect architecture, Looker Studio data connections will eventually break. The most notorious issue is the dreaded 'Data Set Configuration Error'. This red warning box appears when the Looker Studio schema no longer matches the actual structure of the underlying database.
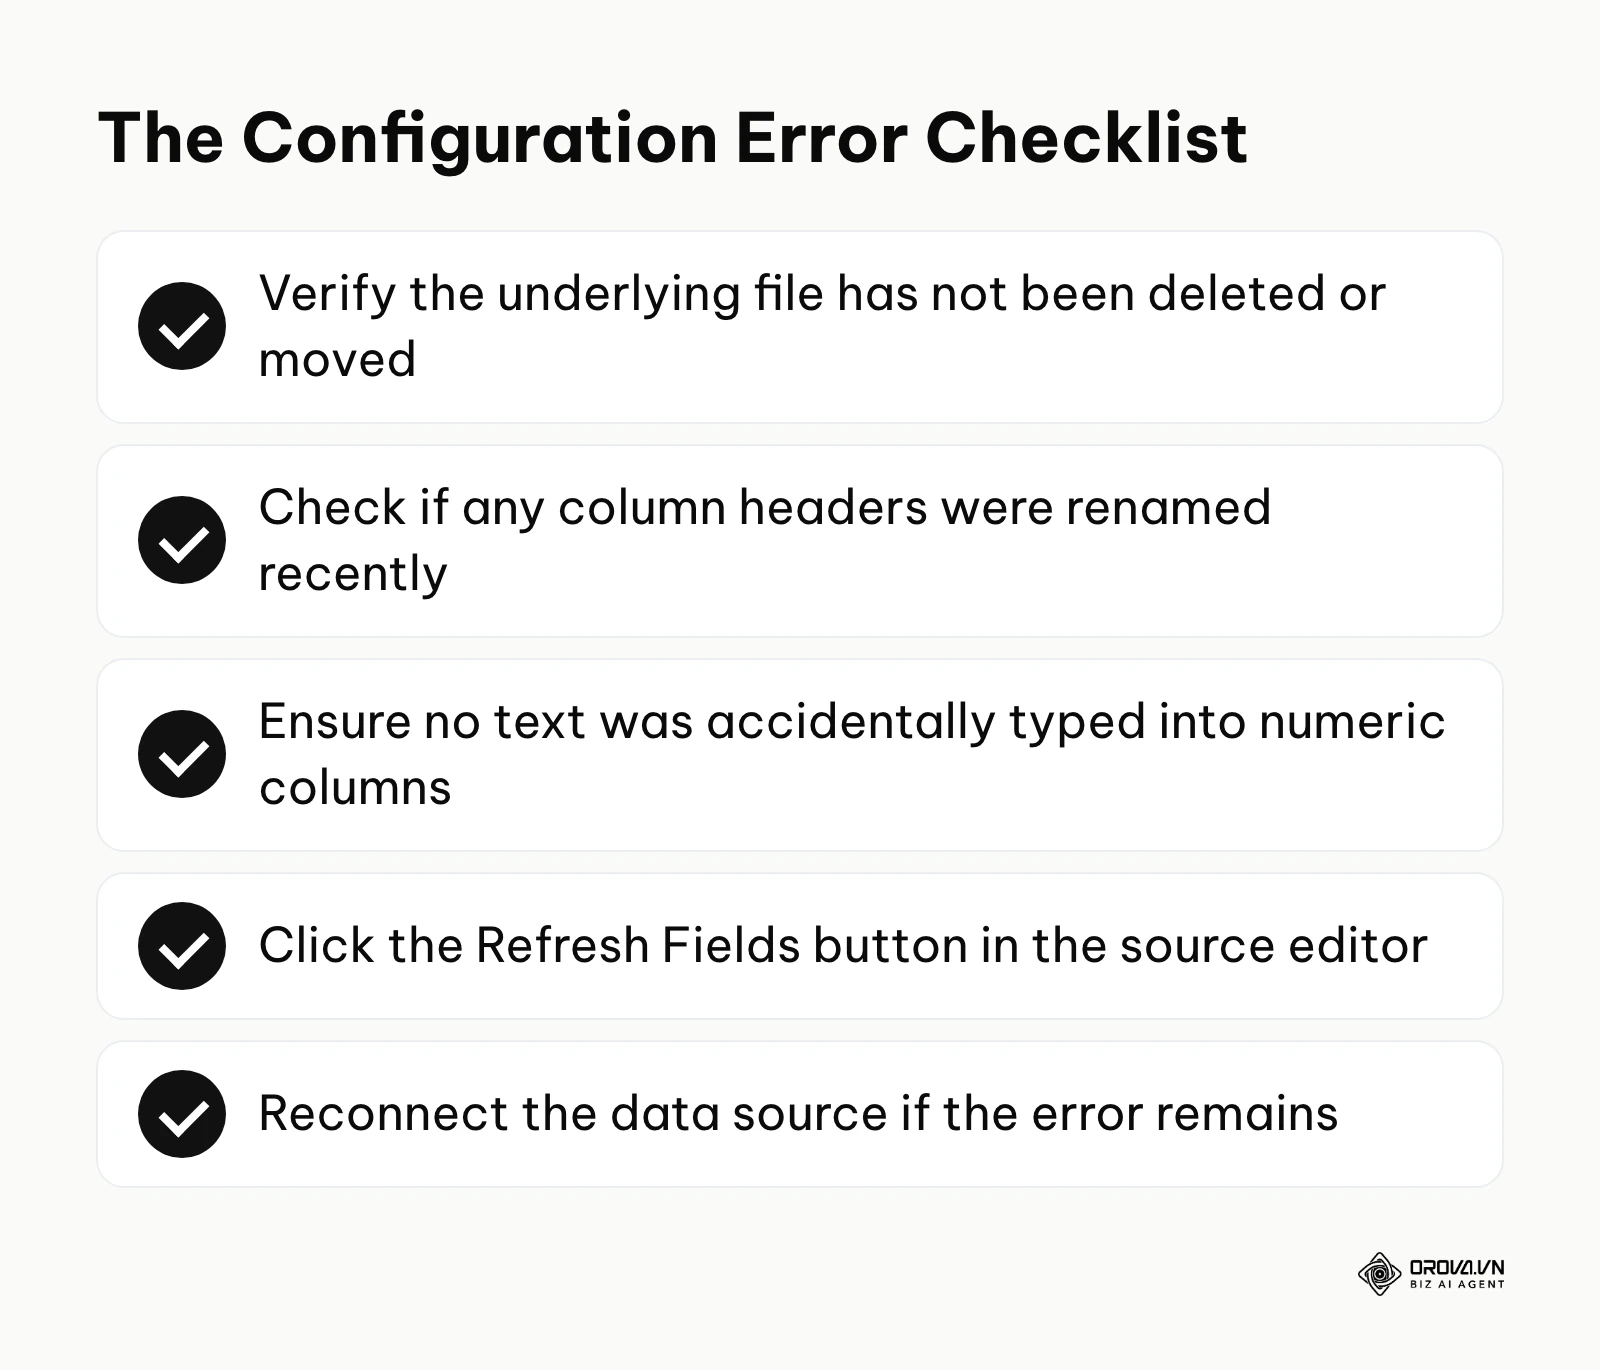
This usually happens when someone modifies the source without realizing the downstream impact. If you connect a Google Sheet, and a colleague changes the column header from 'Revenue' to 'Total Revenue', Looker Studio immediately panics. It looks for the old column name, cannot find it, and breaks every chart relying on that field. The solution is entirely dependent on the 'Refresh Fields' mechanism located in the data source editor. This button forces Looker Studio to re-scan the underlying database, identify new columns, and flag missing ones, allowing you to update your charts accordingly.
Illustrative example: A data operations specialist at a retail startup faced a sudden Data Set Configuration Error across all inventory reports on a Monday morning. First, they opened the underlying Google Sheet and noticed a colleague had innocently renamed the 'Item_Stock' column to 'Current_Inventory'. Second, they opened the data source editor in the visualization platform to investigate the damage. The immediate hurdle was that clicking the 'Reconnect' button threw an ambiguous error message because the data type had also shifted from numeric to text in the source document due to a stray comma. They resolved this by explicitly casting the new column back to a numeric type in the spreadsheet, then clicking the 'Refresh Fields' button in the Looker Studio data source interface to apply the schema change. The red error boxes disappeared immediately, and the inventory charts rendered correctly with the updated column logic.
No more lag in data management. Unlock the power of the OROVA Insight system to sync O2O (Online-to-Offline) data flows and visualize every report in real time.
OROVA Insight: Integrate Online - Offline data, visualize reports in Real-time.
How to start managing data connections effectively
Adapting to proper data management requires different approaches depending on your specific organizational role. Implementing these steps helps you transition into a proper data driven marketing framework.
For small business owners
If you run a small business, your goal should be simplicity and stability rather than complex architecture.
- Focus exclusively on connecting free, native Google tools first (GA4, Google Ads, Search Console) before attempting to integrate external CRMs.
- Use embedded data sources to keep your workspace uncluttered, as you likely only need one master executive dashboard.
- Audit your sharing permissions. Ensure you are using Owner's Credentials so your staff can view the dashboard without needing direct access to your analytics accounts.
- Avoid purchasing expensive third-party connectors until your revenue explicitly justifies the cost of automating those specific metrics.
For in-house analytics teams
In-house analysts must prioritize scalability, as they serve multiple departments with varying data requests.
- Establish a strict naming convention for all data sources (e.g., "[Department] - [Platform] - [Date Connected]") to prevent workspace chaos.
- Mandate the use of reusable data sources for any core company metrics to ensure everyone operates from a single source of truth.
- Proactively implement the Extract Data connector for high-traffic executive dashboards to guarantee instant load times during crucial meetings.
- Create a standardized company 'Date' dimension format in all databases to ensure seamless data blending across departments.
For agency reporting specialists
Agencies face the highest risk, as they manage dozens of disparate client environments simultaneously.
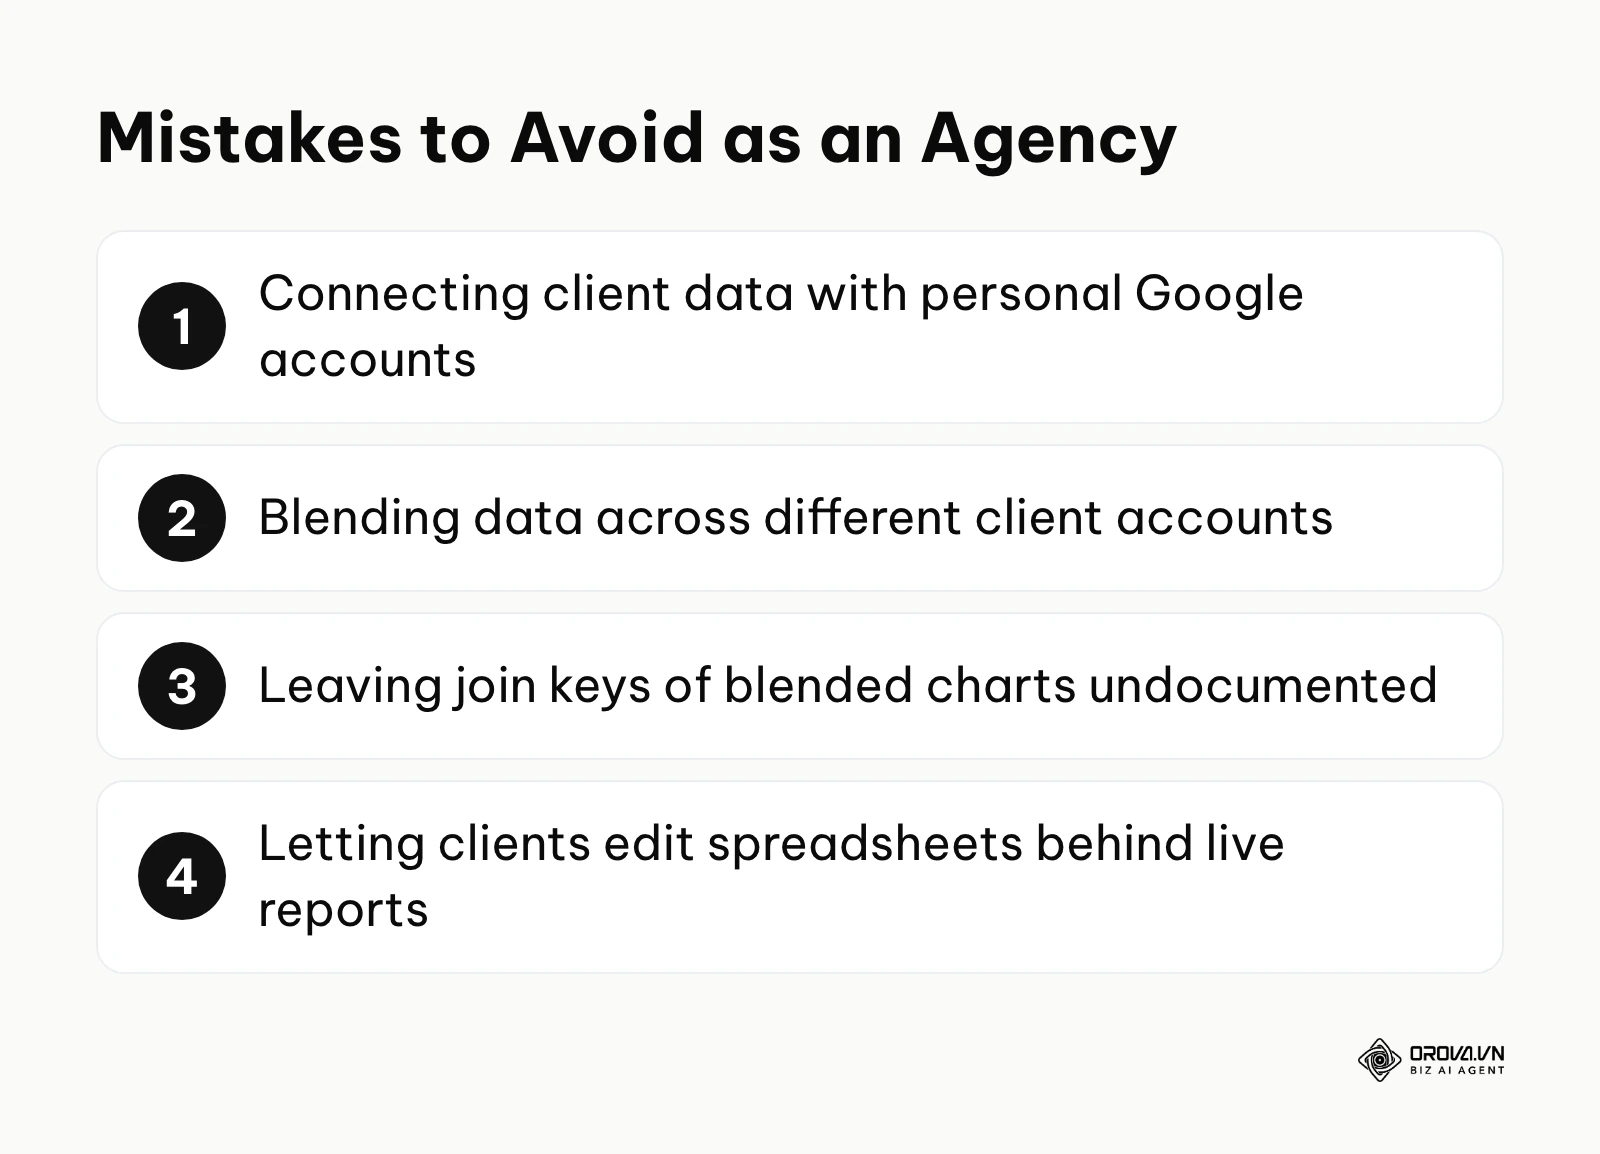
- Never use personal Google accounts to establish data connections; use a shared agency-owned account (or a service account where the connector supports it, such as BigQuery) to ensure continuity if an employee leaves.
- Aggressively isolate client data sources. Never blend data across different client accounts, even for internal benchmarks, to prevent accidental data leakage.
- Document exact join keys used for every blended chart in a central agency wiki, as troubleshooting complex client blends is notoriously difficult.
- Educate clients on why they should not edit the underlying spreadsheets attached to active Looker Studio reports.
| Common mistakes | Consequence | Prevention |
|---|---|---|
| Using Viewer's credentials for client-facing reports | Clients without access to the source platform see permission errors instead of charts. | Use Owner's credentials and share the report only with named people. |
| Leaving broken fields in the schema | The entire dashboard fails to load due to severe configuration errors. | Remove or update missing fields using the Refresh Fields button immediately. |
| Blending data without a date key | Massive duplication of rows and highly inflated, inaccurate metrics. | Always include a standardized date dimension as the primary join condition. |
Looker Studio data trends in the coming years: The author's perspective
As data environments become increasingly complex, the way we connect and manage information is shifting rapidly. Based on the current trajectory of business intelligence, I foresee three major changes over the next few years.
The rise of the universal semantic layer
As of 2026, we are seeing a massive fragmentation of metric definitions across different platforms, leading to constant discrepancies and arguments over whose numbers are correct. I believe that over the next few years, more of the industry will move toward universal semantic layers that sit firmly above the raw data connectors. This means reporting platforms will primarily connect to pre-modeled semantic hubs rather than raw platform APIs, because organizations can no longer afford to rebuild metric logic inside every individual dashboard. You should prepare for this shift right now by standardizing your metric definitions in a central company document before you build any more complex calculations directly inside your visual interface. This trend might be slower if small businesses continue to resist paying for middleware solutions, and larger companies will likely adopt it first.
Automated AI-driven data blending
The current landscape requires analysts to manually configure join keys, match data types, and aggressively troubleshoot null values when blending sources. I expect AI to take over much of the data blending work, suggesting join keys and flagging date formatting mismatches between platforms. AI could analyze the schema of two sources and propose a safe join condition, drastically reducing the time spent debugging broken blends. To prepare for this, you should ensure that your underlying data sources have extremely clear, descriptive column headers, as AI algorithms will rely heavily on text context to make accurate joining decisions. However, this prediction heavily assumes AI hallucination rates in strict mathematical modeling drop significantly.
The shift away from free native connectors
Platform APIs already enforce quotas, and heavy reports regularly run into rate-limit errors. I suspect that relying purely on free, direct API connections for high-volume reporting will keep getting harder. More teams may end up adding a data warehouse such as BigQuery as an intermediate step, because the server cost of maintaining high-frequency API calls is too high for platforms to subsidize indefinitely. You must prepare by auditing your current data refresh frequencies and determining which reports actually need live data versus which can survive on daily batched extracts. If cloud storage costs plummet further, this transition to full warehousing will happen even faster.
Frequently asked questions about Looker Studio data
Is Looker Studio data still needed with AI tools?
Yes, absolutely. While AI tools are excellent at analyzing trends and generating text summaries, they still require a structured, reliable feed of information to function without hallucinating. Looker Studio data acts as the rigorously defined pipeline that feeds clean, formatted metrics into those AI systems, ensuring the underlying numbers are accurate before analysis begins.
Why is my dashboard loading so slowly?
Slow load times are often caused by live API connections hitting rate limits, or by extremely complex data blending calculations occurring in real-time. If your dashboard contains many charts and uses live connectors, the platform struggles to process the requests simultaneously. You can often fix this by switching your data source to use the Extract Data connector.
How do I protect underlying data from clients?
To protect raw, underlying records from clients viewing the report, use Owner's Credentials in your data source configuration and give clients view access only, never edit access. This allows the client to view the aggregated charts you built without ever granting them the necessary platform permissions to click through and view the deep, unaggregated rows of raw data.
When should I pay for third-party connectors?
You should invest in paid third-party connectors only when you need to pull data from external platforms (like Meta Ads or legacy CRMs) that do not have free native Google integrations, and when the manual effort of downloading and formatting CSV files exceeds the monthly cost of the connector subscription.
How do I resolve a configuration error?
A Data Set Configuration Error occurs when the structure of your underlying database changes. To fix it, open the Looker Studio data source editor and click the Refresh Fields button. This forces the system to recognize new columns or flag deleted ones, allowing you to repair the broken charts manually.
Where should you start right now?
Implementing a robust data architecture can feel overwhelming. Depending on your current situation, you should focus on a single, actionable step that will immediately improve your reporting workflow.
If you have absolutely nothing set up, do not attempt to build a complex blended dashboard. Your single step for this afternoon is to connect one native, free source—like Google Analytics 4—using an embedded data source. Build a simple dashboard with three basic charts (sessions, users, and conversions). This will familiarize you with the authentication process and the basic schema interface without the stress of managing API limits.
If you already have multiple, fragmented sources scattered across different reports, your immediate step is to audit your credentials. Open your most important dashboards, navigate to the data source editor, and verify whether you are using Owner's or Viewer's credentials. Correcting misconfigured credentials today will prevent potential data leaks and ensure your team can actually view the reports you send them tomorrow.
If your sources are fully connected but performance is terrible, your immediate step is to implement data extraction. Identify the single slowest dashboard in your company. Replace its live database connection with the native Extract Data connector, selecting only the specific dimensions and metrics required for that specific page. Schedule it to update daily, before your team starts work. In most cases load times drop noticeably, proving the value of optimized Looker Studio data management to your entire team.
About the author

Builder of Orova
Nguyễn Đỗ Trọng Ân has 8 years of experience in marketing, including 6 years managing market development across Asia. He builds Orova, a Biz AI Agent that never sleeps: it plans, runs and optimizes work for businesses.
Run your business with AI Agents
Orova is the always-on Biz AI Agent — it plans, runs, and optimizes the work for you.
Save time, unlock productivity.