
What is a break even ROAS calculator? A guide to real ad profit

Running digital ad campaigns without knowing your exact profit margins is like driving a race car blindfolded. You might feel the speed of revenue coming in, but you have no idea when you will crash into a cash flow deficit. Countless e-commerce founders scale their ad accounts rapidly, only to discover at the end of the month that their bank balance has somehow shrunk. To fix this, you must stop relying on default platform metrics and build a custom break even roas calculator.
This specific calculation changes the entire dynamic of media buying. It forces you to look past top-line sales and focus entirely on the actual dollars remaining after every hidden fee is paid. This guide will dismantle the old way of running ads, introduce a dynamic matrix for multi-SKU stores, and provide a clear framework to ensure you never scale a losing campaign again.
What is a break even ROAS calculator?
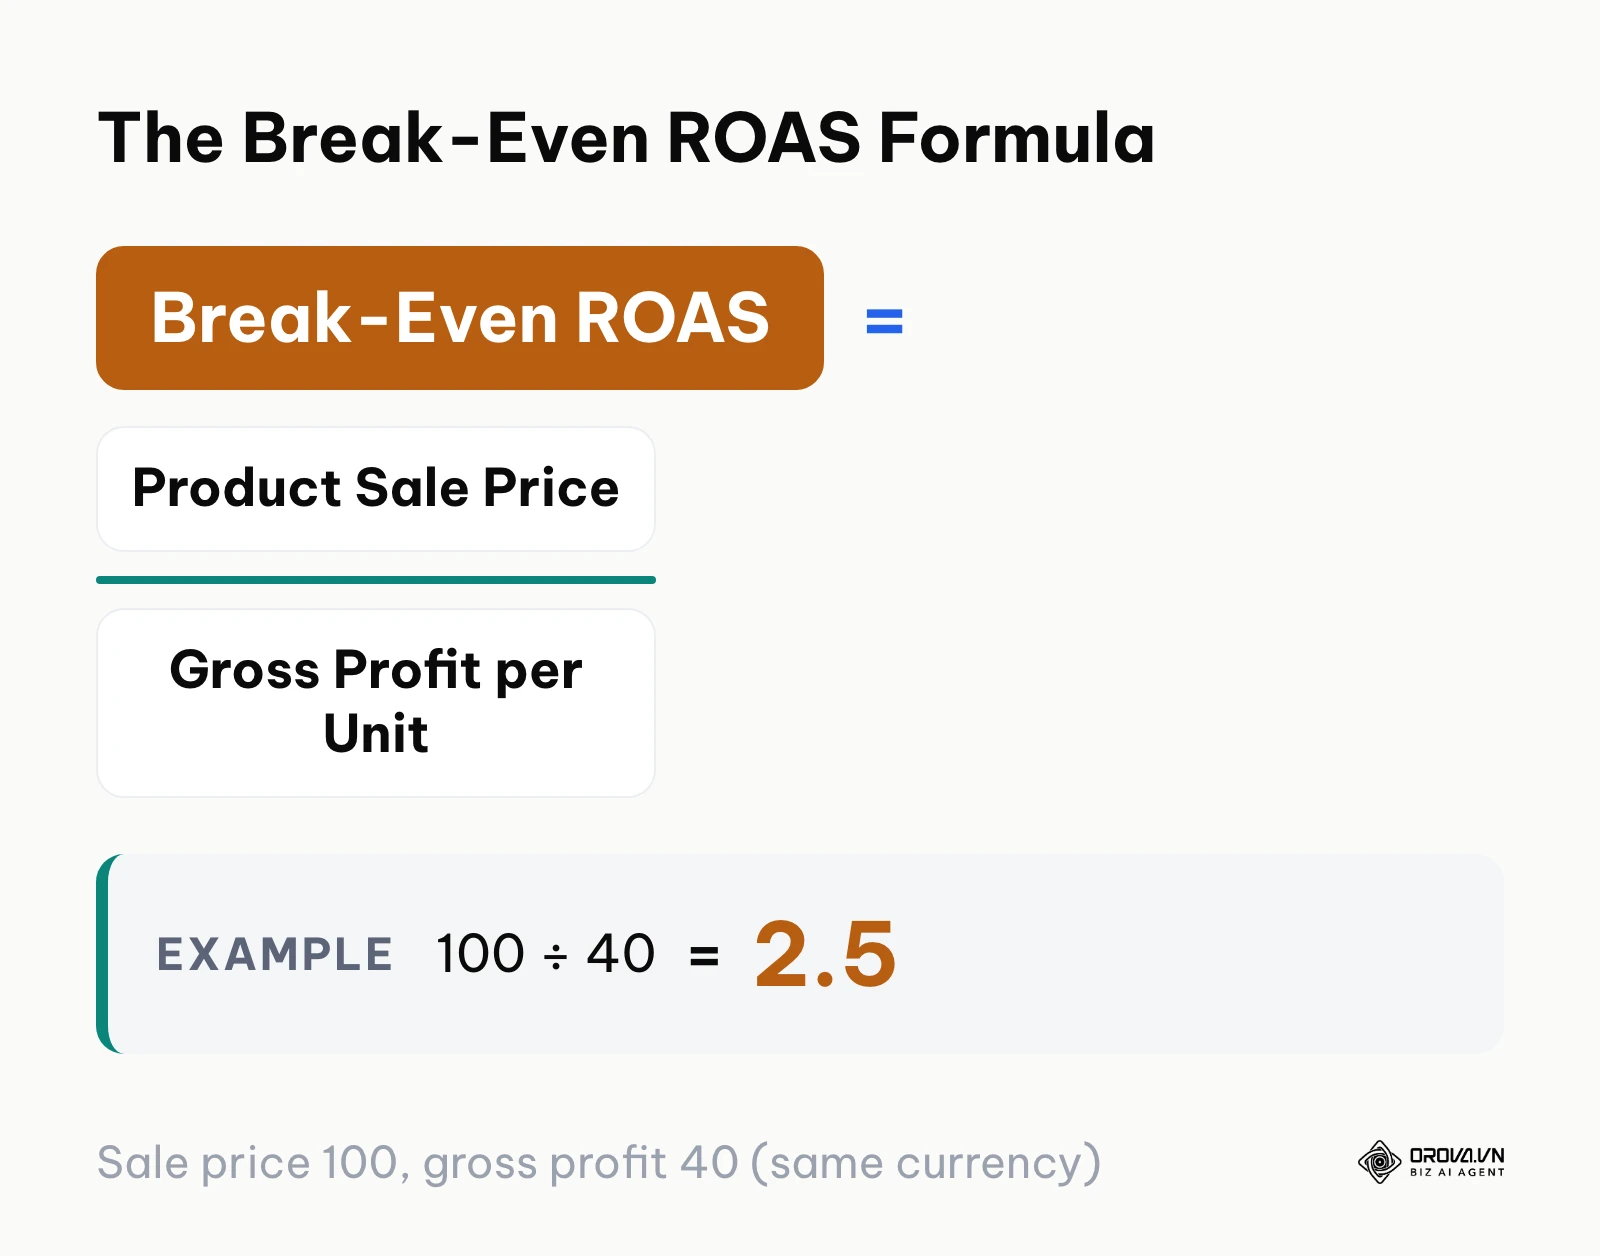
A break even roas calculator is a financial tool used by advertisers to determine the exact return on ad spend required to cover all product and advertising costs without losing money. It helps you understand your minimum viable performance, distinguishing a truly profitable campaign from one that merely generates revenue. The formula below summarizes the basic mathematical structure.
Where did this concept originate? As digital advertising evolved from simple cost-per-impression brand awareness into strict direct-response marketing, merchants needed a mathematical safeguard. The concept of break-even analysis has always existed in traditional finance, but it was specifically adapted for the digital ad auction to prevent businesses from scaling unprofitable campaigns blindly based on vanity metrics.
Here is how this concept differs from other closely related metrics in the industry:
| Concept | How it differs | Example |
|---|---|---|
| Target ROAS | This is your goal for profit, which is usually set significantly higher than your break-even point to ensure sustainable business growth. | Break-even is 2.0; Target is 3.5. |
| roas vs roi e-commerce | ROAS only measures gross revenue from ad platforms against ad spend. ROI measures net business profit, factoring in all overhead like rent and salaries. | ROAS is 4.0, but ROI might be negative if operational costs are too high. |
| MER (Marketing Efficiency Ratio) | MER compares total store revenue to total marketing spend across all channels, providing a holistic view independent of platform attribution. | Total Shopify sales / Total Meta & Google ad spend combined. |
To understand this better, consider an everyday example. Imagine you are selling lemonade. It costs you 1 dollar for the cup, the lemons, and the sugar. You sell the cup for 3 dollars. Your gross profit is 2 dollars. If you pay a friend to stand on the corner and yell about your lemonade stand, how much can you pay them per sale without losing money? You can pay them exactly 2 dollars. If you spend 2 dollars on advertising to generate a 3 dollars sale, your return on ad spend is 1.5 (3 dollars / 2 dollars). In this scenario, 1.5 is your break-even point. Anything lower, and you are losing money on every cup sold.
Why Break-Even ROAS Matters
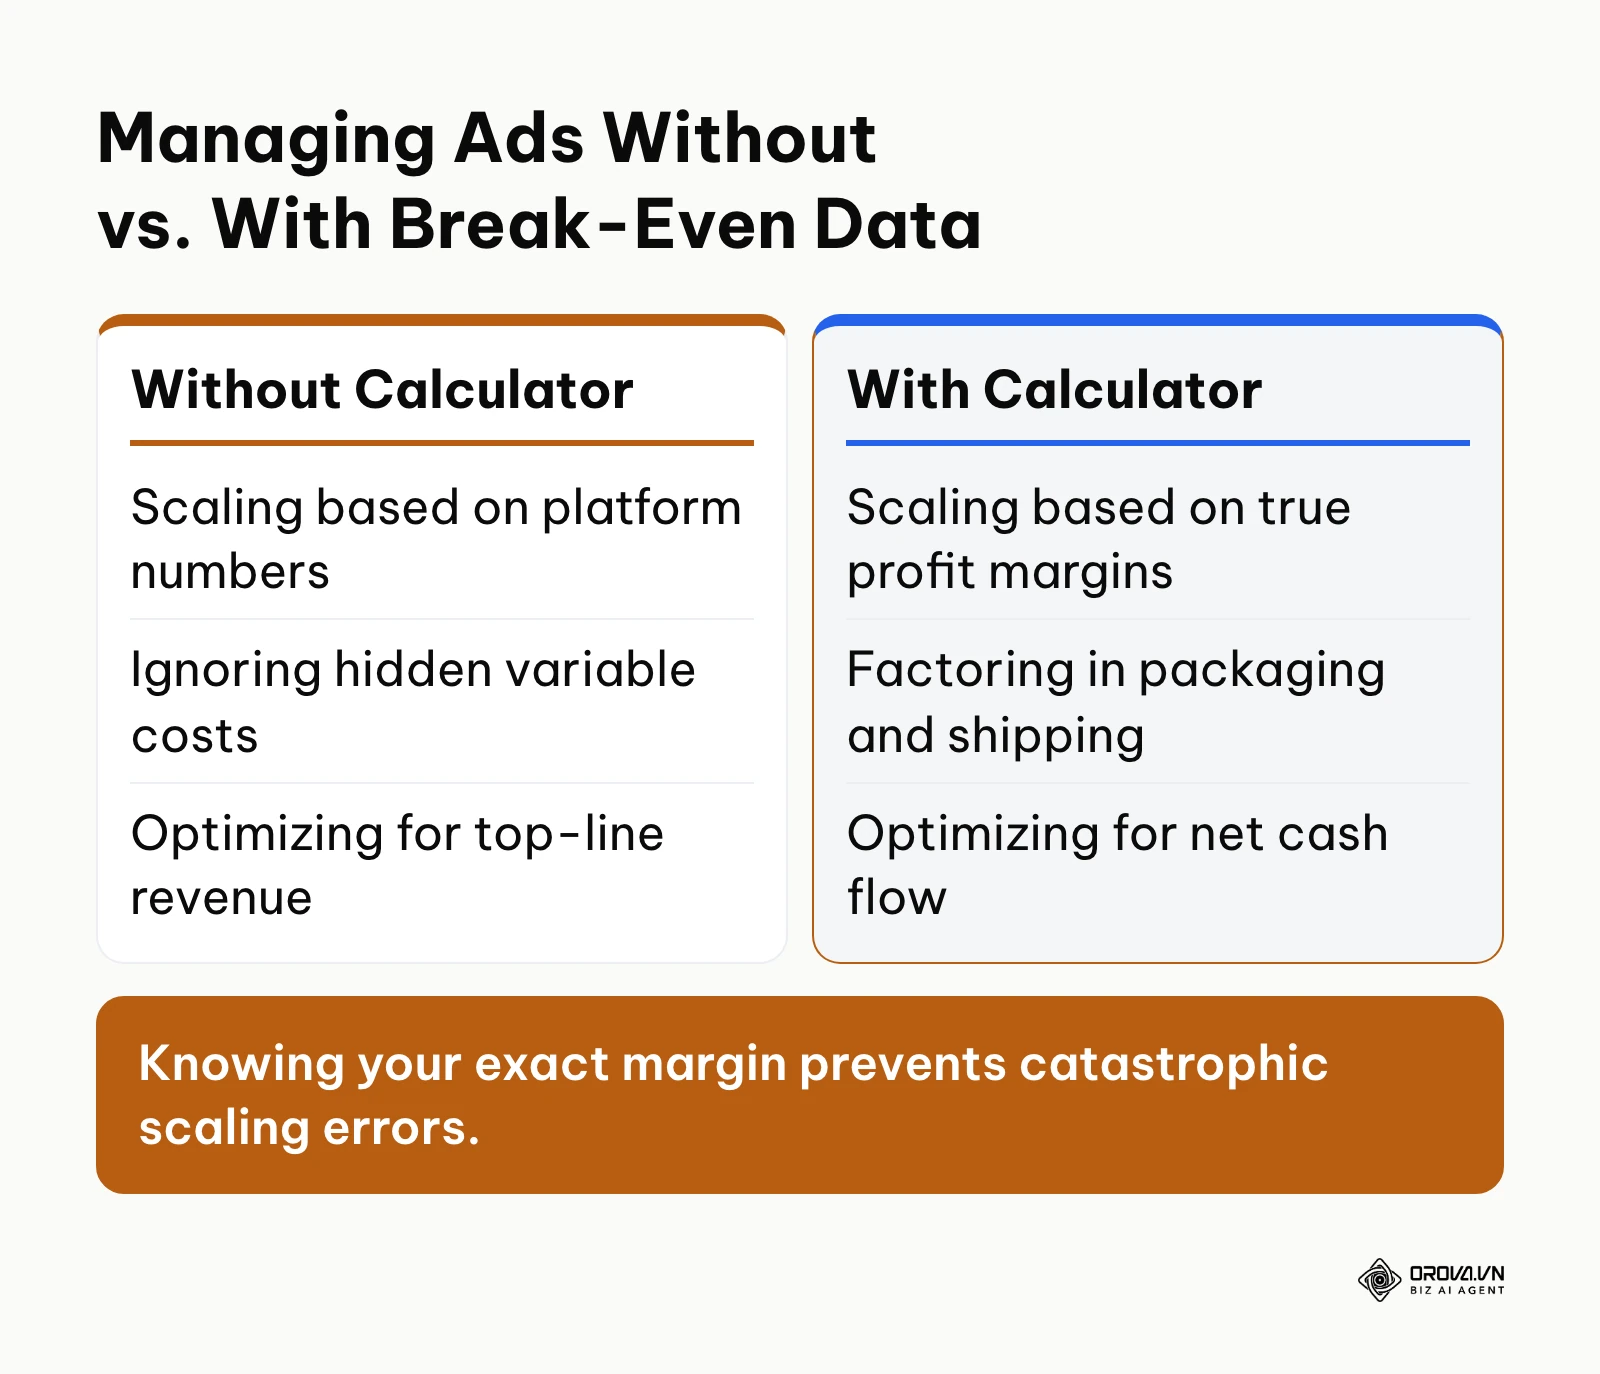
Break-even ROAS exists to solve a fundamental disconnect between marketing dashboards and bank accounts. Advertising platforms like Meta and Google are designed to report revenue generated from ad clicks, but they have absolutely no visibility into your supply chain, your warehouse fees, or your merchant processing costs. They will happily report a successful campaign because it generated 10,000 dollars in sales from 4,000 dollars in spend. However, if the products cost 7,000 dollars to manufacture and ship, your business just lost 1,000 dollars in real cash. The comparison below summarizes the operational differences when you utilize this data.
This calculation sits right at the intersection of marketing and finance. In the bigger picture, it acts as the necessary bridge between the media buyer optimizing bids and the Chief Financial Officer managing the cash runway. Before you scale any budget, you must have your break-even numbers defined. After you launch campaigns, you use these numbers daily to trim waste and push profitable winners.
If you ignore this metric, the consequences are severe. You will likely fall into the trap of scaling unprofitable campaigns simply because the dashboard shows a positive return. Over time, you will burn through your working capital, your inventory will deplete, and you will have no cash left to restock, leading to the rapid death of the business. Merchants who track unit economics closely are far better placed to avoid cash flow crises during rapid scaling phases.
When you don't need a break even roas calculator yet: There are specific scenarios where obsessing over immediate profitability is counterproductive. If you are a pre-revenue startup running awareness campaigns to test product-market fit, strict break-even constraints will choke your data collection. Similarly, when launching a highly anticipated brand campaign designed purely for top-of-mind recall rather than direct sales, immediate ROAS is the wrong metric. In these phases, you should focus on cost per acquisition for leads or cost per mille for reach instead.
The Business Value and Operator Benefits
Understanding your exact margins provides immense value across two distinct layers: the overarching health of the business and the day-to-day effectiveness of the person running the ads.
Business Value: Protecting Cash and Mitigating Risk
For the business as a whole, calculating accurate margins preserves working capital. It transforms advertising from a risky expense into a predictable growth engine. By knowing exactly how much you can afford to spend to acquire a customer, the business eliminates the risk of accidental overspending. Furthermore, this clarity saves immense amounts of time during monthly financial reconciliations. Instead of wondering why the bank balance does not match the ad platform's reported revenue, the leadership team can clearly see how ad spend translates directly into net cash flow.
Operator Benefit: Confident Media Buying
For the performance marketer or agency owner, the benefit is confidence. Before implementing a strict calculation, media buyers often operate in a state of anxiety, pausing campaigns prematurely out of fear or scaling them recklessly based on flawed platform metrics. After implementing a precise target, the media buyer has a clear, objective rulebook. They know exactly when to push the budget and when to pull back, removing all emotion from the decision-making process. Ultimately, this is the essence of what is performance marketing – making measurable, data-driven decisions that impact the bottom line.
| Benefit | Measured by | Visible after |
|---|---|---|
| Reduced wasteful ad spend | Lower CPA on underperforming SKUs | 7 days |
| Increased gross profit | Higher net margin per order | 30 days |
| Faster decision making | Time spent auditing accounts | 3 days |
Illustrative example: You are a performance marketer at a mid-sized apparel brand managing a 50,000-dollar monthly ad budget. Previously, you optimized all Meta campaigns toward a flat 2.5 ROAS target. To fix stagnant profit margins, you audited the catalog and implemented a tiered break-even system using a rigorous calculation. First, you tagged high-margin winter coats (break-even 1.5) and low-margin summer tees (break-even 3.2). Second, you split the campaigns by margin profile. Third, you adjusted the bidding strategy for each group accordingly. The struggle was that the blended platform ROAS initially dropped from 2.5 to 2.1, causing panic among stakeholders. You resolved this by showing the net profit dashboard; because the budget shifted toward high-margin coats that only needed a 1.5 ROAS to break even, the actual net profit rose, proving the strategy's effectiveness.
OROVA ADS applies AI Agent to automate and optimize ad performance on Google, Meta and TikTok. Scale your budget safely, monitor 24/7 and expand your business quickly.
Experience the solution at orova.vn/ads
How a Break-Even ROAS Calculator Works
This is the most critical and complex aspect of digital advertising. A proper calculation is not just a simple division equation; it is an entire ecosystem of data that requires careful mapping of your supply chain, understanding your customer behavior, and aligning your reporting tools. We will break this down into seven distinct components, from the foundational math to advanced multi-SKU strategies.
Component 1: The Foundation - Gross Margin and The 7 Hidden Costs
Before you can determine your minimum viable ad return, you must calculate your true gross profit margin. This is where most businesses fail. They simply subtract the manufacturing cost from the retail price and call it a day. However, e-commerce is plagued by hidden variable costs that eat away at your profit before the advertising bill even arrives. The checklist below summarizes the critical expenses you must track.
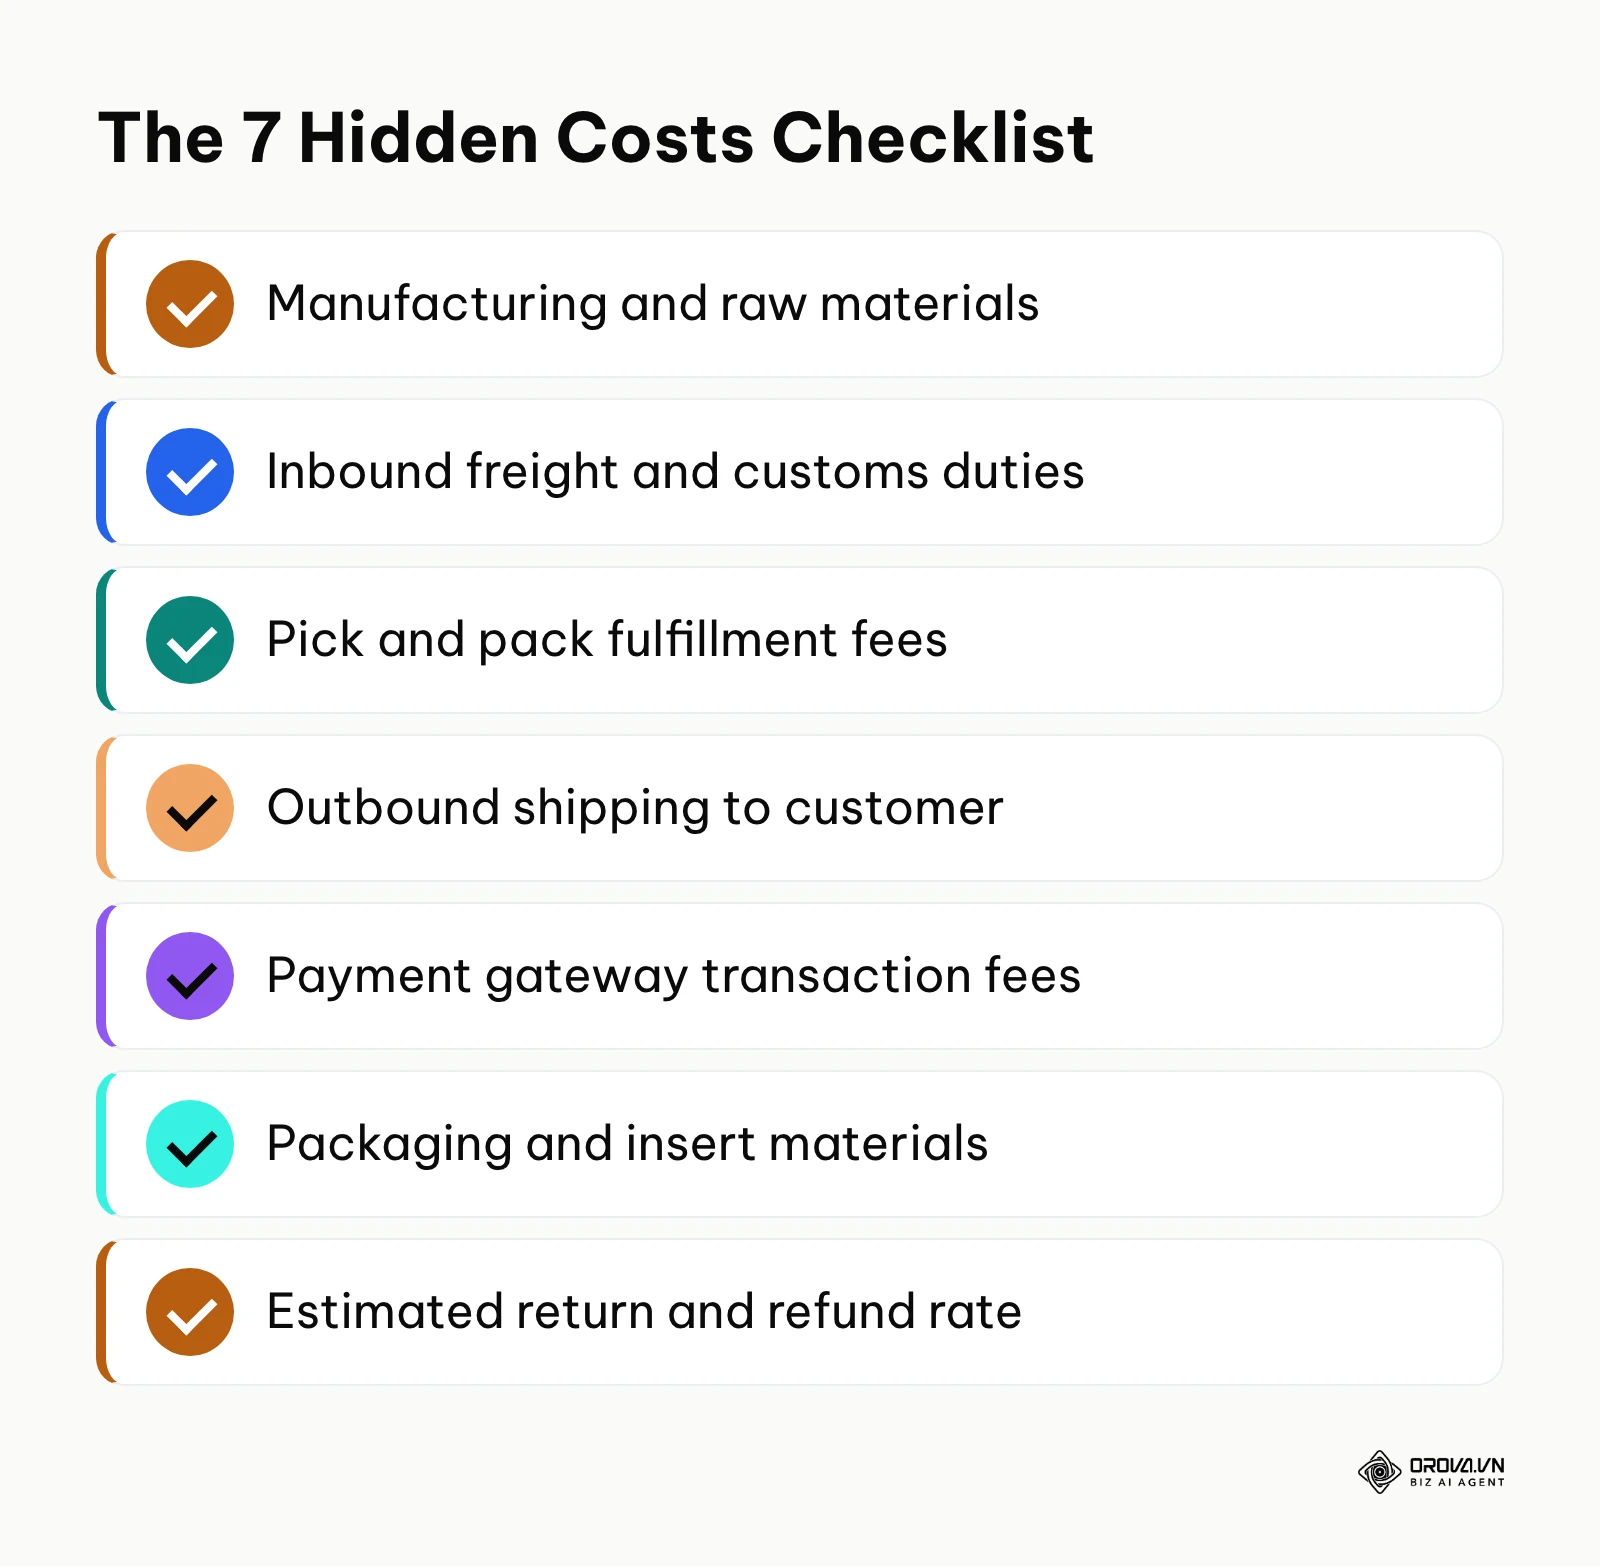
To accurately calculate your margin, you must account for these seven hidden costs on every single item:
- Cost of Goods Sold (COGS): This is the raw manufacturing cost of the product.
- Inbound Freight: The cost to ship the goods from the factory to your warehouse. You must divide the total container cost by the number of units.
- Pick and Pack Fees: If you use a Third-Party Logistics (3PL) provider, they charge a fee every time a worker touches a box.
- Outbound Shipping: The cost to send the item to the customer. If you offer "Free Shipping," this cost directly reduces your margin.
- Payment Gateway Fees: Processors like Stripe or PayPal typically charge a percentage of the order plus a small fixed fee on every single transaction.
- Packaging Materials: Custom boxes, tissue paper, and thank-you cards add up quickly.
- Return Allowances: If 5% of your orders are returned, you must factor in a 5% margin buffer to account for the lost product and reverse shipping costs.
Component 2: The Core Formula and Single-SKU Calculation
Once you have your true variable costs, you subtract them from your retail price to find your gross profit in dollars. Then, you divide that profit by the retail price to find your Gross Profit Margin percentage. It is vital to understand the core roas formula before diving into the advanced math.
The formula is: Break-Even ROAS = 1 / Gross Profit Margin
For example, if you sell a pair of shoes for 100 dollars, and the sum of all your hidden costs (manufacturing, shipping, fees) is 60 dollars, your gross profit is 40 dollars. Your Gross Profit Margin is 40% (or 0.40). Your Break-Even ROAS is 1 / 0.40 = 2.5. This means for every 1 dollar you spend on ads, you must make 2.50 dollars in revenue just to cover your costs.
Component 3: Blended Break-Even ROAS for Multi-SKU Stores
The single-SKU formula works perfectly if you only sell one product. However, if your store sells hundreds of items with wildly different margins, applying a single target will destroy your profitability. This is a massive gap in how most advertisers operate.
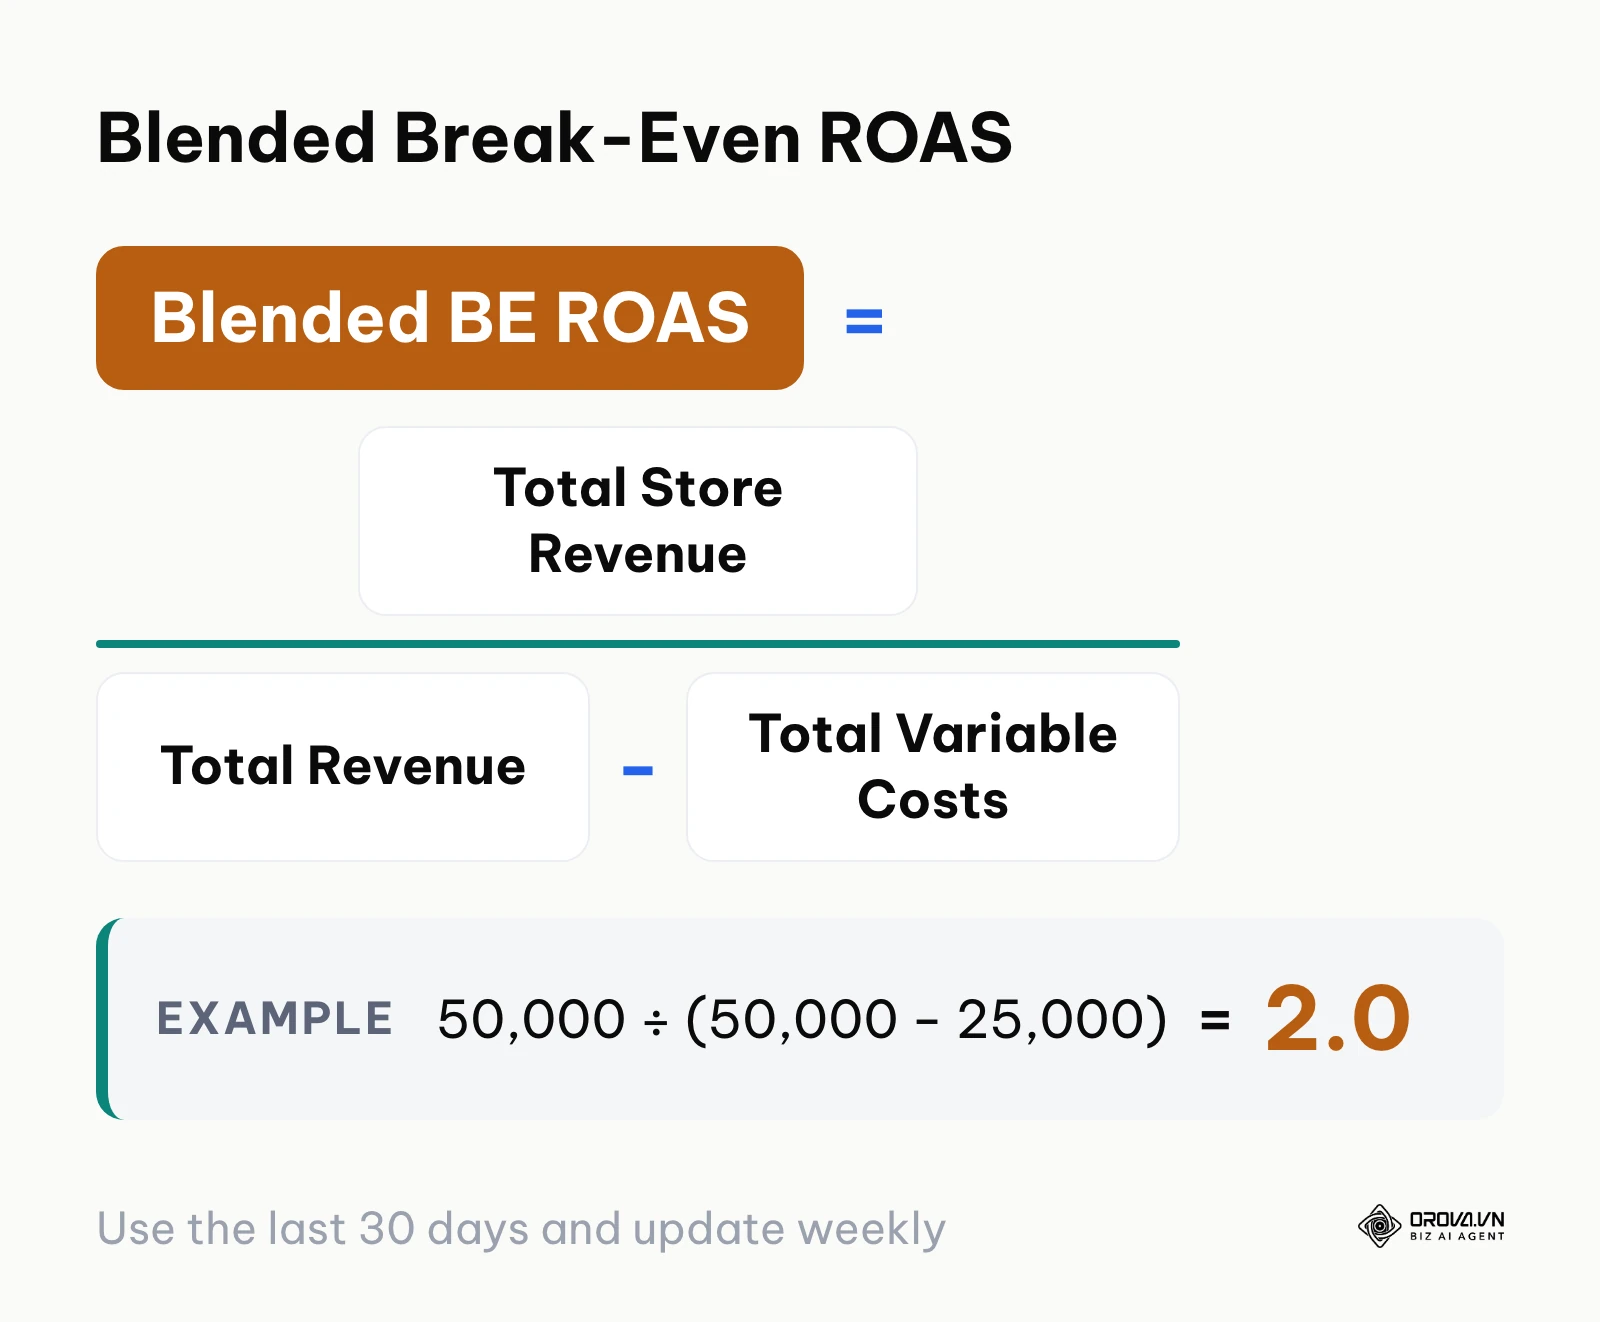
If you sell a 20-dollar lip balm with an 80% margin and a 200-dollar skincare device with a 30% margin, your account needs a Blended Break-Even ROAS. To calculate this, you must determine your weighted average margin. You take the total cost of all goods sold over the last 30 days and subtract it from the total revenue.
For instance, if your total store revenue was 50,000 dollars and your total variable costs were 25,000 dollars, your blended store margin is 50%. Therefore, your blended break-even target is 2.0. However, you must update this number weekly, especially if a low-margin product suddenly goes viral, which would drastically alter your weighted average and push your break-even point higher.
Component 4: First-Order vs. LTV Break-Even Analysis
Many beginners ask what is a good roas, but the truth is that "good" depends entirely on your customer lifecycle. Looking solely at the first purchase is called First-Order Break-Even. If your target is 2.0, and the campaign hits 1.5, conventional wisdom says you are losing money and should turn it off.
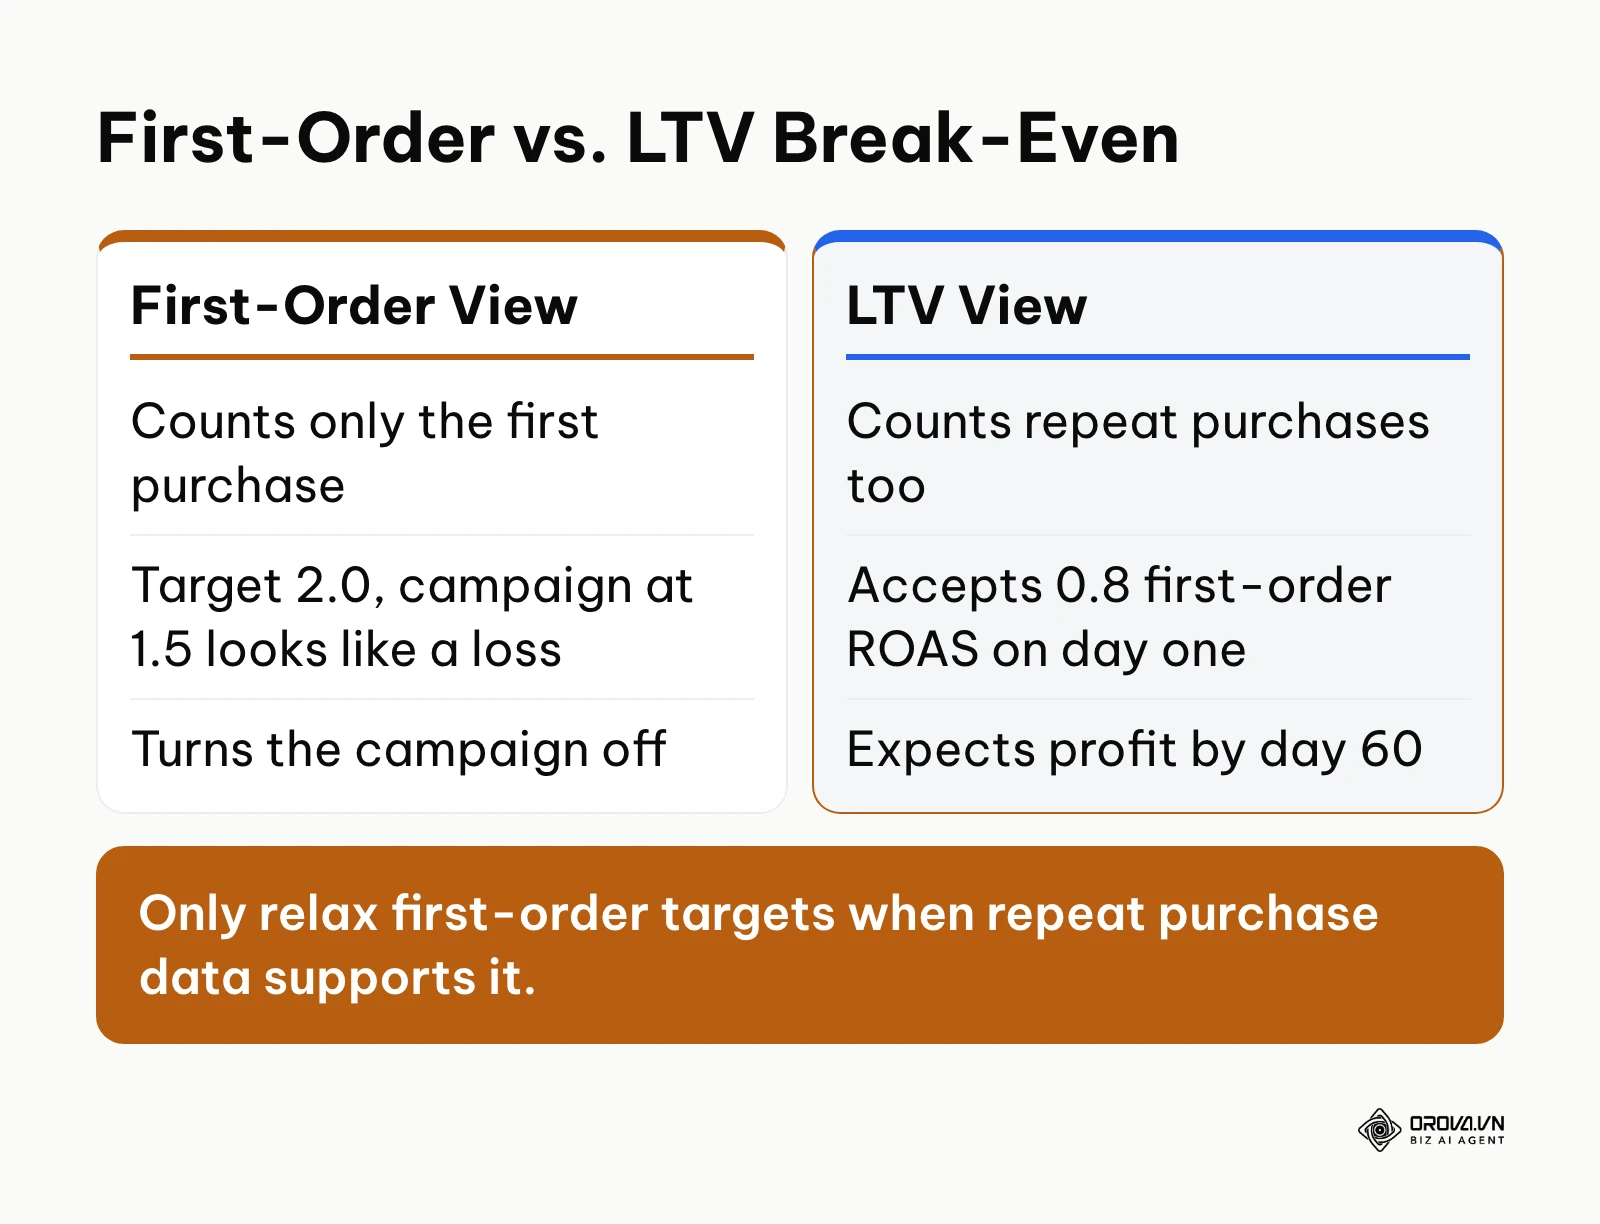
However, sophisticated brands look at Customer Lifetime Value (LTV). If you sell a consumable product like coffee or supplements, you know that a percentage of customers will buy again next month without you having to pay for a new ad click. If your data shows that customers spend an additional 100 dollars over the next three months, your LTV margin is much higher. If you have not built one yet, start with a profit-based LTV model before relaxing your first-order targets. In this scenario, brands will gladly accept a 0.8 First-Order ROAS—technically losing money on day one—because they know the recurring purchases will make the customer highly profitable by day 60.
Component 5: Bridging the Gap - MER vs. Platform ROAS
Another critical gap in understanding profitability is the difference between what the ad platform reports and what is actually happening in your bank account. Due to tracking restrictions and privacy updates, platforms like Meta and Google often over-report conversions (taking credit for organic sales) or under-report them (missing sales due to blocked cookies).
If you blindly optimize based on the platform's ROAS, you are optimizing based on flawed data. You must bridge this gap by using the Marketing Efficiency Ratio (MER). MER is calculated by taking your total store revenue (from your backend platform, like Shopify) and dividing it by your total ad spend across all channels. If your platform says your ROAS is 3.0, but your MER is only 1.5, you have a tracking discrepancy that is artificially inflating your performance. Your break-even decisions must ultimately be governed by your MER.
Component 6: The Dynamic Break-Even & Target ROAS Matrix
To handle the complexity of multiple SKUs, changing shipping thresholds, and varying discount codes, you cannot rely on mental math. You need a dedicated, dynamic matrix built in Google Sheets or Excel. This tool serves as the ultimate source of truth for your media buying team.
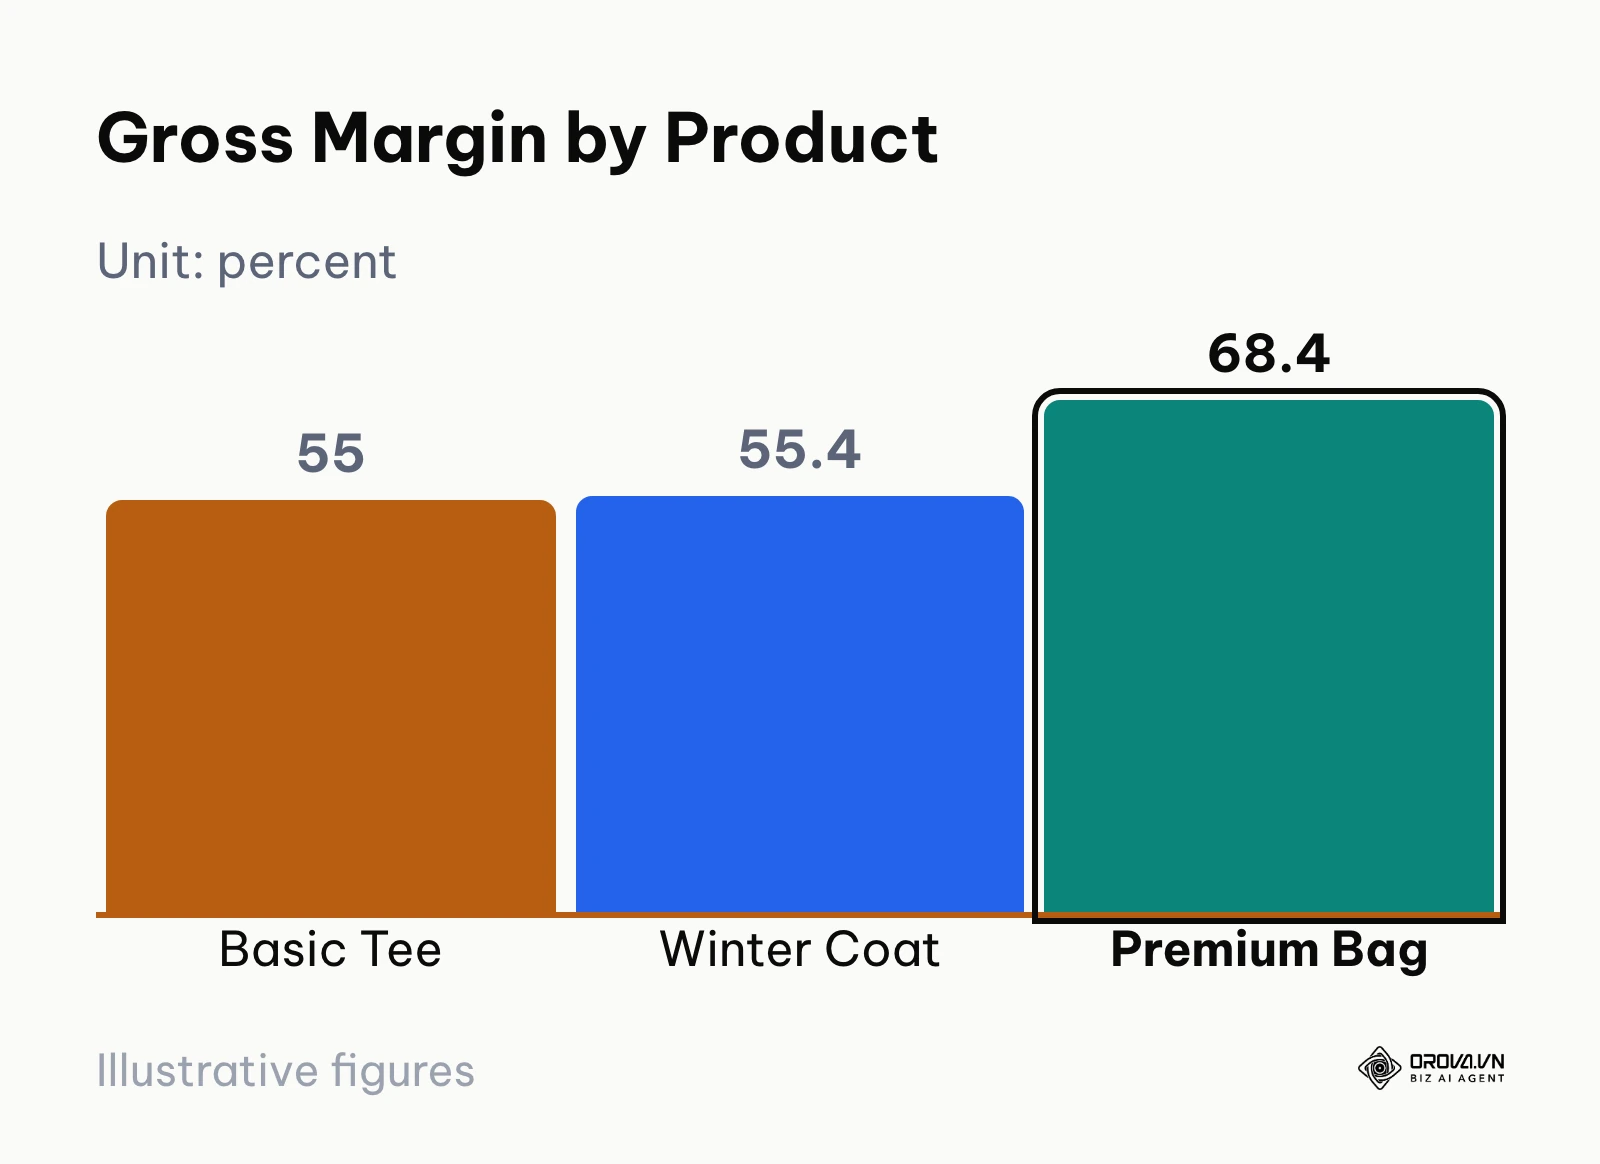
Here is exactly how you should structure your internal spreadsheet:
| SKU / Product (amounts in dollars) | Sale Price | COGS | Shipping | Fees | Gross Margin (amount) | Gross Margin (%) | Break-Even ROAS | Target ROAS (Break-Even × 1.2) |
|---|---|---|---|---|---|---|---|---|
| Basic Tee | 30.00 | 8.00 | 4.00 | 1.50 | 16.50 | 55.0% | 1.82 | 2.18 |
| Winter Coat | 120.00 | 40.00 | 10.00 | 3.50 | 66.50 | 55.4% | 1.80 | 2.17 |
| Premium Bag | 250.00 | 60.00 | 12.00 | 7.00 | 171.00 | 68.4% | 1.46 | 1.75 |
When your store runs a 15% off weekend sale, you simply duplicate this sheet, lower the "Sale Price" column by 15%, and watch as the break-even requirements instantly increase. This matrix prevents your team from blindly running discounts without understanding how much harder the ads have to work to maintain profitability.
Component 7: The Scale, Hold, or Kill Decision Framework
Once you have your numbers, you need a system to act on them. Data is useless if it does not dictate a clear action. The matrix below summarizes the exact logical path you should follow when analyzing your campaigns every morning.
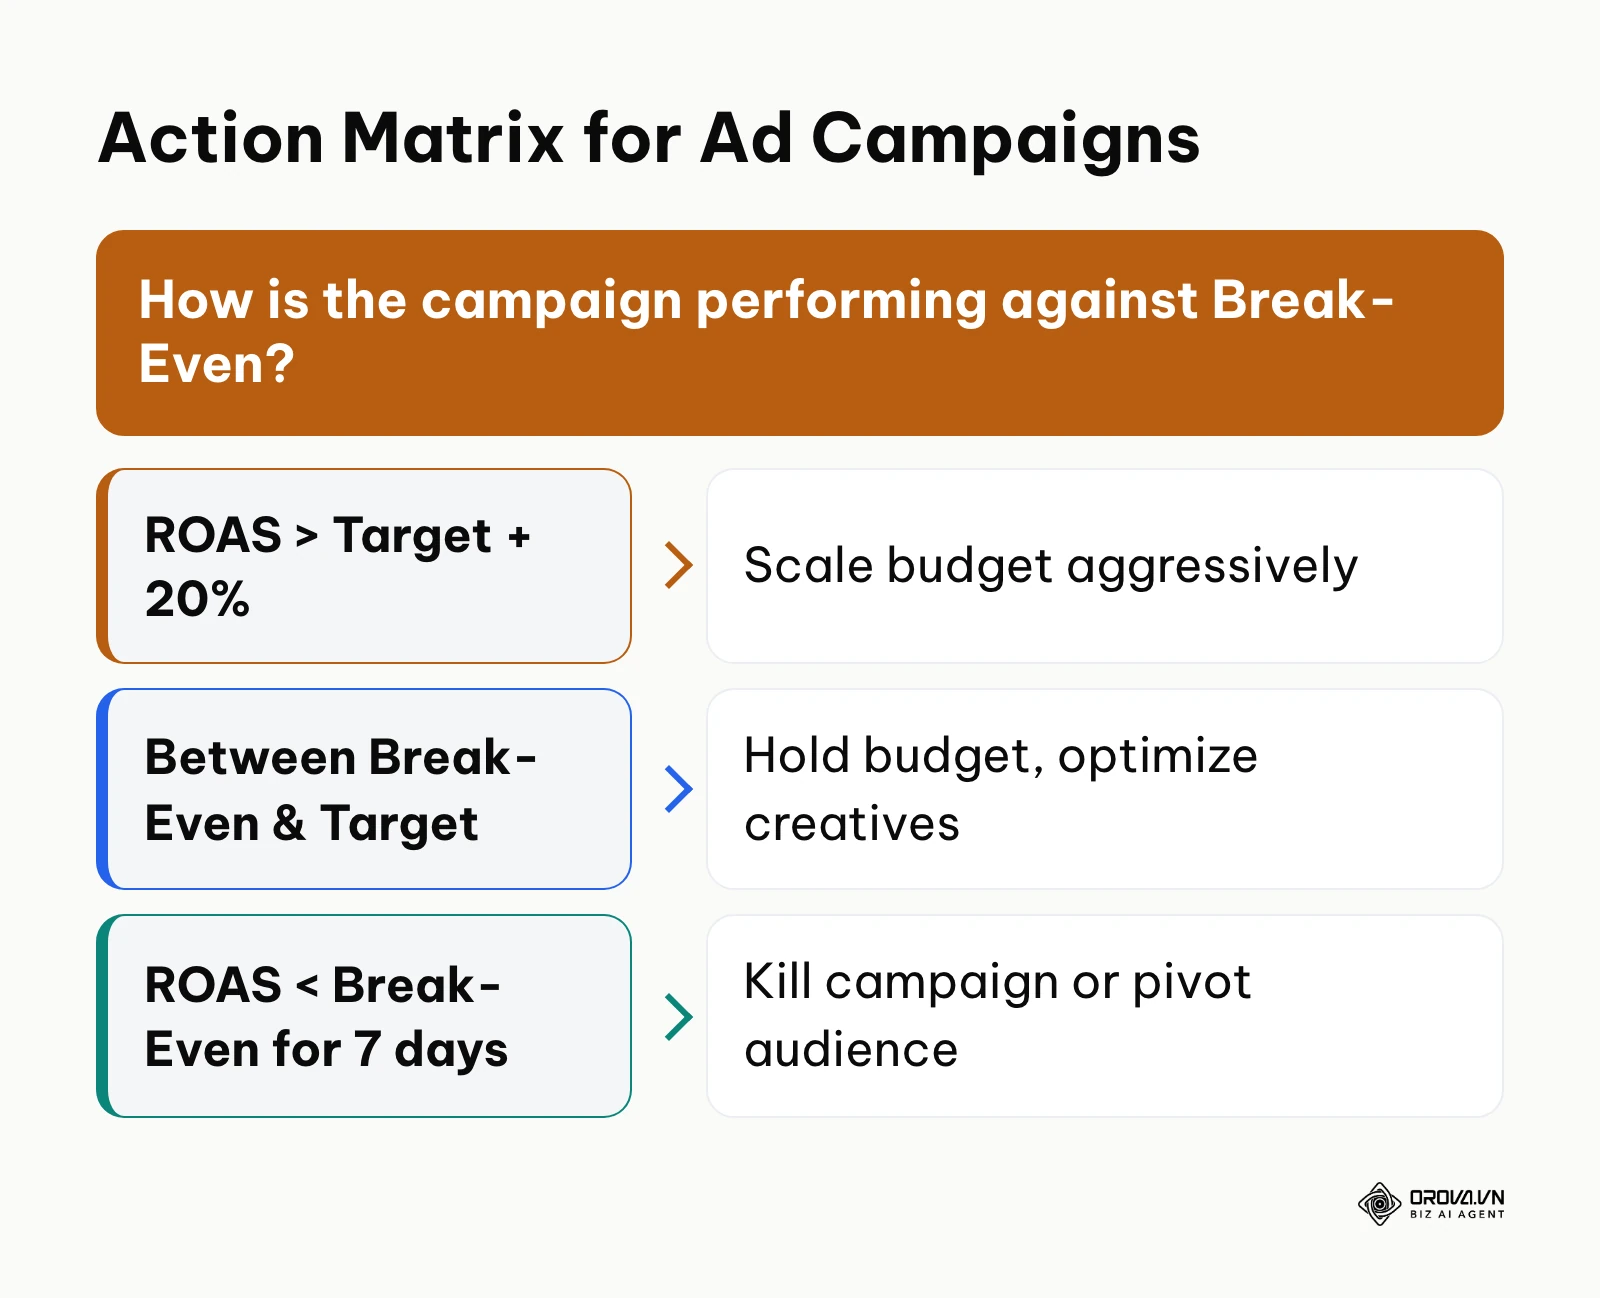
You should set a Target ROAS that is comfortably above your break-even point to ensure a healthy net profit. When a campaign performs above this target plus a 20% buffer, you scale the budget aggressively. When it hovers between break-even and target, you hold the budget steady and work on improving the creative elements. If it dips below break-even for seven consecutive days, you ruthlessly kill the campaign or pivot to a completely new audience segment.
Illustrative example: You are the owner of a small cosmetics e-commerce business trying to scale your flagship bundle. You calculated your initial target based purely on the raw manufacturing cost and began aggressive Google Ads spending. Two weeks in, the platform reported a 2.8 ROAS, well above your estimated 2.0 break-even point. However, your bank account balance was decreasing. The misstep was forgetting to include the pick-and-pack fees from your 3PL warehouse, the 2.9% payment gateway fee, and the cost of premium packaging materials. By recalculating the true margin using a comprehensive formula, you discovered the real break-even requirement was actually 3.1. You paused the bleeding campaigns, negotiated a cheaper shipping rate, and adjusted your bids, eventually stabilizing the business into a profitable scaling phase.
How to Get Started and Adapt
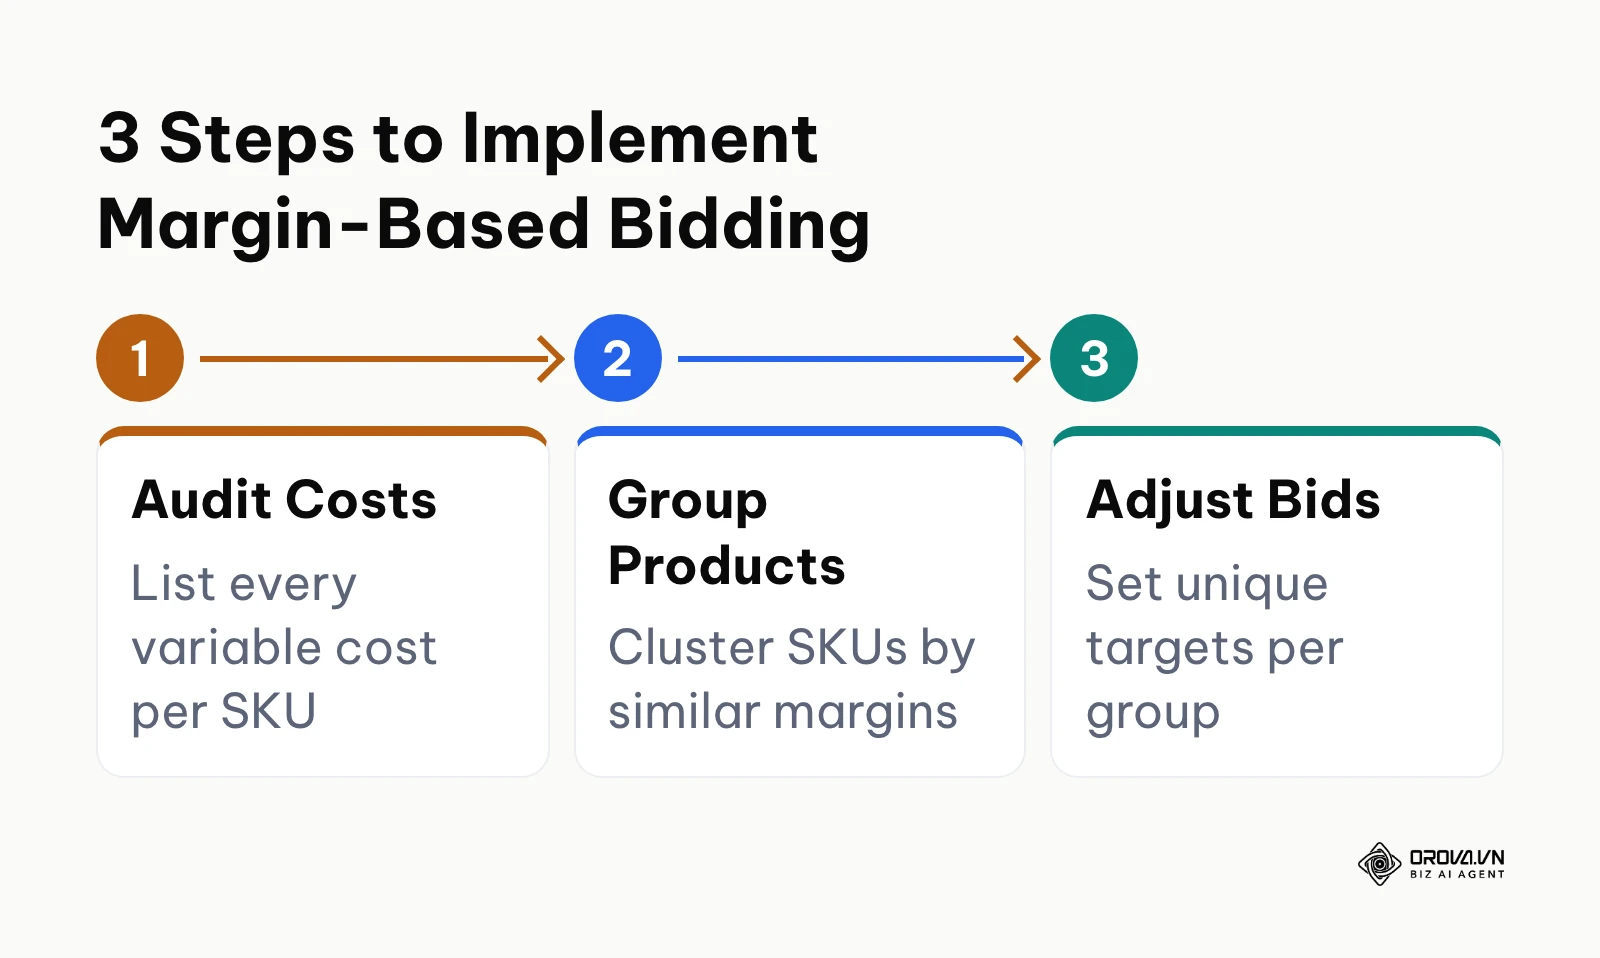
Adapting to a margin-focused media buying strategy requires different actions depending on your role within the ecosystem. A business owner views this data differently than a freelance media buyer. The process below summarizes the immediate actions required to transition your account.
For E-commerce Business Owners
The owner is responsible for the overall financial architecture. Your job is to ensure the numbers given to the marketing team are flawless.
- Map out every single variable cost associated with your top three best-selling products.
- Negotiate with your logistics provider to reduce pick-and-pack fees, as this directly lowers your break-even threshold.
- Build the dynamic matrix template and lock the formula cells so your team cannot accidentally alter the core math.
- Mandate that every new product launch must have its break-even numbers approved before any ad budget is allocated.
For In-House Performance Marketers
As the internal operator, you must translate the financial data into platform execution.
- Group your ad account campaigns by margin tier. Keep high-margin products in one campaign and low-margin products in another.
- Set specific bidding rules in your ad accounts that automatically pause ads if they drop below the assigned tier target for three consecutive days.
- If you find your boost post vs ads manager performance conflicting, it is time to consolidate your tracking and rely solely on the Ads Manager data matched against your true margin.
- Present a weekly MER report to the owner, comparing the platform numbers to the actual bank deposits.
For Freelance Media Buyers and Agencies
Agencies must use this data to manage client expectations and prove their value beyond vanity metrics.
- Demand a breakdown of the client's variable costs during the onboarding phase. Never accept a flat, arbitrary ROAS goal.
- Educate the client on the difference between first-order profitability and lifetime value, especially if they sell consumable goods.
- Create a customized reporting dashboard that shows net profit generated, not just gross revenue.
| Mistake | Consequence | How to avoid |
|---|---|---|
| Using a flat account-wide target | Low-margin items will bleed cash secretly. | Segment campaigns strictly by product margin tiers. |
| Forgetting payment gateway fees | Overestimating profit by a few percent on every order. | Hardcode your processor's fee rate into your spreadsheet formula. |
| Ignoring return rates | Refunding money for ads you already paid for. | Add a 5% margin buffer based on historical return data. |
Illustrative example: You are a freelance media buyer managing an account for a high-ticket furniture retailer. The client demanded a 5.0 ROAS on all campaigns, believing anything lower was a loss. You analyzed their customer lifetime value and realized 40% of customers bought a second item within three months. You built a custom matrix to demonstrate that their first-order break-even requirement was only 2.2. You proposed a test: running a top-of-funnel campaign aimed at a 2.5 ROAS. The struggle was the client's intense resistance to lower return metrics; they threatened to pause the account after five days. You held firm, educating them on the 30-day delayed attribution cycle and the follow-up email flows. The result was a massive influx of new customer acquisition that, while initially looking weak on the ad platform, turned cash-flow positive by week three due to backend repurchases.
Want to scale your budget but afraid of breaking performance? 📉
Integrate OROVA ADS now - an AI Agent that automatically monitors and optimizes Google, Meta, TikTok ads 24/7. Now, expanding and replicating your Performance Ads team is just one click away.
🚀 Try it now at: orova.vn/ads
Trends for Ad Profitability in the Next Few Years: Author's Perspective
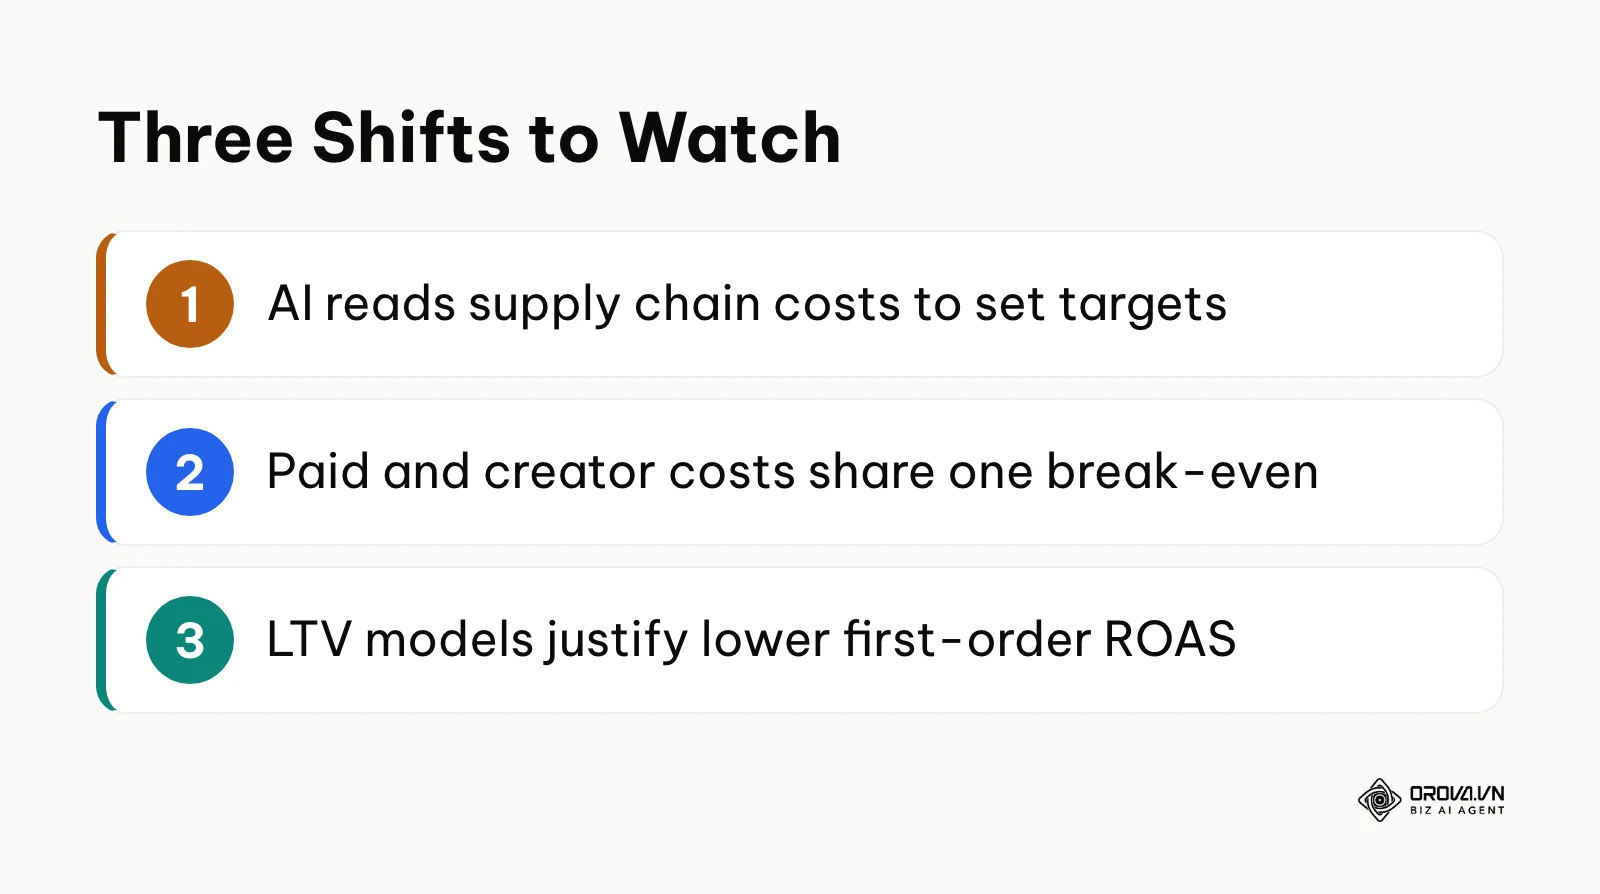
The landscape of digital profitability is shifting rapidly. As tracking becomes harder and costs rise, the way we calculate and enforce margins must evolve. Based on the data available as of 2026, I foresee three major shifts in how advertisers will handle break-even metrics in the near future. The summary below lists the three shifts.
The Shift to AI-Driven Predictive MER
As of 2026, we are seeing AI tools optimize bids based on historical data, but I predict that within a few years, AI will dynamically read your supply chain costs and adjust the break-even target for every single ad auction. The moment a shipping rate increases in your logistics software, the AI agent will instantly lower the bids on the ad platform to protect the margin. I believe manual spreadsheets will soon become obsolete for high-volume stores. However, this prediction could be entirely wrong if strict privacy laws restrict the necessary server-to-server cost data sharing between platforms.
The Blending of Organic and Paid Margins
Currently, brands separate influencer affiliate costs from their paid social metrics. I believe that platforms will soon force advertisers to calculate a unified break-even point that accounts for both the ad click cost and the creator commission simultaneously in the auction. We are already seeing this trend emerge with native shopping features. Advertisers should prepare by unifying their influencer and performance marketing teams into a single profit center today. This might not happen if creators resist integrated commission structures and demand flat upfront fees instead.
Subscription Models as the Ultimate Cheat Code
I am leaning towards a future where LTV is perfectly modeled within hours of user acquisition. I predict that brands will accept massive Day-1 financial losses—targeting a first-order ROAS well below 1.0—because predictive models will guarantee the second and third purchases with pinpoint accuracy. You should focus heavily on optimizing your post-purchase email flows and consumable angles now. This aggressive strategy could fail, however, if consumer subscription fatigue causes churn rates to unpredictably spike, breaking the LTV models.
Frequently Asked Questions about Break-Even ROAS
What happens if my platform ROAS is higher than break-even, but I am still losing cash?
This is a classic tracking discrepancy caused by over-attribution. The ad platform is likely taking credit for organic sales or returning customers who would have purchased anyway. To fix this, you must shift your focus to your Marketing Efficiency Ratio (MER) and compare total store sales against total ad spend.
Is a break even roas calculator still needed when AI manages ads?
Absolutely. AI is incredibly powerful at finding conversions, but it only optimizes toward the targets you provide. If you feed an AI bidding algorithm a target that is below your true margin, the AI will efficiently and ruthlessly spend your budget on unprofitable sales. The calculator provides the vital financial constraints the AI needs to operate safely.
How much higher should Target ROAS be compared to Break-Even?
This depends entirely on your business goals and operational overhead. Generally, advertisers aim for a target that is 20% to 30% higher than the break-even point to ensure there is enough net profit to cover fixed costs like salaries, rent, and software subscriptions while still leaving room for growth. Beginners often wonder about target cpa vs target roas and which one is safer; setting a firm ROAS target above break-even is usually the best guardrail for e-commerce.
How do I handle margins when running a site-wide discount?
If you are wondering how to improve roas during a sale, you must realize the math fundamentally shifts. A 20% discount directly reduces your gross profit margin, which mathematically forces your break-even requirement higher. You must recalculate your matrix for the duration of the sale and adjust your ad platform targets upward, or you will inadvertently scale losing campaigns.
Should I calculate break-even differently for Google Ads versus Meta Ads?
The core product margin remains the same regardless of the platform. However, the intent differs. Search ads often capture higher-intent users with a lower return rate, which might slightly improve your margin buffer on Google. Nonetheless, your foundational calculation should remain consistent across all channels to maintain accurate holistic reporting.
Where to Start?
Starting your journey toward profitability requires a clear understanding of your current data maturity. The timeline below summarizes a realistic first-week schedule for your team.
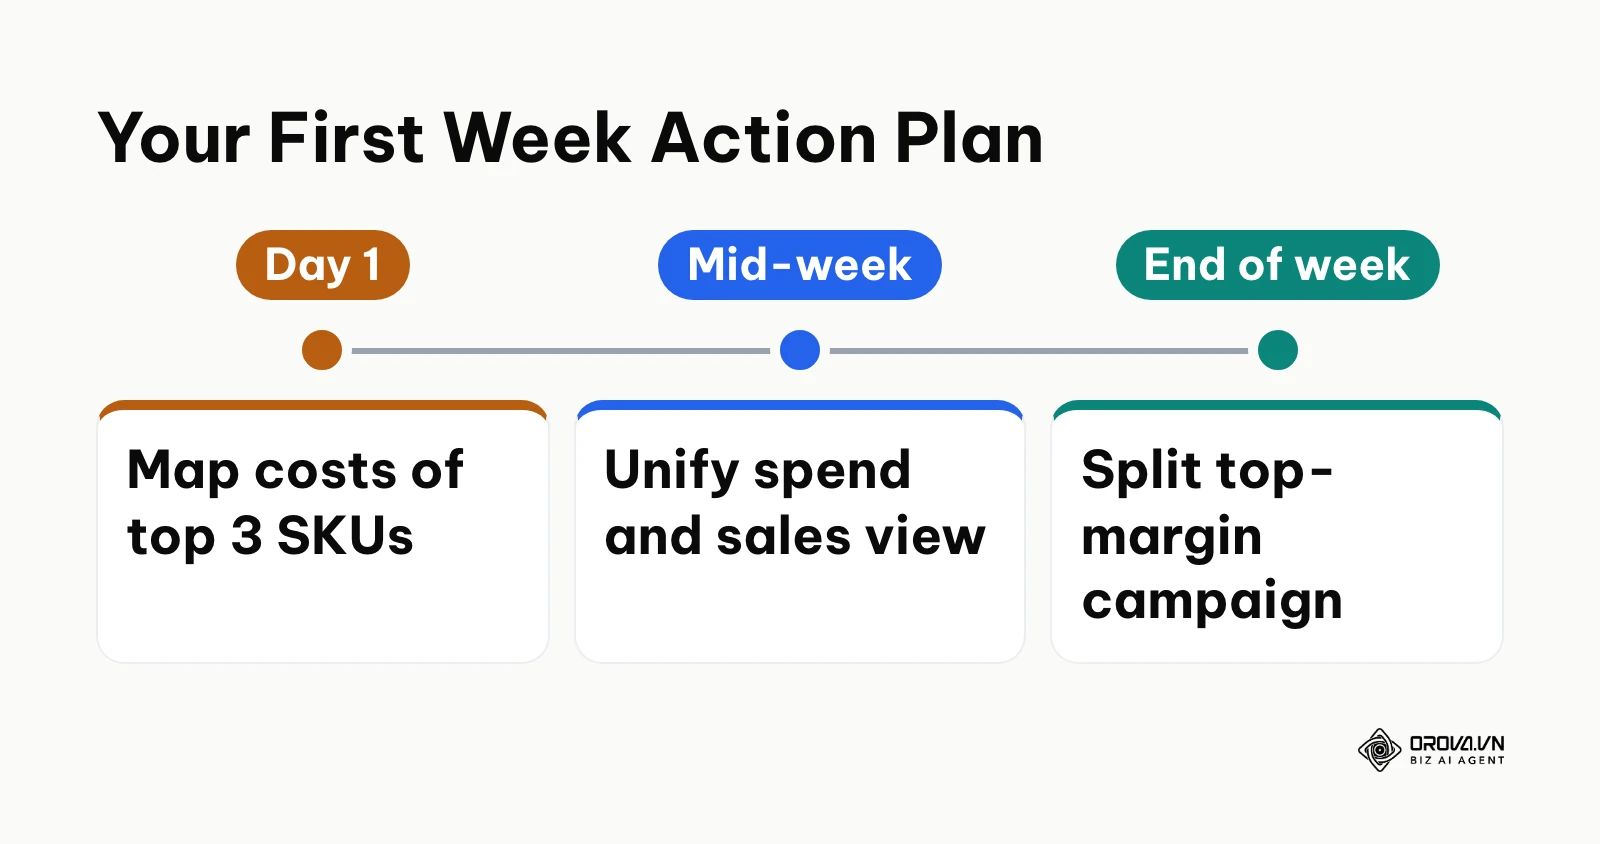
For teams starting from scratch with absolutely no tracking in place, your singular focus should be mapping out your unit economics on a simple piece of paper or a blank document. Do not touch your ad accounts yet. Spend one afternoon gathering the exact manufacturing, shipping, and packaging costs for your top three best-selling items, as this foundational math is a prerequisite for any further optimization.
For businesses that have data but find it disconnected across different platforms, your first move is to consolidate your reporting into a single source of truth. You must set up a dedicated spreadsheet or connect a dashboard that pulls your Meta ad spend, your Google spend, and your backend net sales into the same view. This ensures you can calculate your true marketing efficiency ratio without relying on fragmented platform numbers.
Finally, for advertisers who are actively measuring their numbers but failing to act on them, your immediate next step is to create a tiered campaign structure. Take the product group that has the highest profit margin, separate it into its own dedicated ad campaign, and assign it a distinctly lower target than your historical account average. This allows you to aggressively capture market share safely by the end of the week.
About the author

Builder of Orova
Nguyễn Đỗ Trọng Ân has 8 years of experience in marketing, including 6 years managing market development across Asia. He builds Orova, a Biz AI Agent that never sleeps: it plans, runs and optimizes work for businesses.
Run your business with AI Agents
Orova is the always-on Biz AI Agent — it plans, runs, and optimizes the work for you.
Save time, unlock productivity.