
What is an LTV model? A profit-based guide to customer value

Many companies burn through their marketing budgets because they optimize for the wrong metric. They focus entirely on the cost to acquire a customer, celebrating when they get cheap clicks or low-cost signups. However, acquiring a user for ten dollars is a massive failure if that user only generates five dollars in return before leaving forever. This is where building a proper ltv model becomes critical. An ltv model estimates the total gross profit one customer brings in over the whole relationship, so you know the most you can afford to pay to win that customer.
The traditional way most businesses look at this data is deeply flawed. They calculate total revenue per user, completely ignoring the costs of delivering the service, the profit margins, and the time it takes to realize that money. This leads to aggressive ad spending based on phantom numbers, pushing healthy companies into cash flow crises. This guide provides a detailed, profit-based approach to understanding customer value. We will explore how to calculate true profitability, adapt the framework for different business types, and use these insights to make smarter growth decisions without relying on vanity metrics.
What is an ltv model?
An ltv model is a mathematical framework used to project the total profit, after the direct costs of serving them, that a business will earn from a single customer throughout their entire relationship. It helps companies determine exactly how much they can spend to acquire users without losing money, distinguishing profitable segments from those that drain resources.
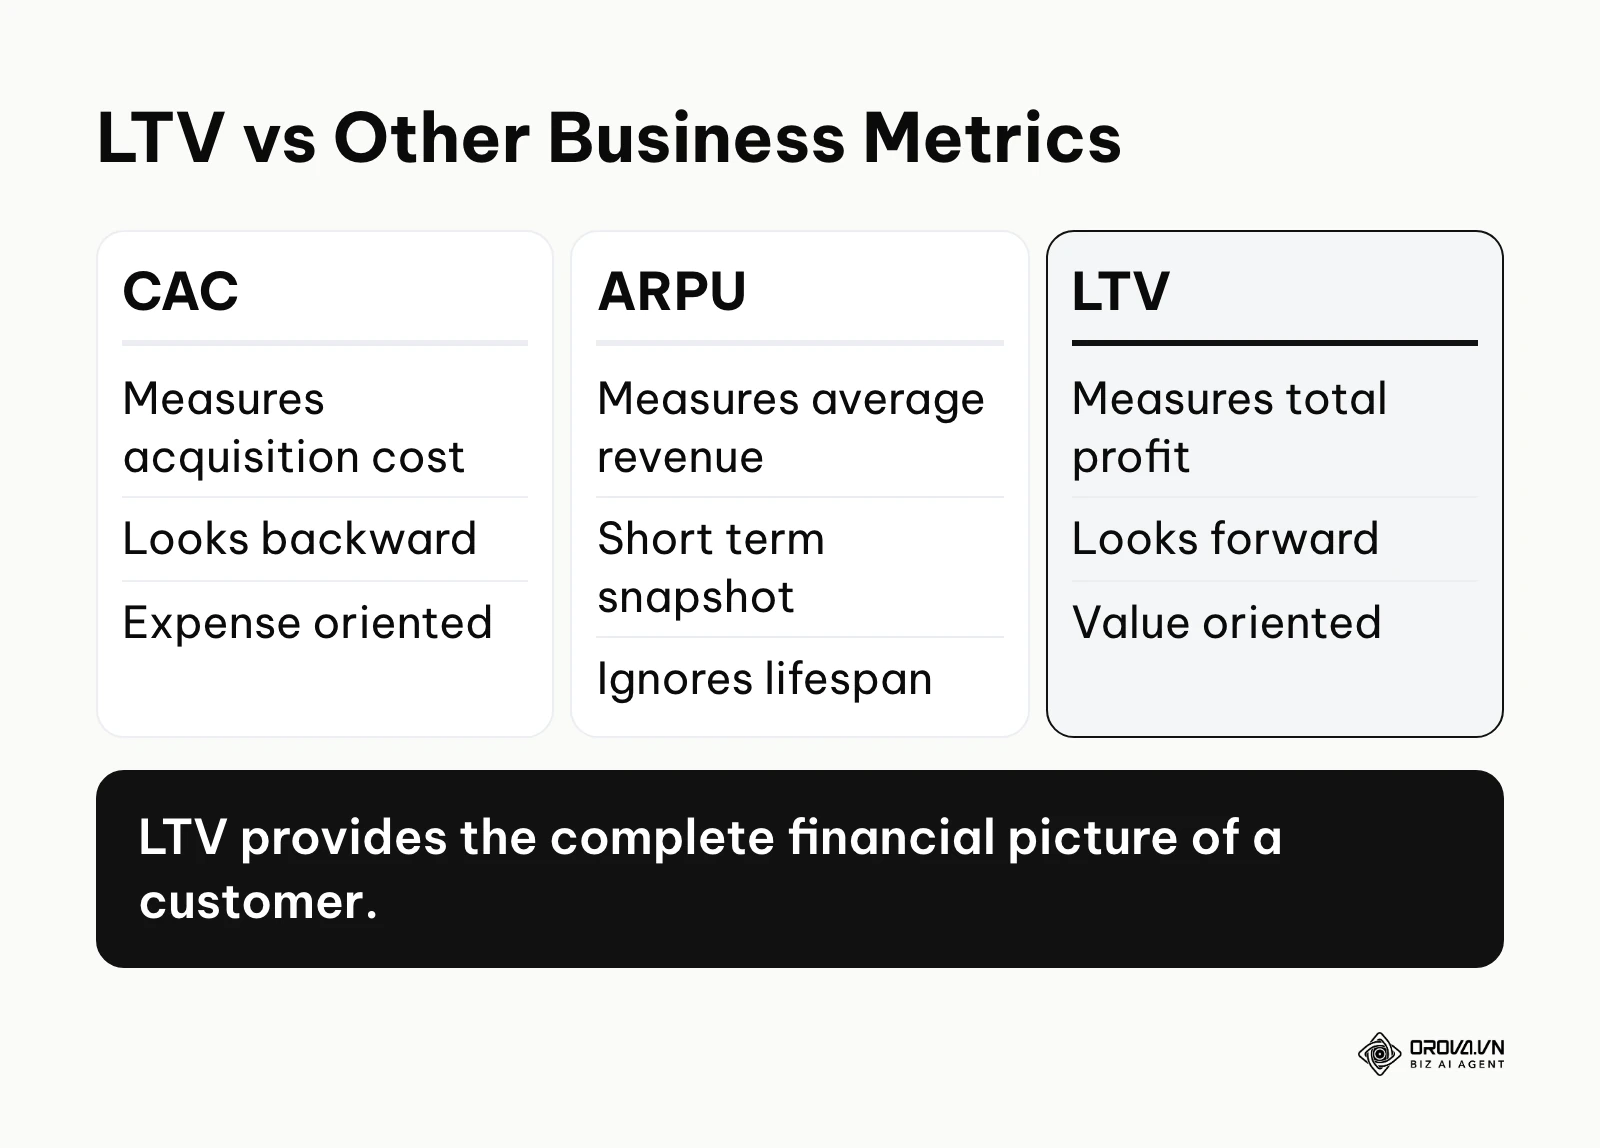
The concept originated in the direct marketing industry during the late twentieth century, where catalog companies needed to know how many mailers they could send to a household before the postage costs outweighed the average purchase returns. Today, it serves as the financial backbone for modern digital businesses.
To understand this concept clearly, we must separate it from other common metrics that often cause confusion.
| Concept | How it differs | Example use case |
|---|---|---|
| Customer Acquisition Cost | Measures the expense of getting a user, not the return. | Evaluating a recent advertising campaign. |
| Average Revenue Per User | Looks at a short snapshot of gross income, ignoring lifespan and profit margins. | Checking monthly cash flow health. |
| Net Promoter Score | Measures sentiment and satisfaction, not actual financial contribution. | Assessing product quality and brand loyalty. |
Consider a local subscription coffee shop. If you only look at the first purchase, a customer buying a five-dollar latte seems insignificant. However, if that customer visits three times a week for two years, they bring in about 1,560 dollars of revenue (5 × 3 × 104 weeks), and even at a 60 percent gross margin that is roughly 936 dollars of profit. The model helps the owner realize they can afford to give away the first five lattes for free, knowing the long-term profit will easily cover that initial acquisition cost.
The core problem it solves
This framework exists to solve the fundamental problem of sustainable growth. Every business must answer one critical question: how much can we afford to spend to get a new buyer? If you guess this number, you risk either being too conservative and losing market share to competitors, or being too aggressive and running out of cash.
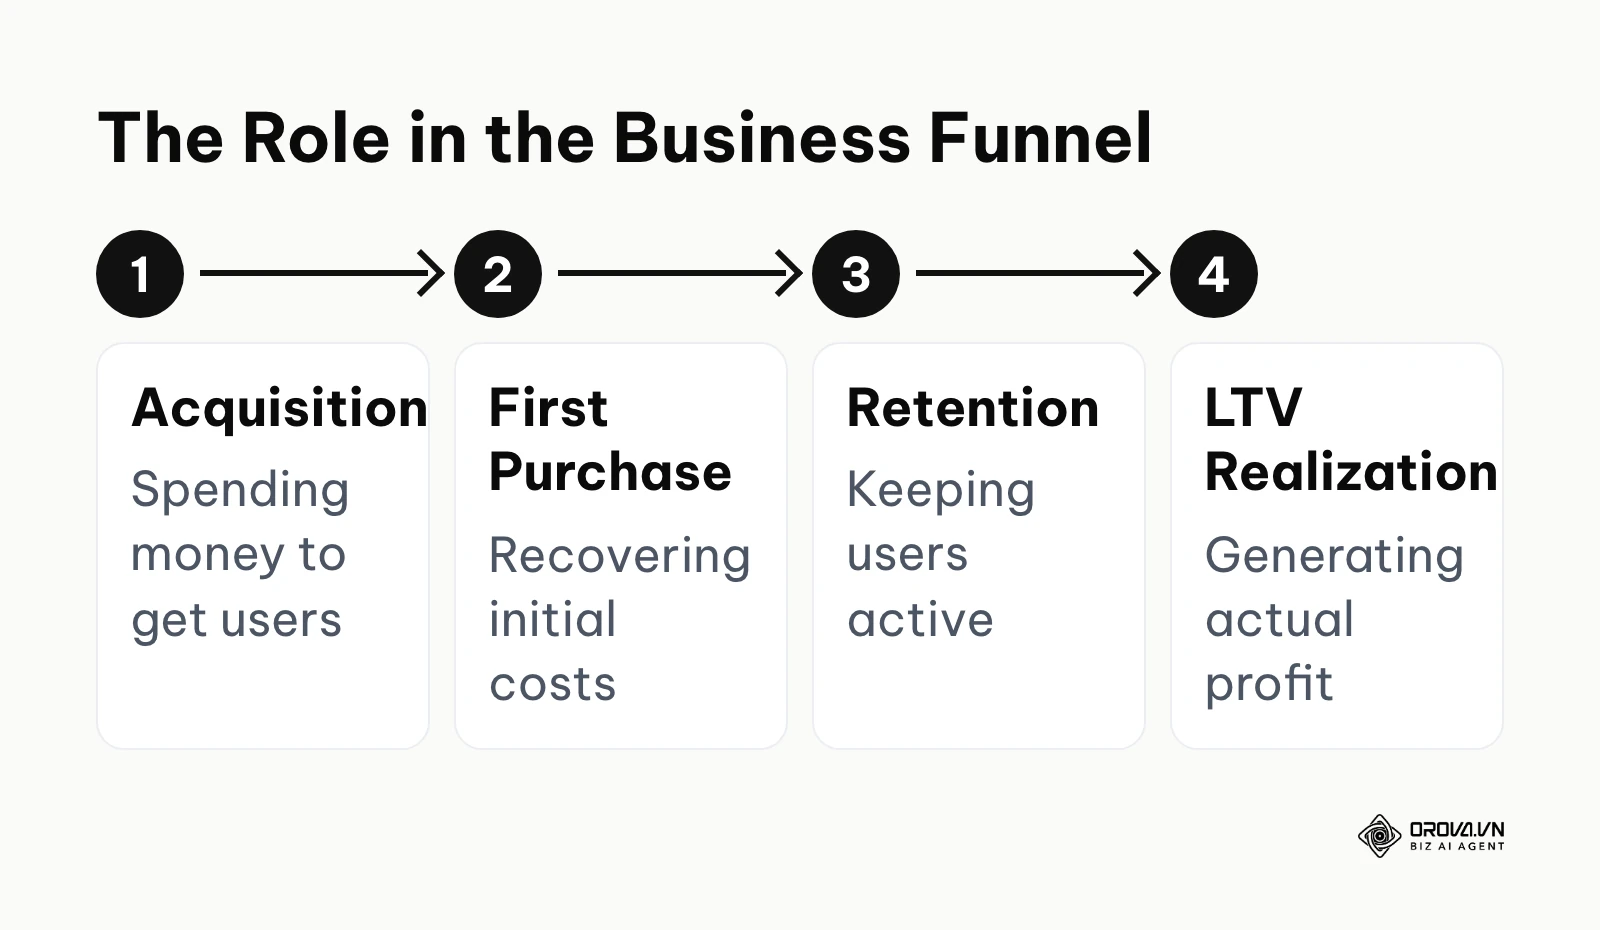
The model sits right in the middle of your financial planning and marketing execution. Acquisition strategies dictate how you bring people in, but the lifetime value dictates your ceiling for those acquisition costs. It provides a crystal clear boundary for your marketing team.
If you ignore this framework, you lose visibility into your true profitability. You might mistakenly reward a marketing team for bringing in thousands of cheap leads who never buy a second time, while penalizing a strategy that acquires expensive leads who remain loyal for a decade. As the book Marketing Metrics by Farris et al. (2010) points out, the probability of selling to an existing customer is dramatically higher than converting a new prospect. Without a model to track this, you treat every buyer equally, wasting resources on low-tier segments.
When you do not need an ltv model: You do not need this framework if you are in the extremely early stages of prototyping a product and have zero paying users. Attempting to build a model with no historical data and no proven product-market fit is a waste of time. Furthermore, if you sell a one-off, high-ticket physical item that never requires replacement, maintenance, or accessories, tracking lifetime value is unnecessary. In these cases, focus purely on keeping your immediate acquisition costs lower than your immediate profit margin.
Business value and user benefits
Implementing this system creates distinct advantages across different layers of an organization.
Value for the business
The primary business value lies in financial risk mitigation. By knowing exactly how much profit a user generates over years, leadership can confidently secure funding, plan long-term hiring, and weather short-term economic downturns. It shifts the company perspective from hunting for quick sales to building lasting assets. Furthermore, it directly impacts valuation. Investors do not just buy a product; they buy a predictable stream of future cash flows.
Benefits for the practitioner
For the people doing the daily work, such as marketers and financial planners, this system removes the anxiety of arbitrary budget limits. When a marketer can prove that a specific campaign brings in users worth ten times their acquisition cost, they can confidently request budget increases. It turns marketing from a perceived expense department into a measurable revenue generator. It also gives a cleaner input for marketing ROI calculations, because the return side is measured in profit that stays in the business rather than in sales that are partly spent again on delivery.
| Benefit | Measured by | Time to see results |
|---|---|---|
| Confident budget scaling | Return on Ad Spend | One to three months |
| Better customer targeting | Segment profitability variance | Three to six months |
| Improved retention focus | Churn rate reduction | Six to twelve months |
Illustrative example: A mid-sized software company struggled to justify their advertising budget. They noticed their acquisition costs were rising. The marketing lead mapped out the average lifespan of their enterprise clients compared to small businesses. They adjusted their bidding strategy to ignore small businesses and focus entirely on enterprise leads. Initially, the cost per lead tripled, causing panic among the executives. However, the marketer held firm, showing that the enterprise leads stayed five times longer. By the end of the year, the company saw a massive increase in actual profit, even with fewer total leads, proving the value of quality over quantity.
OROVA ADS applies AI Agent to automate and optimize ad performance on Google, Meta and TikTok. Scale your budget safely, monitor 24/7 and expand your business quickly.
Experience the solution at orova.vn/ads
How an ltv model actually works
Building an accurate system requires breaking down customer behavior into measurable components. This is the longest and most critical part of the process, as small mathematical errors here multiply over time.
Profit margin vs Revenue trap
The most dangerous mistake companies make is building a revenue-based calculation. If a user spends one hundred dollars a year for three years, their revenue value is three hundred dollars. If a company uses this number to justify spending up to two hundred dollars to acquire them, it loses money on every customer it wins.
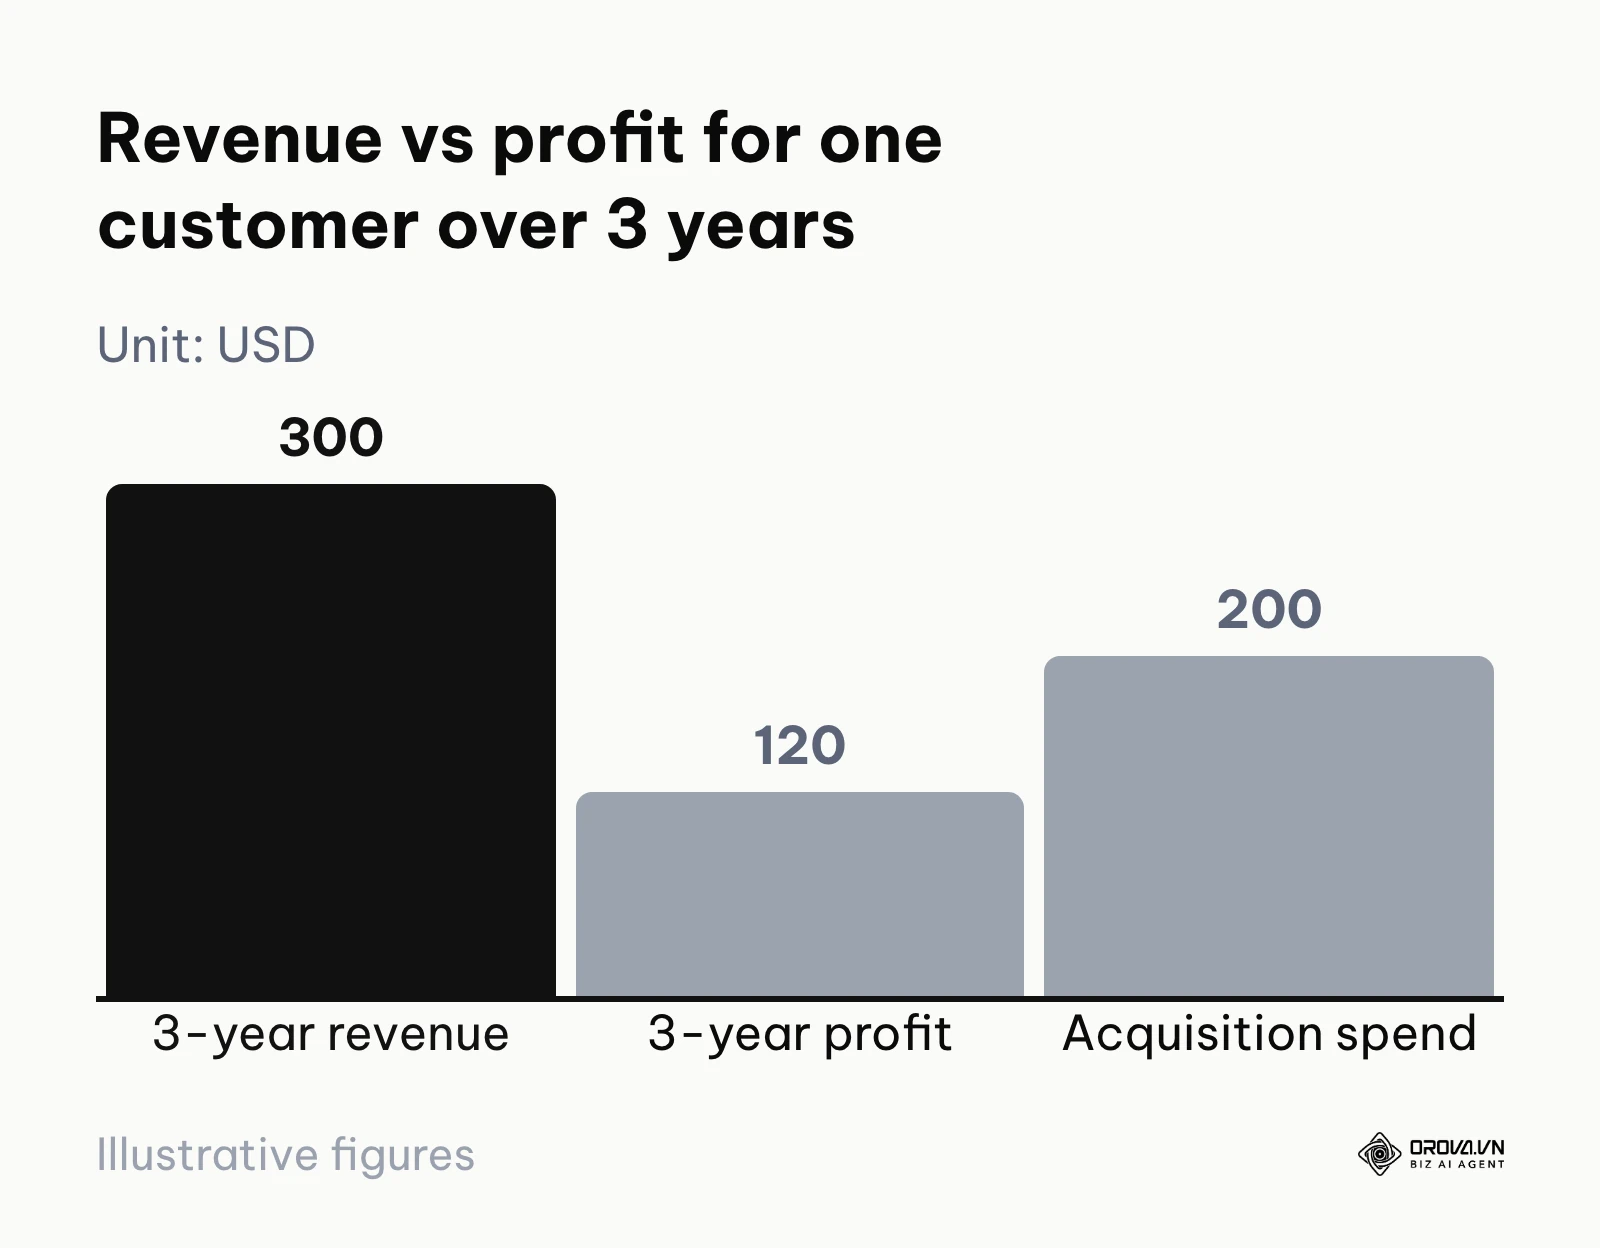
Revenue is not yours to keep. You must factor in the Gross Margin. Businesses that subtract variable costs before setting acquisition targets are far less likely to overspend on ads. If the product costs sixty dollars to manufacture, ship, and support, your profit margin is forty percent. Therefore, the true value of that customer is only one hundred and twenty dollars, and paying two hundred dollars to acquire them means losing eighty dollars per customer. Furthermore, you must apply a discount rate, which accounts for the fact that a dollar earned three years from now is worth less than a dollar today due to inflation and opportunity costs.
The profit-based LTV formula, step by step
The calculation becomes much easier when you build it in three layers: annual gross profit, lifespan, and discounting. Take one example customer and follow the same numbers all the way through.
Step 1, annual gross profit. Multiply Average Order Value by the number of orders per year, then by the gross margin. A customer who spends 100 dollars per order, orders 5 times a year, at a 40 percent margin produces 100 × 5 × 0.40 = 200 dollars of gross profit per year. Their revenue is 500 dollars a year, but only 200 dollars of it is yours to spend.
Step 2, simple lifetime value. Multiply annual gross profit by the expected lifespan in years. If this customer typically stays for 3 years, the simple profit-based value is 200 × 3 = 600 dollars. A revenue-based model would have reported 500 × 3 = 1,500 dollars, two and a half times too high.
Step 3, discounting. Money received later is worth less today, so each year's profit is divided by (1 + discount rate) raised to the number of years you wait for it. With a 10 percent discount rate:
| Year | Gross profit | Discount factor | Value today |
|---|---|---|---|
| 1 | 200 dollars | 1.10 | 181.82 dollars |
| 2 | 200 dollars | 1.21 | 165.29 dollars |
| 3 | 200 dollars | 1.331 | 150.26 dollars |
| Total | 600 dollars | 497.37 dollars |
The discounted lifetime value is therefore about 497 dollars, not 600 and certainly not 1,500. Note that the discount applies year by year; dividing the whole three-year total once by 1.10 would overstate the result.
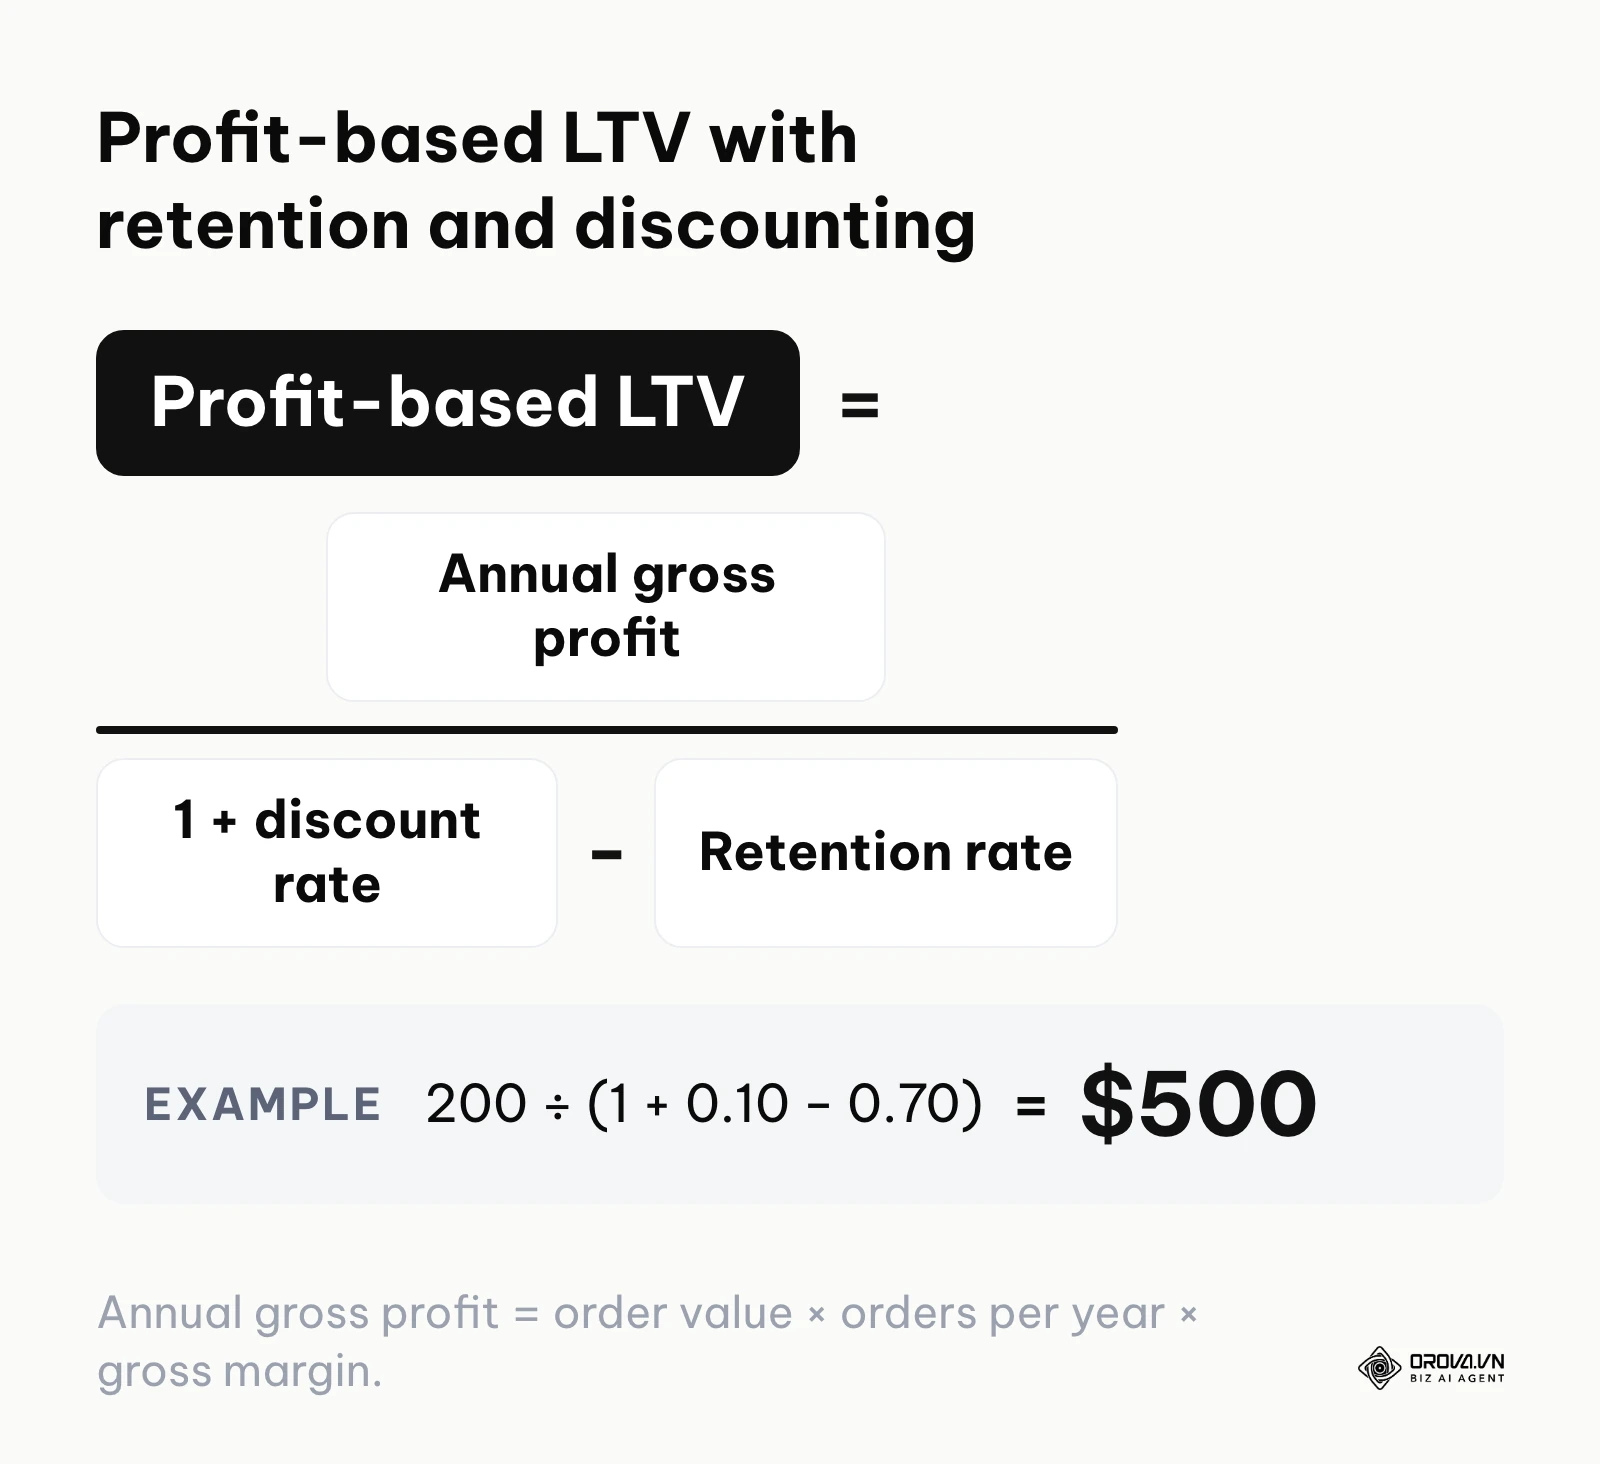
Step 4, using a retention rate instead of a fixed lifespan. Most businesses do not know exactly how long customers stay, but they do know what share of customers come back each year. If r is the annual retention rate and d the discount rate, and profit arrives at the end of each year, the lifetime value is annual gross profit ÷ (1 + d − r). With 70 percent retention and a 10 percent discount rate, that is 200 ÷ (1 + 0.10 − 0.70) = 200 ÷ 0.40 = 500 dollars. A 70 percent retention rate implies an average lifespan of about 1 ÷ (1 − 0.70) ≈ 3.3 years, so the two methods land close to each other, which is a useful sanity check.
B2B SaaS model
In Business-to-Business Software as a Service, the calculations rely heavily on cohorts and recurring revenue.
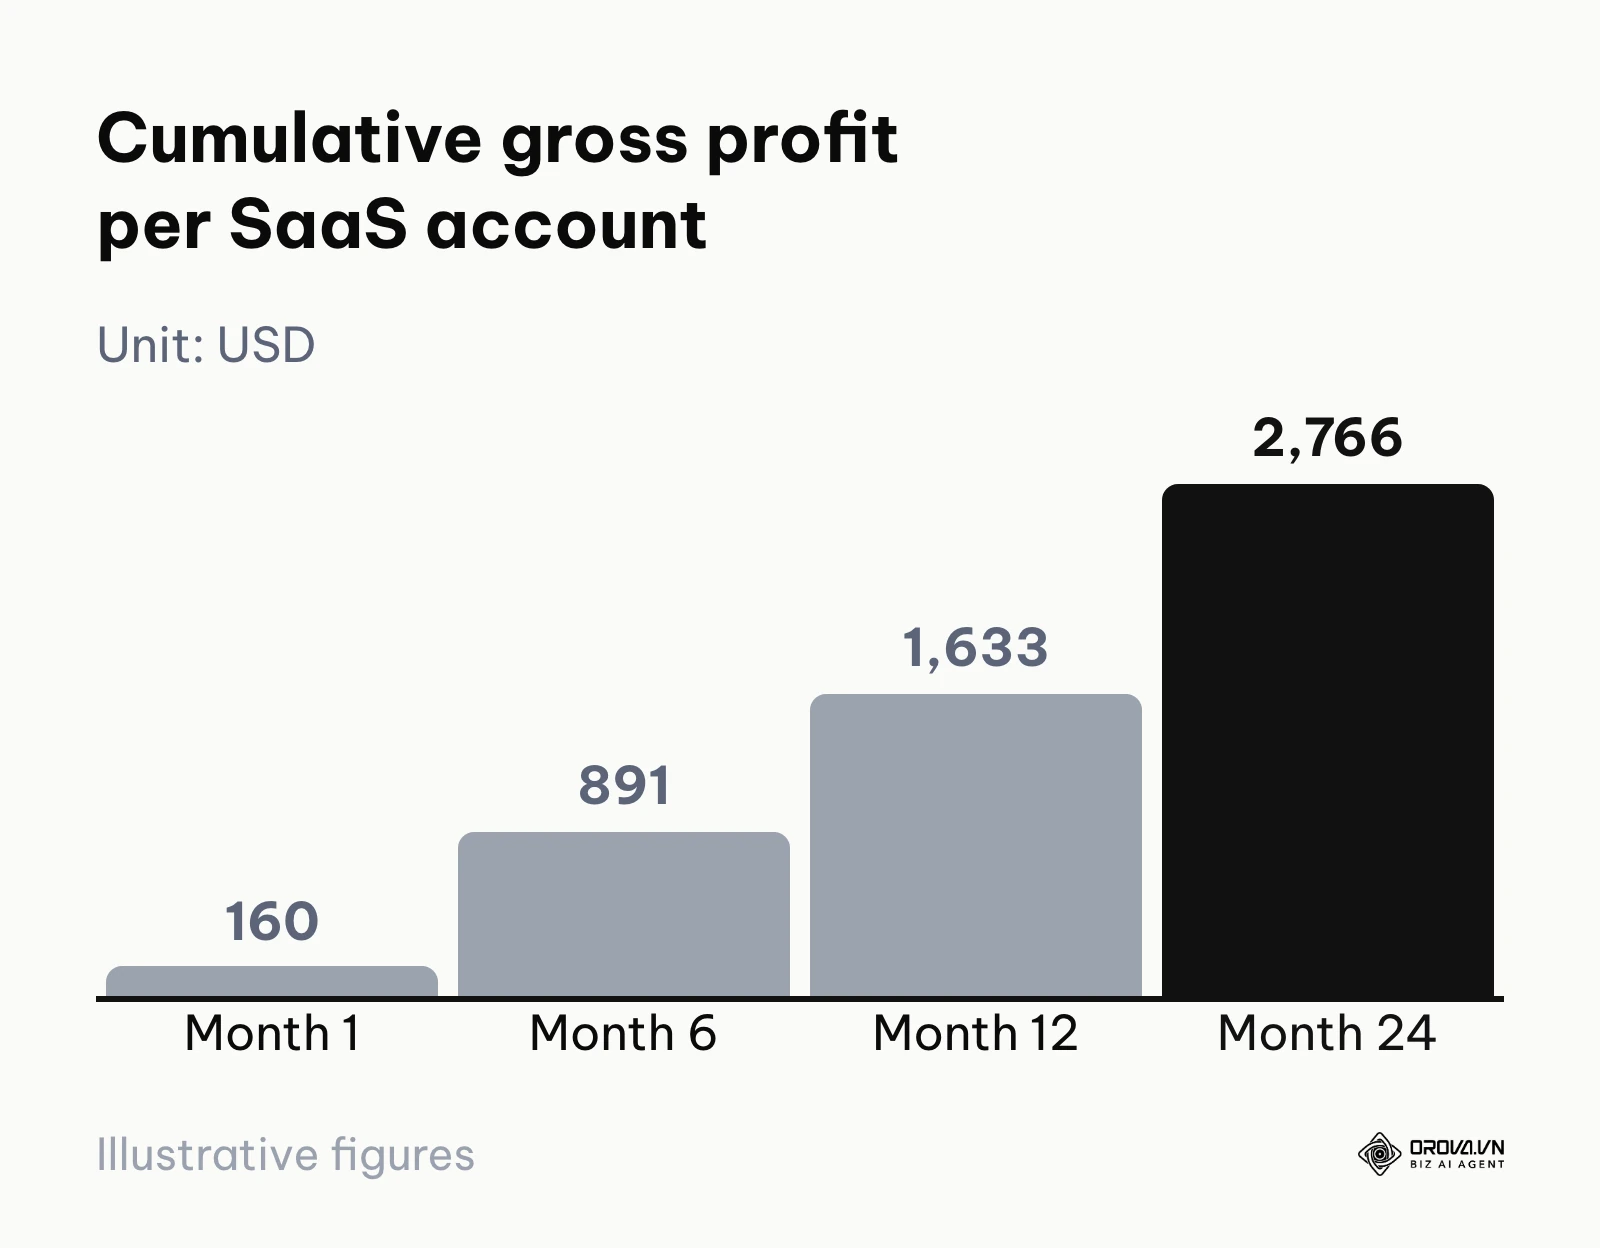
The inputs here are the Monthly Recurring Revenue, the gross margin (which is usually high, around eighty percent), and the churn rate. The output is a highly predictable curve showing exactly when a customer becomes profitable.
Because SaaS revenue is billed monthly, the standard shortcut is LTV = (monthly revenue per account × gross margin) ÷ monthly churn rate. Dividing by churn works because 1 ÷ churn is the average number of months an account stays. Take an account paying 200 dollars a month at an 80 percent gross margin with 3 percent monthly churn: the monthly gross profit is 160 dollars, and the lifetime value is 160 ÷ 0.03 ≈ 5,333 dollars. Using revenue instead of profit would have produced 200 ÷ 0.03 ≈ 6,667 dollars, an overstatement of 25 percent.
The value does not arrive all at once. Because a small share of accounts leaves every month, the expected cumulative gross profit per account is about 160 dollars after month 1, 891 dollars after month 6, 1,633 dollars after month 12, and 2,766 dollars after month 24, slowly approaching the 5,333 dollar ceiling. This curve tells you how long you wait to earn back acquisition spend. If acquiring an account costs 1,500 dollars, you recover it in roughly ten to eleven months, which is exactly the question a CAC payback period analysis answers in more depth.
The breakdown often happens when companies fail to account for customer success costs. If an enterprise client pays two thousand dollars a month, but requires forty hours of dedicated support time, their true margin is significantly lower than a self-serve user paying fifty dollars a month.
D2C Ecommerce model
Direct-to-Consumer physical goods require a completely different approach. Here, revenue is transactional, not guaranteed monthly.
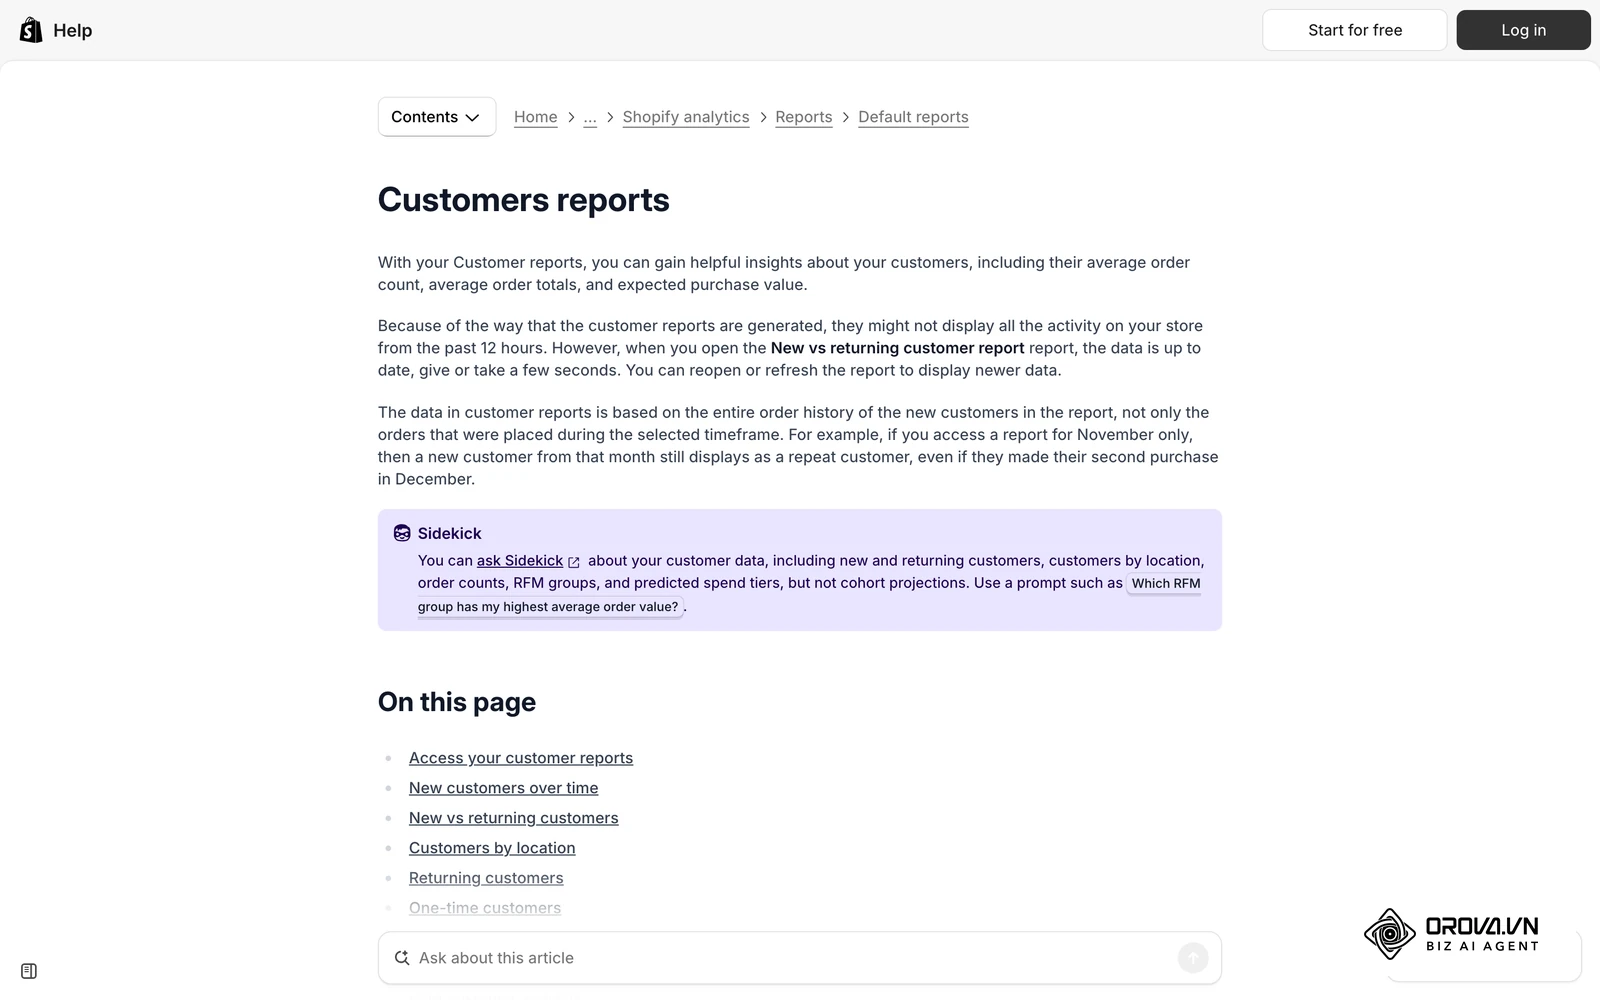
The vital inputs are the Average Order Value, the Purchase Frequency (how many times they buy per year), and the physical Cost of Goods Sold. The output tells you how much you can spend on retargeting ads or email marketing to secure that second or third purchase.
The most common point of failure in D2C is ignoring fulfillment and shipping fluctuations. A sudden increase in shipping rates can instantly destroy the profitability of an entire segment if the model is not dynamically updated. For example, a store with a 60 dollar average order, 3 orders per year and 39 dollars of product, packing and shipping cost per order keeps 21 dollars per order, or 63 dollars per year. If shipping rises by 6 dollars per order, profit per order falls to 15 dollars and annual profit to 45 dollars, a drop of about 29 percent, while revenue in the dashboard has not changed at all.
Freemium App model
Applications offering a free tier with microtransactions or ad revenue present the most complex scenario.
The inputs include advertising impressions per user, conversion rates to premium tiers, and the average lifespan before the user uninstalls the app. The output must blend the tiny fractions of a cent earned from free users viewing ads with the larger chunks of revenue from premium subscribers.
This breaks down when developers assume free users have zero cost. Free users still consume server space, customer support bandwidth, and database resources. A proper calculation assigns a negative cost to free users until their ad views cross the break-even threshold.
Types of calculations
Depending on your data maturity, you will use different variations of this framework.
| Type | Characteristics | Best suited for |
|---|---|---|
| Historical | Averages past data without forecasting. Simple but backward-looking. | Companies with years of stable, unchanging data. |
| Predictive | Uses machine learning to guess future behavior based on early signals. | Fast growing startups with changing user behaviors. |
| Profit-based | Deducts all variable costs from the projected revenue. | Every serious business focusing on actual cash flow. |
Illustrative example: An ecommerce clothing brand noticed their return customer rate was dropping. They built a specific model for their winter jacket buyers, tracking them over two years. They isolated the shipping costs, the return rates, and the margin on the jackets. They realized that customers who bought winter jackets almost never returned to buy summer clothes. The hurdle was cross-category friction. They stopped sending generic summer discounts to this segment, and instead targeted them with specific winter accessories the following year. This focused approach increased the segment's profitability without wasting email marketing resources.
To build this yourself without complex software, you can set up a simple spreadsheet framework. Create one row per acquisition month (cohort) with the columns below; the example row shows how the numbers connect.
| Cohort (acquisition month) | Customers acquired | Total revenue to date | Variable costs to date | Gross profit to date | Gross profit per customer | Months active | Acquisition spend per customer |
|---|---|---|---|---|---|---|---|
| January | 200 | 60,000 dollars | 36,000 dollars | 24,000 dollars | 120 dollars | 6 | 80 dollars |
Gross profit to date is total revenue minus variable costs, and gross profit per customer is that figure divided by customers acquired (24,000 ÷ 200 = 120). Compare it with acquisition spend per customer: in this example the January cohort has already earned back its 80 dollar acquisition cost after six months. Adding a new row every month gives you an immediate, ungated view of cohort profitability without any special software.
How to adapt and start
Different roles require different approaches to integrating these metrics into daily operations.
Small business owners
If you run a bootstrapped operation, keep it simple.
- Determine your average order value over the last ninety days.
- Calculate exactly what it costs to deliver that product or service, establishing your gross margin.
- Estimate how many times a satisfied customer will buy from you in a twelve-month period.
- Multiply these three numbers together (for example 80 dollars × 30 percent margin × 4 orders = 96 dollars). The result is the gross profit a customer brings in during their first year, and it is your absolute maximum acquisition budget per customer. Do not spend a penny more than this to get a new buyer.
In-house marketing leads
Marketing leaders need granular data to justify spending.
- Segment your audience by acquisition channel.
- Track the differing churn rates between users from organic search versus paid social media.
- Apply a discount rate to future projected revenues to present realistic numbers to your finance department.
- Shift your budget away from channels with the lowest long-term retention, even if their initial cost per click is attractive. For the social side of that comparison, a guide to social analytics tools helps you see which networks and posts actually bring buyers in.
Agency partners
Agencies must prove long-term value to retain their clients.
- Stop reporting exclusively on immediate Return on Ad Spend. The standard ROAS formula divides revenue by ad spend for a short window, so pair it with a profit-based lifetime view that shows what those buyers are worth over years.
- Request access to the client's historical sales data to build a predictive curve.
- Educate the client on the concept of payback periods, showing them that a higher upfront cost is acceptable if the customer remains loyal.
- Use this data to negotiate performance bonuses based on retained users rather than just immediate conversions. Setting up proper tracking is vital here, which you can learn more about in this click tracking workflow.
Common implementation hurdles
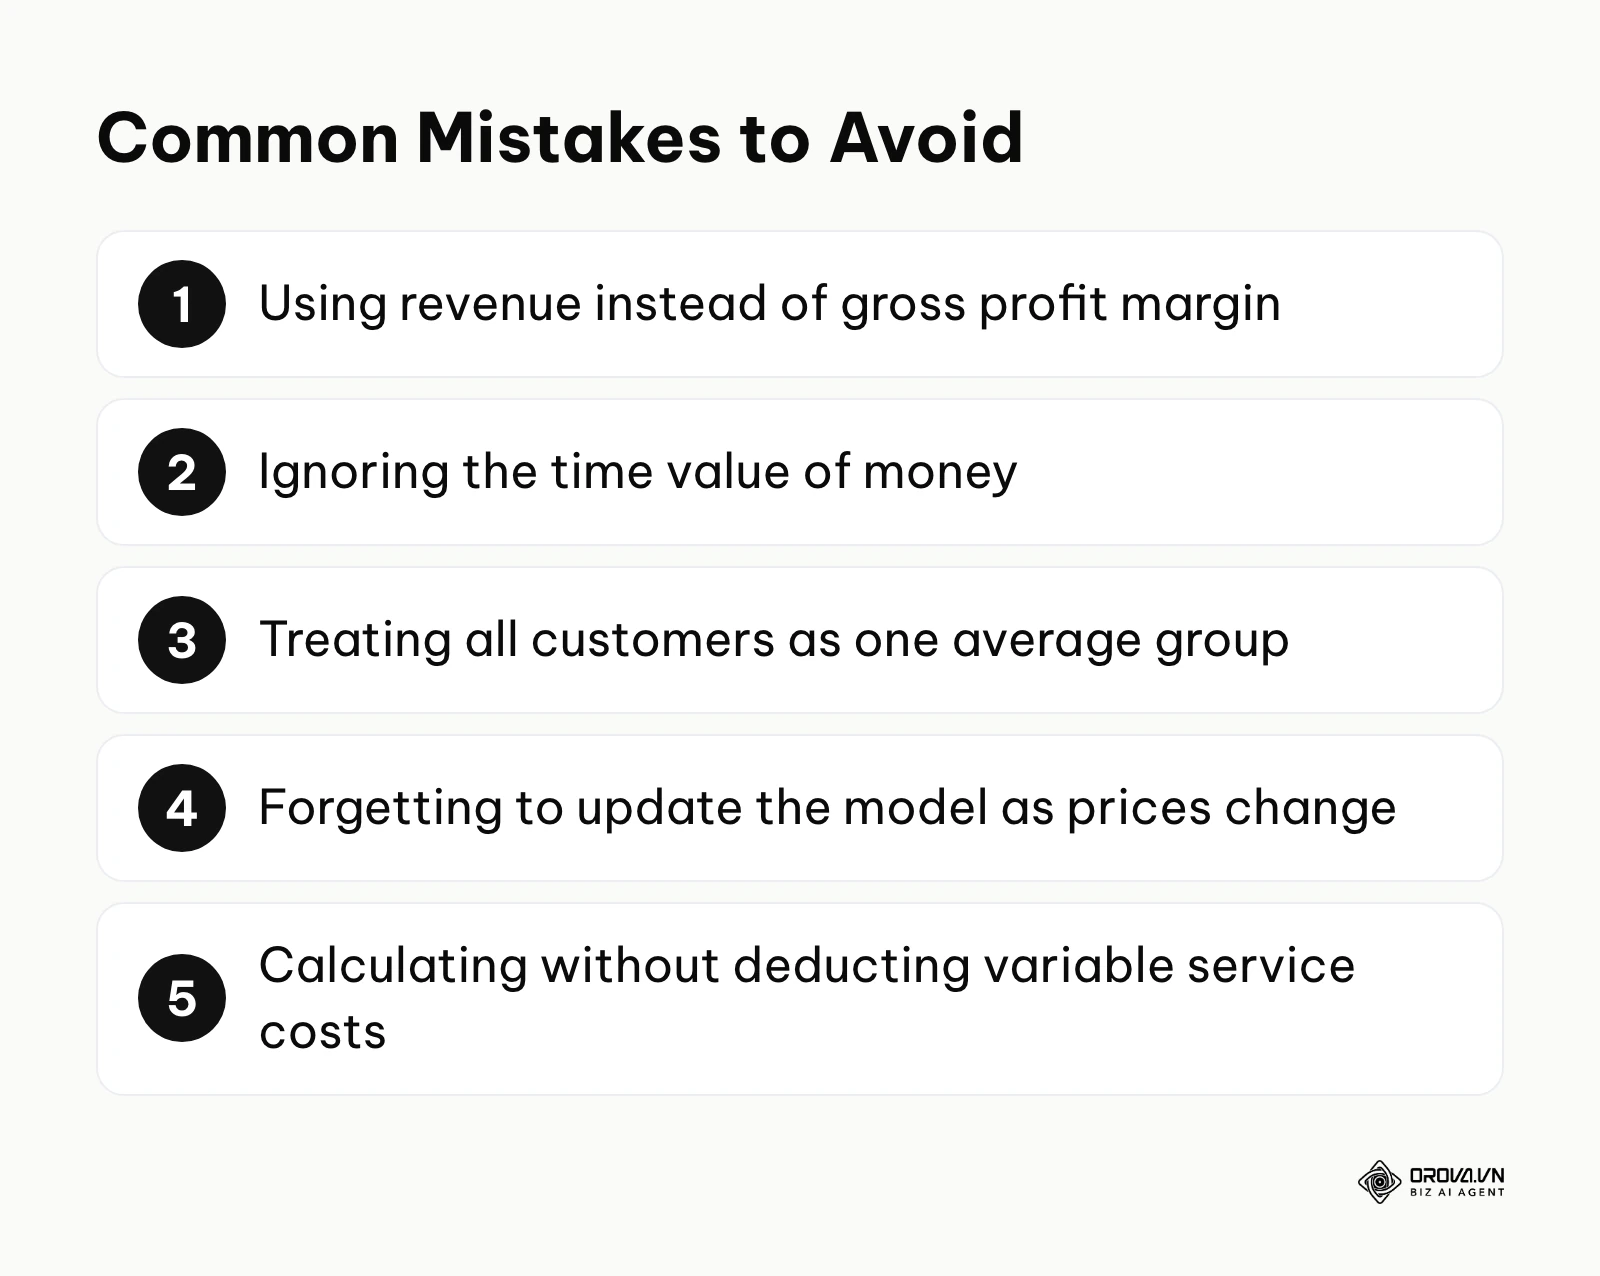
| Mistake | Consequence | How to avoid |
|---|---|---|
| Relying on top-line revenue | Burning cash by overspending on acquisition | Always multiply by your gross margin percentage. |
| Averaging the entire database | Missing high-value niche segments | Group users by behavior, location, or product purchased. |
| Static calculations | Operating on outdated numbers during inflation | Update your cost of goods sold and shipping rates quarterly. |
An LTV growth matrix: which lever to pull first
Once the model is in place, the next question is how to raise the number. Every lever maps to one input of the formula, and they differ a lot in effort.
| Lever | Formula input it moves | Effort | Typical first action |
|---|---|---|---|
| Stop buying unprofitable segments | Average value across new customers | Low | Cut bids on channels whose cohorts never earn back acquisition spend |
| Raise average order value | Average Order Value | Low | Bundles and add-ons offered at checkout |
| Increase purchase frequency | Orders per year | Medium | Replenishment reminders timed to when the product runs out |
| Protect gross margin | Gross margin | Medium | Review shipping, packaging and support cost per customer every quarter |
| Improve retention | Retention rate or churn | High | Fix the onboarding steps where most new customers drop off |
To see which lever matters most for you, run a quick sensitivity test on your own formula. In the example from the step-by-step section, raising retention from 70 to 75 percent lifts the value from 500 to about 571 dollars (200 ÷ 0.35), while raising gross margin from 40 to 45 percent lifts annual profit to 225 dollars and the value to about 563 dollars (225 ÷ 0.40). The two moves are similar at this level, but retention gains compound: at 80 percent retention the value reaches about 667 dollars (200 ÷ 0.30). Start with the low-effort rows to fund the high-effort ones.
Want to scale your budget but afraid of breaking performance? 📉
Integrate OROVA ADS now - an AI Agent that automatically monitors and optimizes Google, Meta, TikTok ads 24/7. Now, expanding and replicating your Performance Ads team is just one click away.
🚀 Try it now at: orova.vn/ads
Trends in the next few years: author's perspective
As the digital landscape shifts towards stricter privacy controls and more complex user journeys, the way we calculate and use these metrics must evolve.
Artificial intelligence integration
I believe manual spreadsheet calculations for lifetime value will gradually give way to models that read raw transaction logs and group users into dynamic cohorts on their own. Predictive lifetime value, estimated from a user's behaviour in their first few days, is already offered in some analytics and app marketing tools. This means marketers will not have to wait a year to see if a cohort is profitable; the AI will project the curve instantly. You should prepare by ensuring all your customer touchpoints are tracked and stored in a clean, centralized database right now.
The death of the blended average
I suspect that relying on a single, company-wide average value will increasingly be seen by finance teams as a blind spot. The gap between casual buyers and loyal advocates is widening. Treating them as a single blended number hides both the risks of the bottom tier and the potential of the top tier. Businesses will need to build entirely separate financial models for their top ten percent of users versus the bottom ninety percent. You must start tagging your highest spenders today to begin building these isolated data sets.
Privacy restrictions forcing predictive models
With browser tracking limits, consent requirements and stricter data privacy laws, tracking an individual user over five years is becoming harder. I lean toward the conclusion that historical tracking will become less reliable. Instead, companies will have to rely on probabilistic models. This means looking at anonymized, aggregated behavior patterns and statistically predicting value, rather than tracking individual receipts. To prepare, you need to shift your focus from tracking exact individuals to analyzing broad cohort trends and contextual signals.
Frequently asked questions
What is a safe ratio between lifetime value and acquisition cost?
A widely used rule of thumb, especially in subscription software, is a ratio of three to one. When lifetime value is measured in gross profit, this means you earn three dollars of profit for every one dollar spent to acquire the user. A ratio of one to one means you are only breaking even on acquisition, with nothing left for overheads or growth. A ratio of five to one might seem excellent, but it can indicate you are under-spending on marketing and leaving room for competitors. Businesses that get paid in full on the first order can sometimes accept a lower ratio, because the cash comes back faster; check it together with your payback period rather than on its own.
How do we estimate this for a new startup with no data?
You cannot calculate an exact number without history, but you can build a proxy. Look at the financial disclosures of publicly traded competitors in your exact niche. Use their churn rates and gross margins as your baseline. Then, heavily discount these numbers because your startup will not have their brand loyalty or operational efficiency. Assume your churn will be twice as high and your margins twenty percent lower until you have six months of your own actual data to prove otherwise.
How should we allocate budget based on these predictive models?
Your budget allocation must mirror your segment profitability. If your data shows that users from organic search have a lifetime value three times higher than users from display ads, your budget should shift drastically toward search engine optimization. Do not allocate budget evenly across channels. Starve the low-performing segments to feed the high-performing ones. For a deeper look at distributing resources effectively, consider reading this ppc ad management deep dive.
Do we still need an ltv model when we have AI?
Absolutely. AI is excellent at finding patterns and optimizing bids, but it needs a goal. If you tell an AI to maximize revenue, it will acquire thousands of cheap, low-margin users. You must build the mathematical framework to determine your true profit margins and constraints. The AI is the engine that drives the car, but your profit-based model is the map that prevents the AI from driving you off a financial cliff. You define the value; the AI finds the users. Structuring this data properly is crucial, much like building a solid marketing report foundation.
Where to start?
Jumping straight into complex machine learning predictions will paralyze your team. Your first step depends entirely on the current state of your data infrastructure.
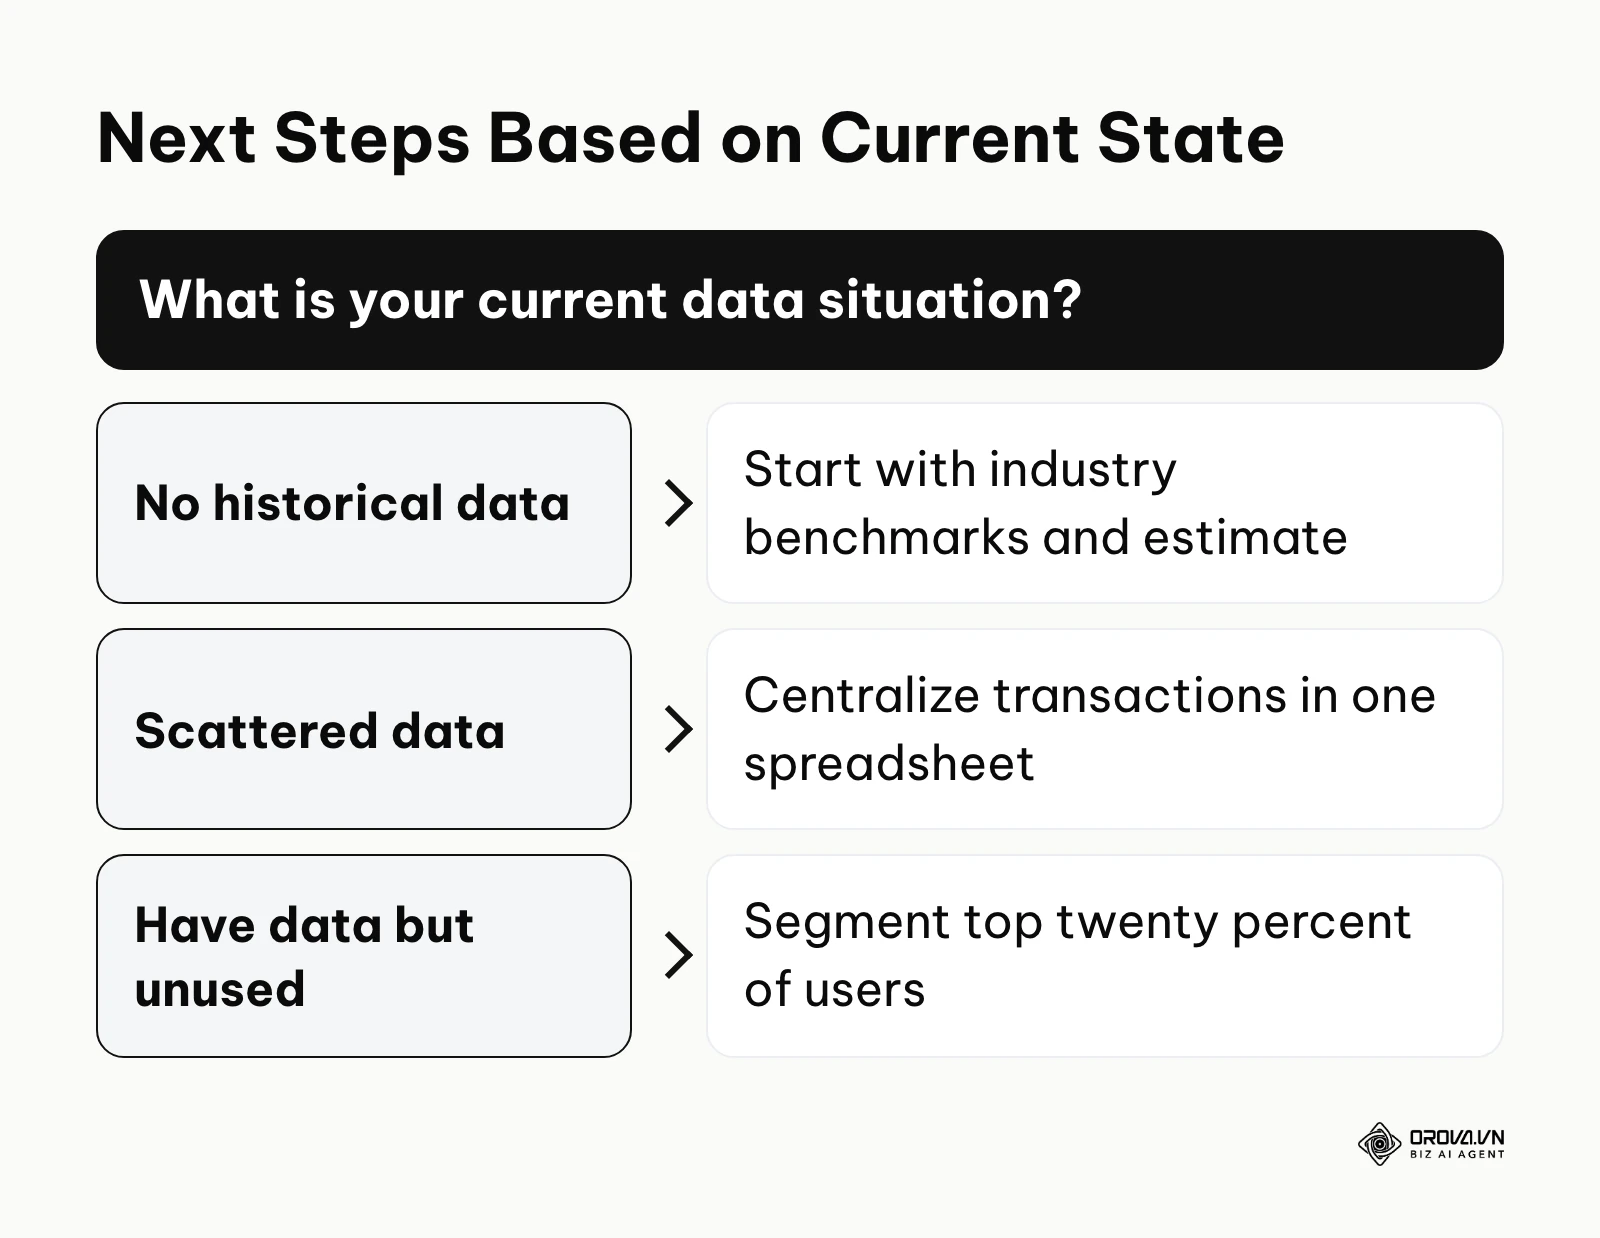
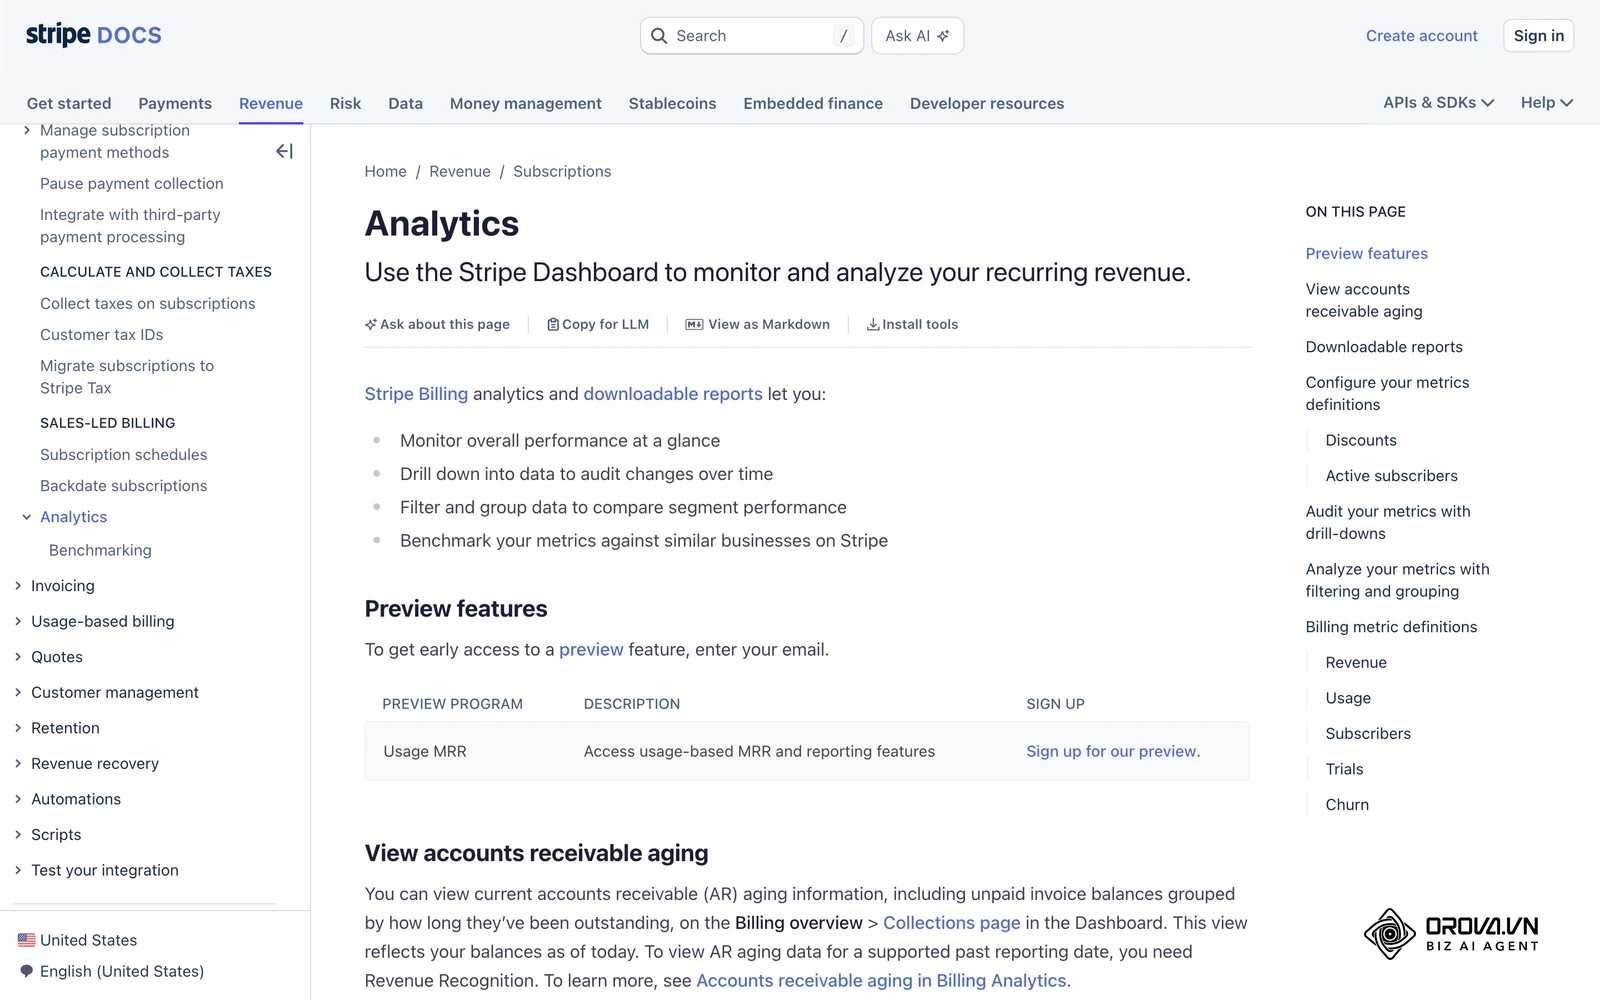
If you have absolutely nothing, do not try to build a forecasting matrix. Your only step this week is to find your average order value and subtract your average delivery cost. Write that single number on a whiteboard. That is your temporary ceiling for customer acquisition. It is crude, but it stops immediate financial bleeding while you build a better system.
If you have data but it is scattered across different platforms, your single goal is consolidation. Export your Shopify sales, your Stripe subscriptions, and your Google Ads spend into a single spreadsheet. You cannot calculate profitability if the cost data and the revenue data live in different departments. Spend one afternoon matching email addresses from your payment gateway to your marketing CRM.
If you are already tracking basic revenue but not measuring true profit, your next step is segmentation. Take your top twenty percent of highest-spending users and isolate them. Calculate their specific retention rate over the last year. You will likely find that this small group accounts for the vast majority of your actual profit. Once you define this group, every marketing decision moving forward should focus on how to acquire more users that look exactly like them. Master the fundamental ltv model first, and the scalable growth will follow.
About the author

Builder of Orova
Nguyễn Đỗ Trọng Ân has 8 years of experience in marketing, including 6 years managing market development across Asia. He builds Orova, a Biz AI Agent that never sleeps: it plans, runs and optimizes work for businesses.
Run your business with AI Agents
Orova is the always-on Biz AI Agent — it plans, runs, and optimizes the work for you.
Save time, unlock productivity.