
Analytic Twitter tools: 7 best in 2026 and how to choose

Mastering analytic twitter workflows is essential for turning raw social media activity into repeatable audience growth and commercial pipeline. Choosing the wrong analytics platform wastes marketing budget on expensive API tiers or locks your historical data behind restrictive 28-day export windows. When evaluating platforms for your brand, six core criteria separate dependable measurement tools from surface-level dashboards: API stability under current platform policies, historical data retention depth, reporting automation speed, engagement calculation accuracy under algorithmic distribution, video retention granularity, and total operational cost. This guide compares seven practical X analytics solutions, audits raw data mechanics, and outlines actionable frameworks so your team can make an informed choice immediately.
Analytic twitter tools comparison: 2026 overview table
Selecting an analytics platform requires balancing native data access limitations against third-party pricing tiers. The table below compares seven prominent tools across core strengths, target users, data focus, and practical considerations as of 2026. Prices change often, so check each vendor's pricing page before you commit.
| Tool Name | Best For | Top Strength | Data Focus | Quick Verdict |
|---|---|---|---|---|
| Native X Analytics | Solopreneurs and bootstrapped creators | Direct first-party data with zero setup | Your own posts and account | Essential baseline for raw metrics; history and export depend on your account tier |
| Sprout Social | Mid-market and enterprise marketing teams | Deep cross-network reporting and listening workflows | Owned accounts plus listening | Powerful enterprise governance, priced per seat |
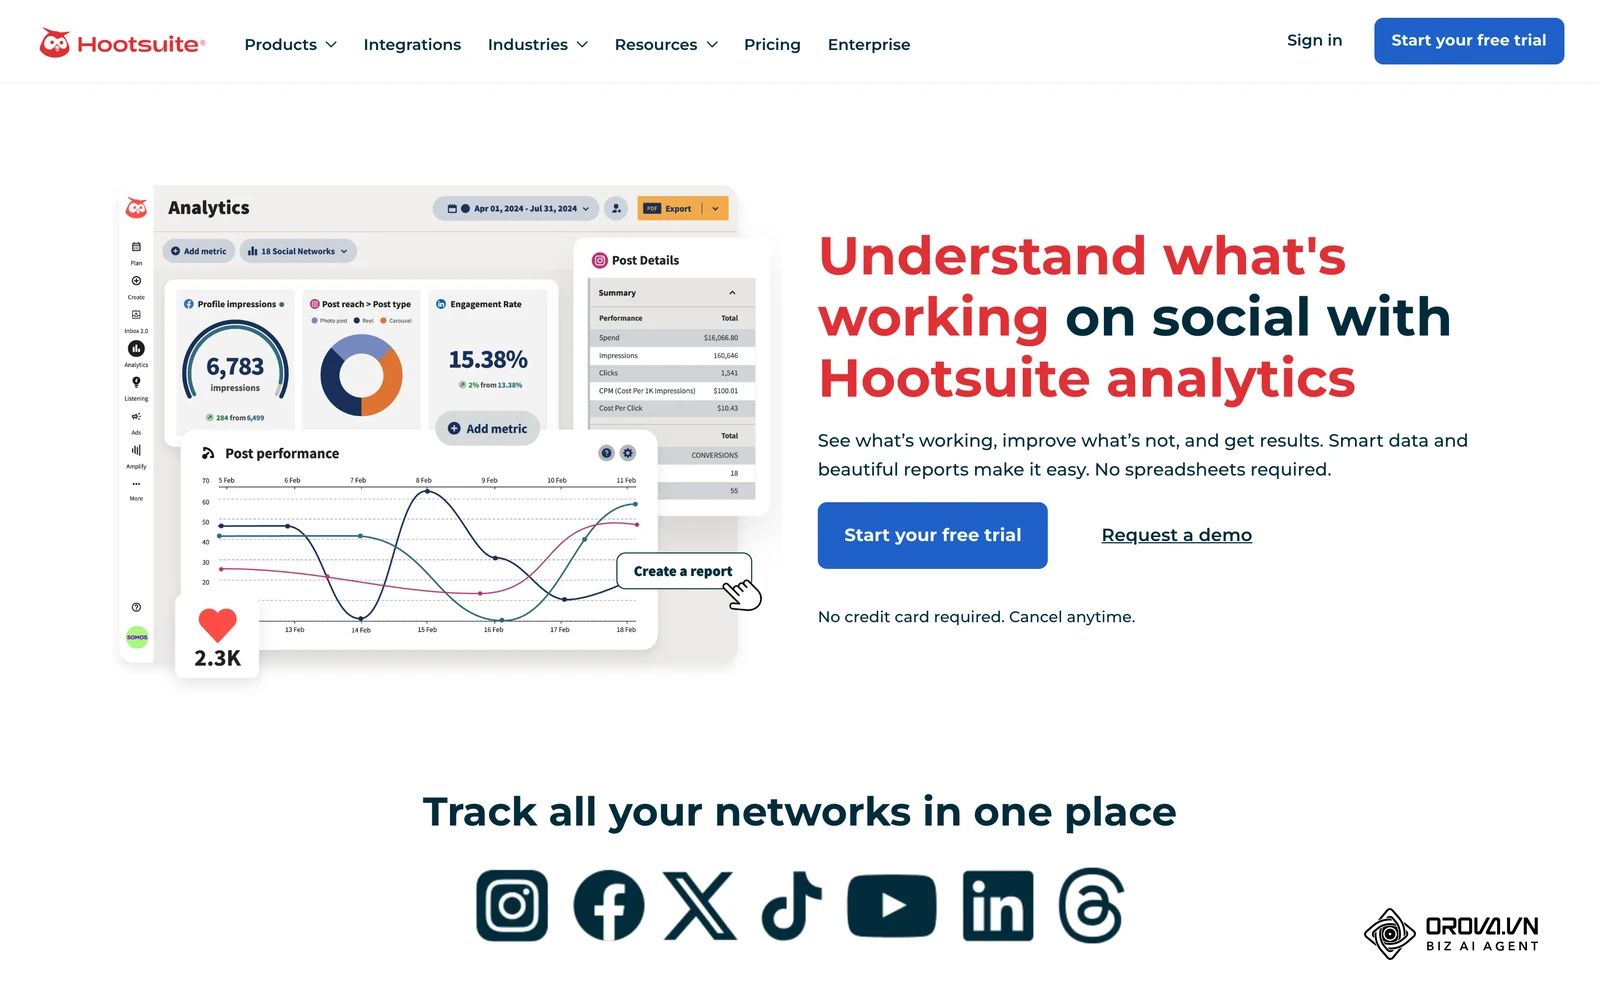
| Hootsuite | Multi-platform social teams | Cross-channel scheduling and unified reporting | Owned accounts across networks | Mature scheduler with capable multi-network aggregation |
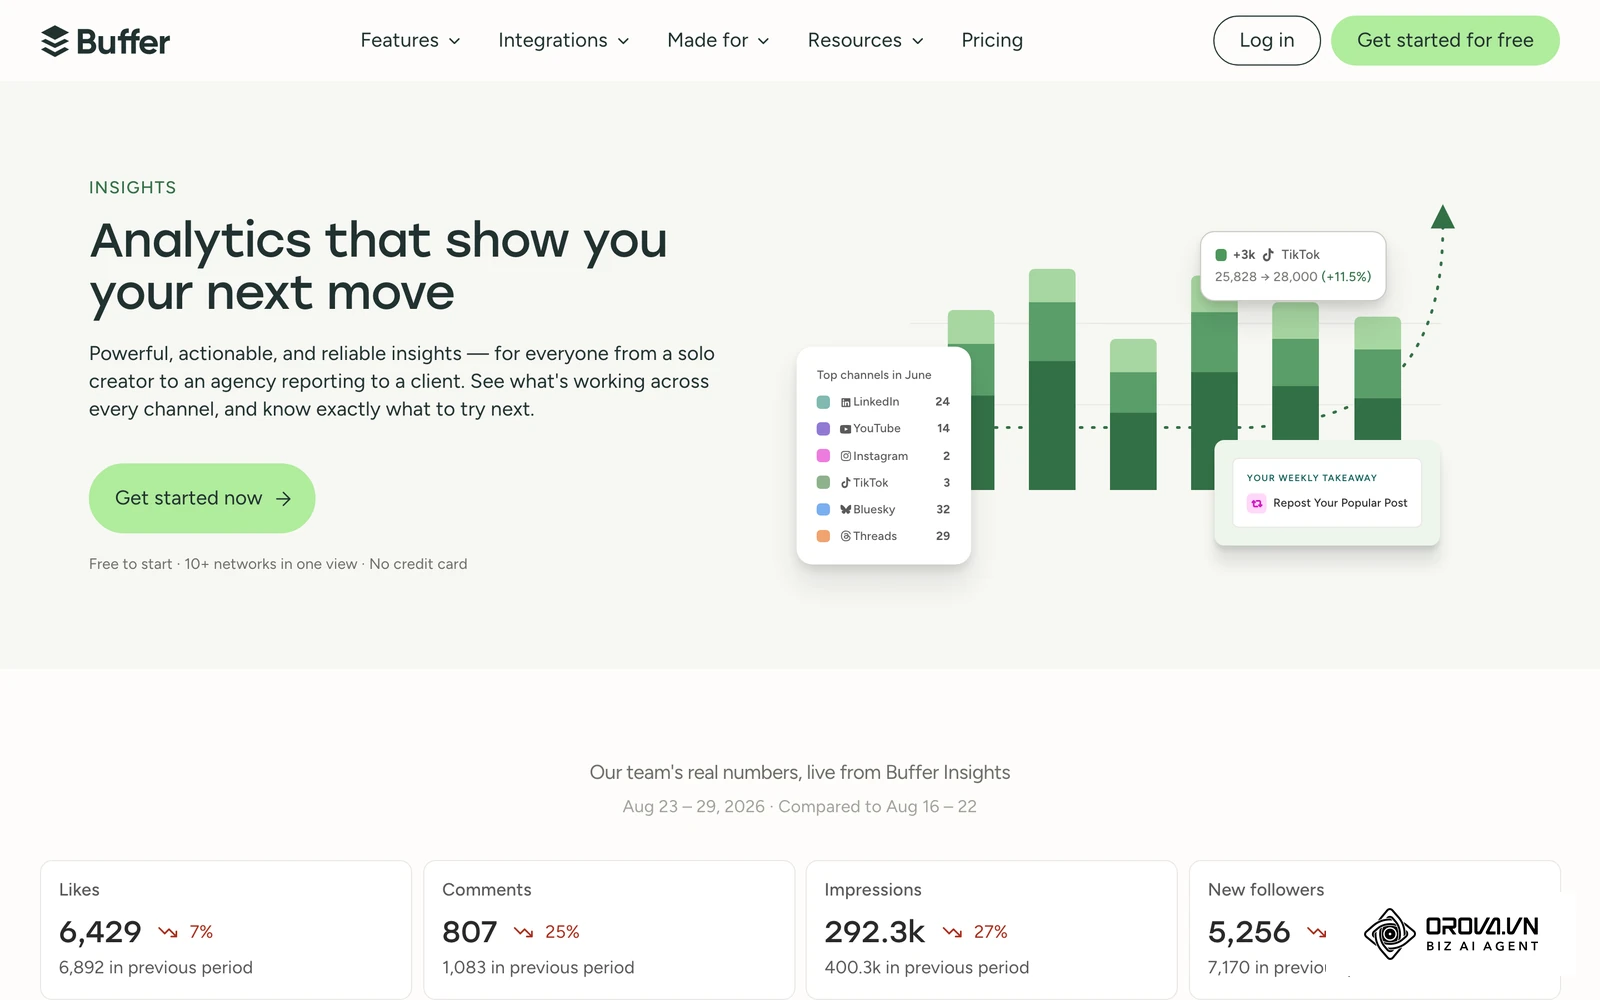
| Buffer | Individual creators and small businesses | Clean interface and straightforward post-level metrics | Owned accounts | Low-friction entry point for essential publishing numbers |
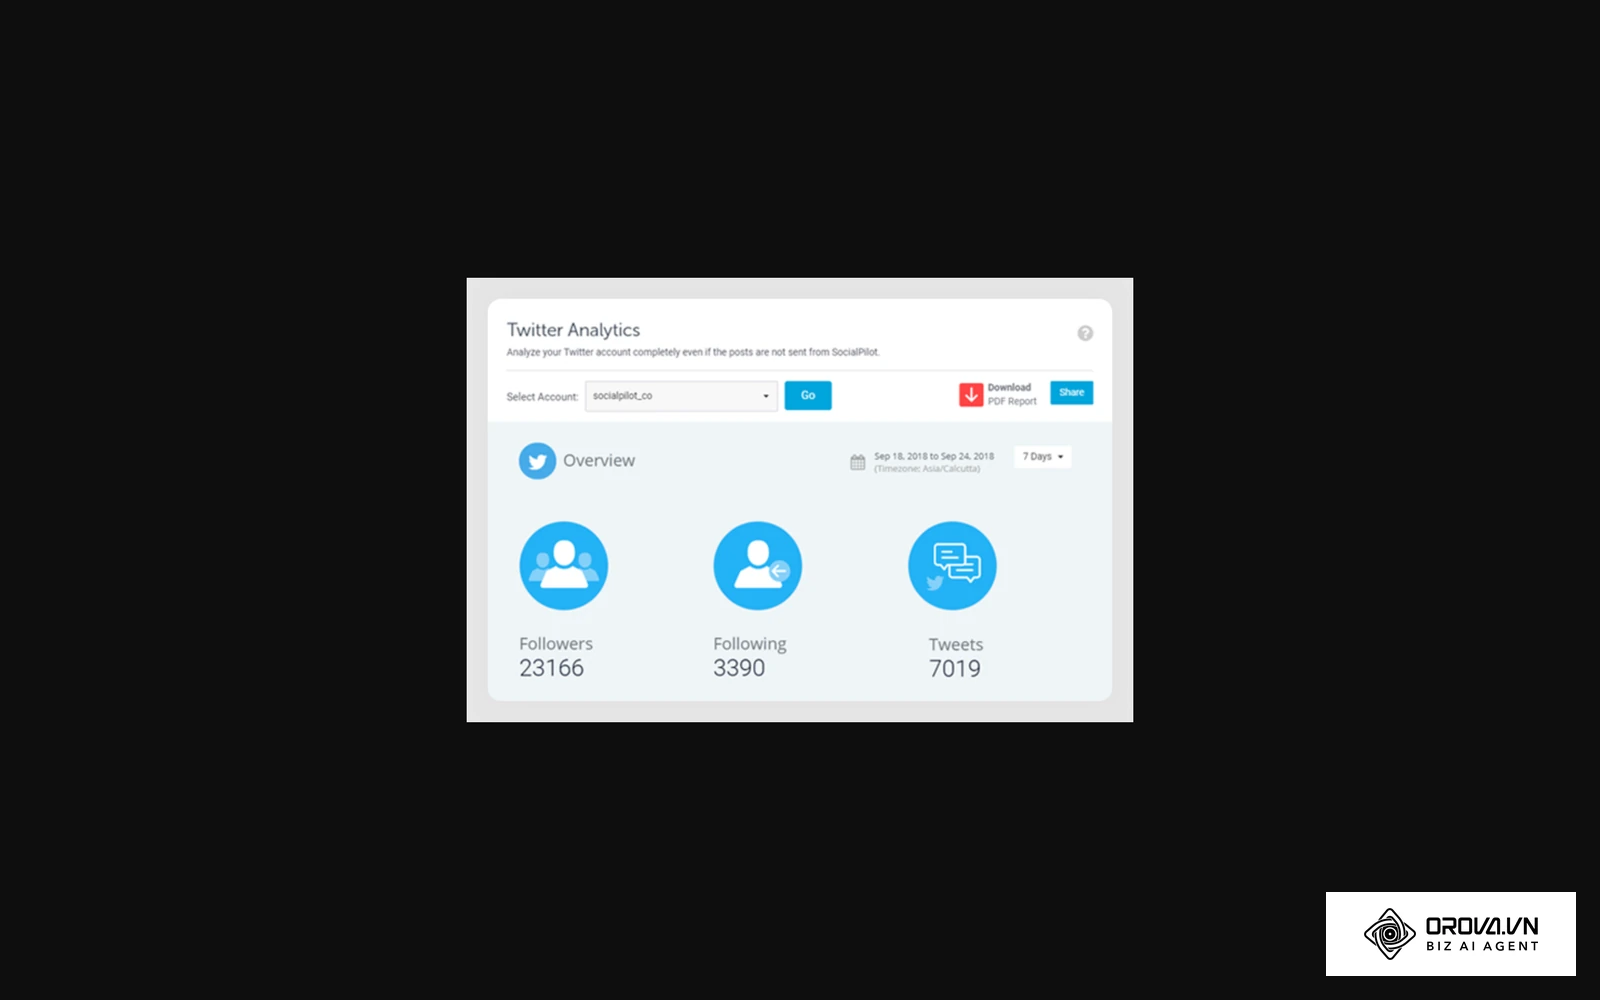
| SocialPilot | Digital agencies managing multiple client brands | Multi-account reporting and client white-labeling | Client accounts at volume | Strong account-to-cost fit for growing agencies |
| Brand24 | PR specialists and brand reputation managers | Social listening, reach estimation, and sentiment tracking | Public conversations and mentions | Qualitative conversation tracking without publishing clutter |
| Audiense | Market researchers and audience strategists | Demographic clustering and affinity mapping | Follower and audience segments | Advanced audience profiling for deep consumer segmentation |
Native X Analytics
Native X Analytics, accessed directly through the account menu or Tweet Activity dashboard, remains the primary source of truth for platform-level interaction data.
- Best for: Bootstrapped creators, individual founders, and social media managers who require direct first-party data without connecting external software tokens.
- Top strengths:
- Zero integration work because metrics come straight from the platform, including view counts, profile visits, and bookmark totals.
- Native video analytics in Media Studio, including retention and completion views that many third-party tools do not reproduce.
- Raw data export for account-level totals and individual post activity, where your account tier includes it.
- Weaknesses: Dashboard views cover limited date ranges, so long-term history depends on downloading and storing exports yourself. It lacks cross-channel comparison and competitor benchmarking. X has changed which analytics features sit behind X Premium or Verified Organizations several times, so check the Analytics menu of your own account before planning around it.
- When to choose: Choose Native X Analytics when you want first-party numbers without extra software and can commit to exporting and archiving your data every month.
Sprout Social
Sprout Social provides enterprise-grade analytics infrastructure designed to unite social media monitoring, publishing, and customer engagement into unified reporting dashboards.
- Best for: Mid-market brands and corporate marketing departments with dedicated social media analysts requiring presentation-ready stakeholder reports.
- Top strengths:
- Automated executive reporting templates that aggregate X metrics alongside Meta, LinkedIn, and YouTube data without manual spreadsheet formatting.
- Integrated listening module that categorizes brand mentions, share of voice, and customer sentiment trends over custom multi-year date ranges.
- Sophisticated team permission controls and post-tagging systems that track campaigns against specific business objectives.
- Weaknesses: Pricing is calculated per seat, which adds up quickly for growing teams with many collaborators. Advanced listening is sold as an add-on.
- When to choose: Choose Sprout Social when executive stakeholders require standardized cross-channel attribution reports and your organization has the budget to support per-seat SaaS licensing.
Hootsuite
Hootsuite is a veteran social media management platform that combines multi-channel scheduling with customizable analytics dashboards and automated performance tracking.
- Best for: Marketing teams managing active posting schedules across multiple platforms that need aggregated performance comparisons in a single interface.
- Top strengths:
- Highly customizable analytics dashboard where users can drag and drop metric tiles, track link clicks, and monitor impression benchmarks.
- Ow.ly link tracking integration that connects social impressions directly to campaign-level click counts and referral visits.
- Best-time-to-publish recommendation engine based on historical audience interaction patterns.
- Weaknesses: The user interface can feel dense and cluttered for users focused exclusively on X. Setting up customized analytics reports requires navigating complex multi-step configuration menus.
- When to choose: Choose Hootsuite when your team manages five or more distinct social networks and needs consolidated scheduling alongside multi-platform reporting.
Buffer
Buffer delivers a streamlined, minimalist social media management experience that prioritizes intuitive scheduling and accessible post performance evaluation.
- Best for: Solo entrepreneurs, boutique agencies, and independent creators who need clean publishing oversight without enterprise analytical complexity.
- Top strengths:
- Minimal learning curve with clear post-level visual indicators showing which content formats generated above-average retweets and replies.
- Modular channel pricing that prevents small organizations from overpaying for unused network connections or excessive seat licenses.
- Automated weekly digest highlighting top-performing updates and audience engagement changes over time.
- Weaknesses: Analytics features lack deep sentiment parsing, competitor account tracking, and granular second-by-second video retention analysis. Historical data depth is limited on lower subscription tiers.
- When to choose: Choose Buffer when your primary priority is reliable content distribution with clean, fundamental engagement reporting on a modest monthly budget.
SocialPilot
SocialPilot is built specifically for digital marketing agencies that manage numerous client accounts and require scalable reporting workflows without exorbitant per-user markups.
- Best for: Digital marketing agencies, social media consultants, and multi-location franchise businesses managing high volumes of client profiles.
- Top strengths:
- Client-ready PDF reports that can be white-labeled with agency logos and scheduled for automated weekly or monthly email delivery.
- Comprehensive account-level performance tracking that aggregates engagement rates, audience growth velocity, and hashtag effectiveness across multiple accounts.
- Generous account allowances, so teams can add client profiles without steep jumps in cost.
- Weaknesses: Social listening capabilities are relatively basic compared to dedicated monitoring suites like Brand24. The mobile application provides limited reporting functionality compared to the desktop portal.
- When to choose: Choose SocialPilot when your agency needs to produce white-labeled performance audits for dozens of client accounts without paying per-seat software fees.
Brand24
Brand24 focuses exclusively on social listening, digital brand monitoring, and public sentiment analysis, providing qualitative intelligence that standard publishing tools overlook.
- Best for: PR agencies, corporate communications teams, and high-visibility executives who need real-time alerts on brand mentions, reputation shifts, and industry conversations.
- Top strengths:
- AI-driven sentiment analysis that classifies mentions into positive, negative, or neutral sentiment, flagging potential PR crises before they escalate.
- Estimation of social reach and advertising value equivalency (AVE) for organic brand discussions across public accounts.
- Contextual discussion volume graphs that track how viral threads or news events influence overall brand perception over specific time frames.
- Weaknesses: Does not support post scheduling, content publishing, or native profile management. Historical data access is tied strictly to active tracking projects created after account activation.
- When to choose: Choose Brand24 when tracking brand sentiment, crisis signals, and competitor conversation volume matters more than analyzing your own publishing calendar.
Audiense
Audiense is an enterprise audience intelligence and segmentation platform that analyzes the sociological architecture and affinity groupings within your X follower base.
- Best for: Consumer research agencies, brand strategists, and enterprise growth teams executing data-backed market segmentation and influencer identification.
- Top strengths:
- Sociological clustering technology that dissects an audience into distinct sub-communities based on shared interests, mutual follows, and cultural affinities.
- Identification of organic micro-influencers and authority accounts that exert disproportionate influence within specific target market segments.
- Exportable audience data sets that can be imported directly into advertising platforms for hyper-targeted audience modeling.
- Weaknesses: The platform is dedicated to audience analysis rather than daily publishing or post-level interaction tracking. Its full insights suite is positioned for enterprise budgets.
- When to choose: Choose Audiense when planning major product launches or enterprise repositioning campaigns that require demographic and cultural mapping of consumer segments.
Where Orova Social fits next to your X analytics
Orova Social is not an X analytics tool: it does not publish to X and does not read X data. It belongs in this guide only because most teams that measure X also publish on other networks, and the planning work after an analytics review usually happens in a scheduler.
- What it does: draft once and publish to 8 channels (Facebook, Instagram, TikTok, YouTube, Threads, LinkedIn, Zalo OA, and Telegram), schedule posts on a daily, weekly, or monthly content calendar, and catch up on missed slots automatically.
- AI help: captions written in your brand voice in several languages, AI images with your brand frame, and long videos cut into vertical 9:16 clips with subtitles and voiceover.
- Reporting: you can download the publishing calendar as an Excel file for your own reports.
- Access: every plan includes every feature, and it is free until 7 July 2027.
Use it alongside one of the seven X tools above, not instead of them.
Data access matrix: Free vs X Premium vs Verified Organizations vs third-party software
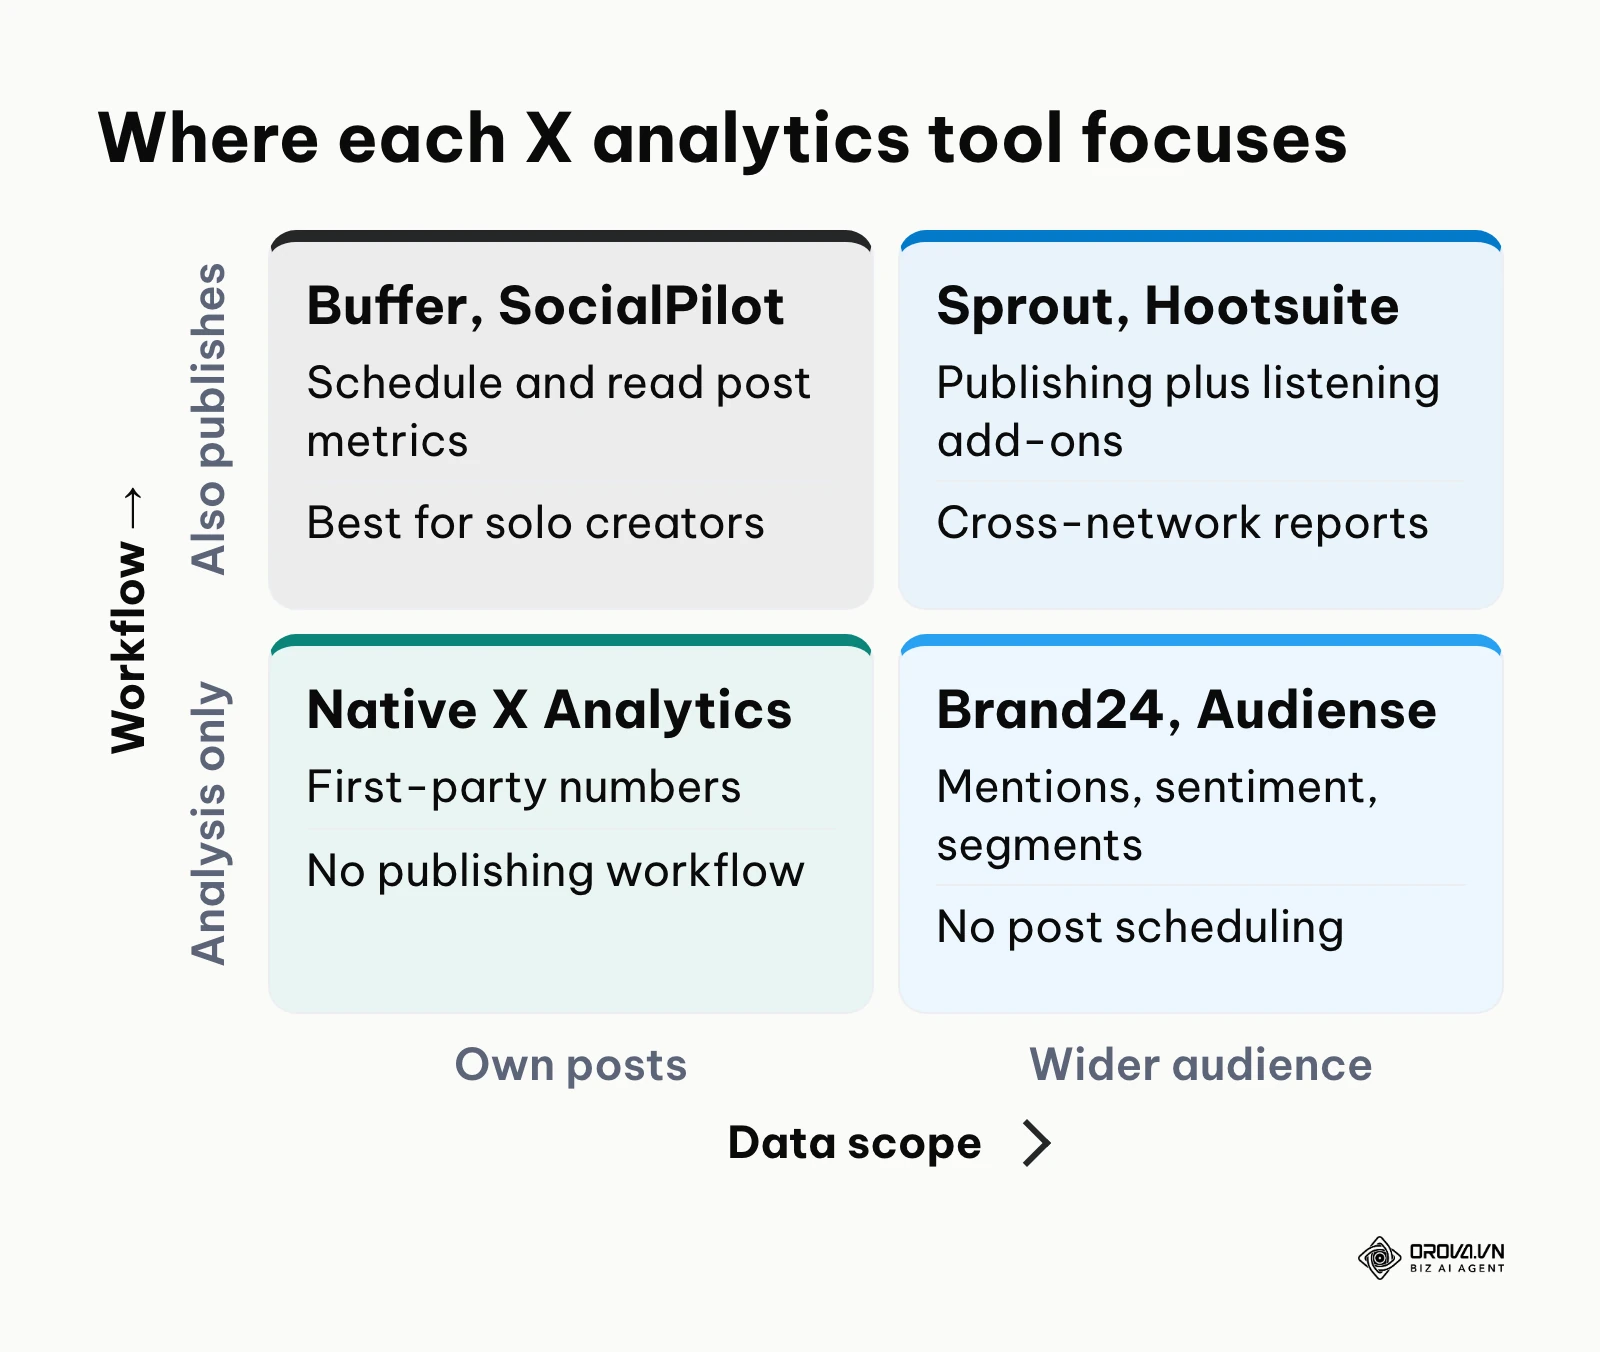
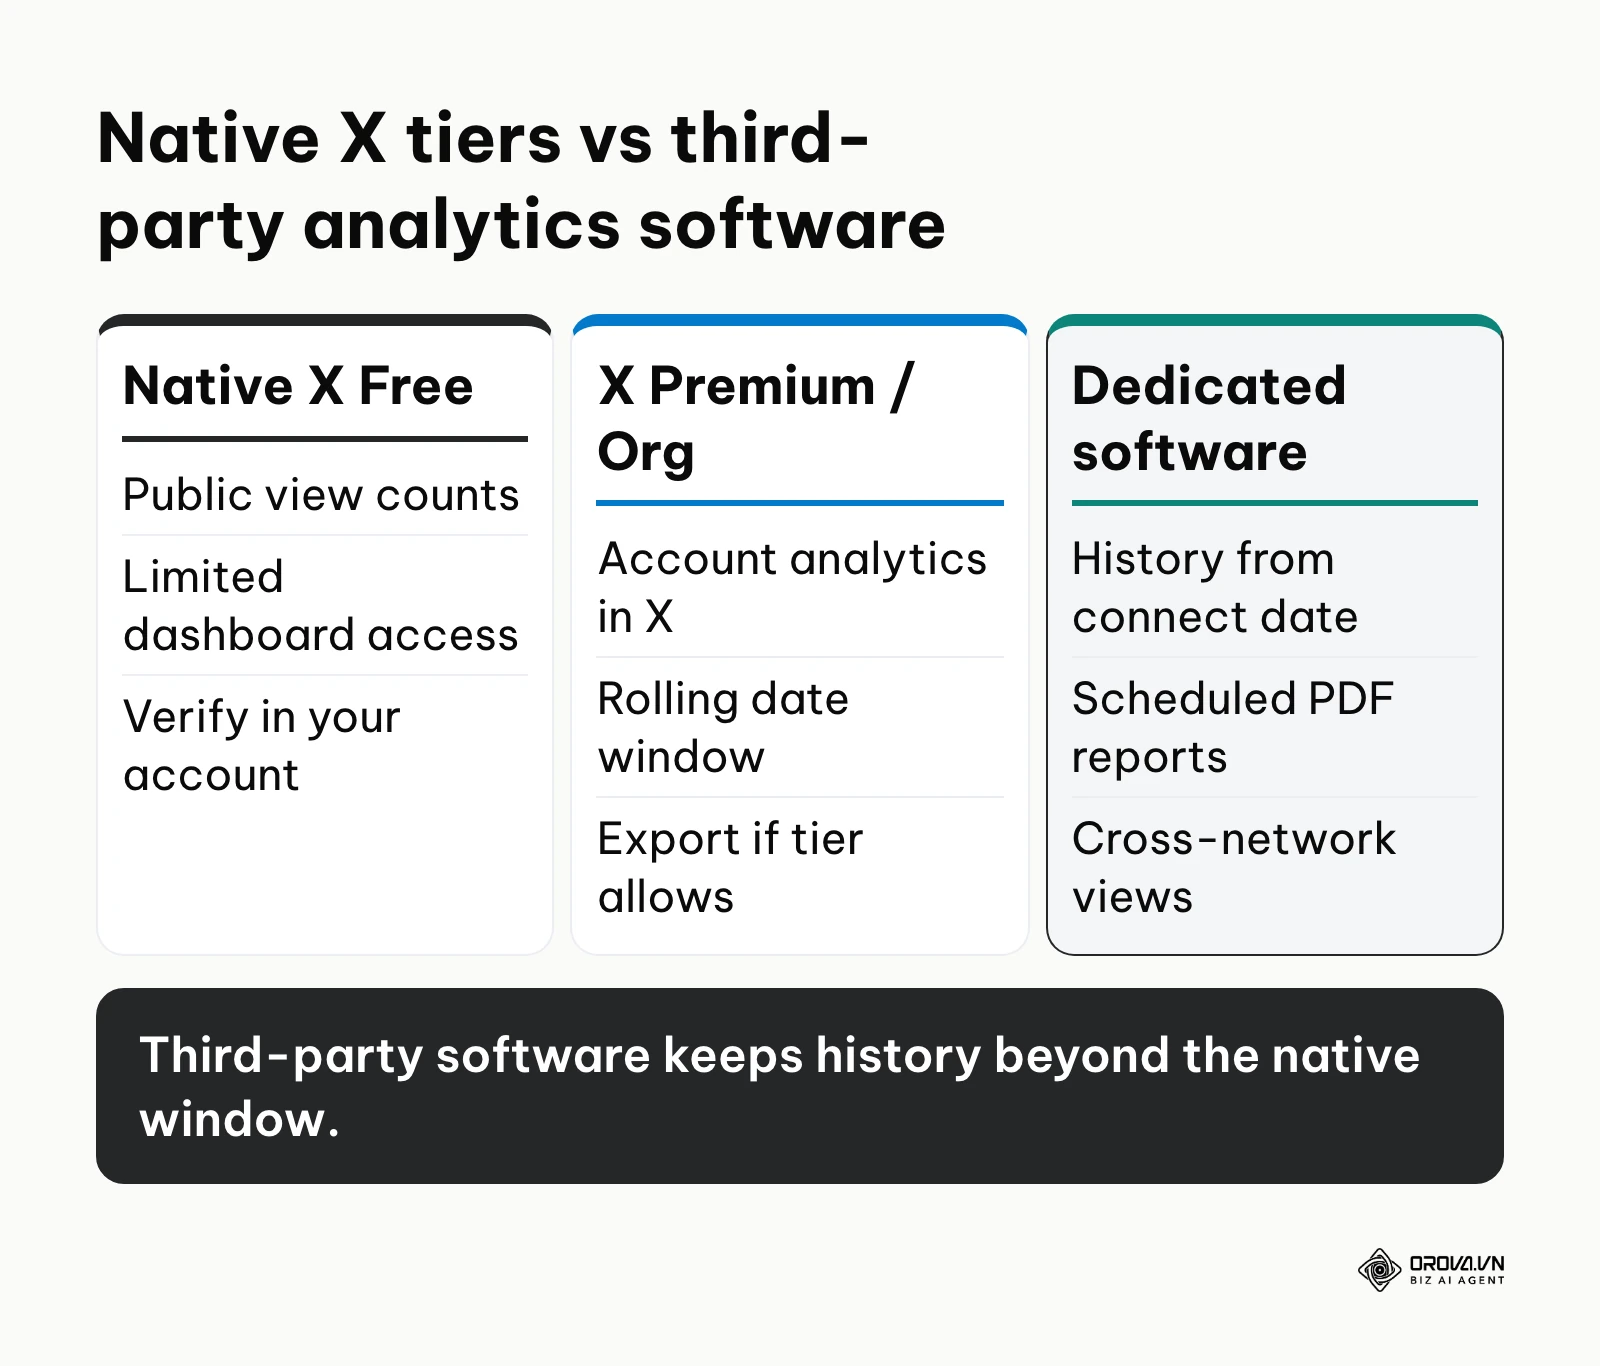
Understanding data access tiers prevents organizations from paying for features they do not need. The diagram compares native tiers with dedicated analytics software, and the table below breaks down what each option typically gives you. X adjusts tier entitlements often, so treat the native rows as a checklist to verify inside your own account.
| Tier / Solution | What You Typically See | Historical Data | Reporting & Export | Recommended User Profile |
|---|---|---|---|---|
| Native X, free account | Public view counts on each post; deeper dashboards may be limited | Short rolling window | Limited; verify in your account | Individual creators and side projects |
| X Premium | Account analytics and post activity inside X | Rolling window inside the dashboard | Export where your tier includes it | Solo creators who post daily |
| Verified Organizations | Account analytics plus organization features such as affiliated accounts | Rolling window inside the dashboard | Export and multi-admin access | Companies managing several brand accounts |
| Third-party software (e.g., Sprout Social, SocialPilot) | Account and post metrics pulled through the official connection | Stored from the day you connect | Scheduled PDF reports, white-label, cross-network views | Multi-brand marketing teams and agencies |
Many small teams assume that a Verified Organizations subscription is mandatory to unlock professional analytics. In practice, it is mainly about verification, affiliation badges, and organization management. If your main goal is to archive history and automate stakeholder reports, a dedicated reporting tool such as SocialPilot or Buffer is usually the more direct fit.
Turning X insights into a steady posting plan across your other channels? Orova Social lets you draft once and schedule to 8 channels, including Facebook, Instagram, LinkedIn and YouTube. Write captions in your brand voice with AI and cut long videos into vertical 9:16 clips with subtitles, so your content calendar stays full without extra busywork.
Calculating True Engagement Rate: formula and concrete benchmark calculation
Evaluating content performance on X requires abandoning follower-based engagement formulas. Because modern distribution is driven heavily by the algorithmic For You recommendation feed, follower count bears little correlation to actual post visibility. A profile with 50,000 followers might generate 80,000 impressions on a post that catches algorithmic momentum, or only 800 impressions on an internal update.
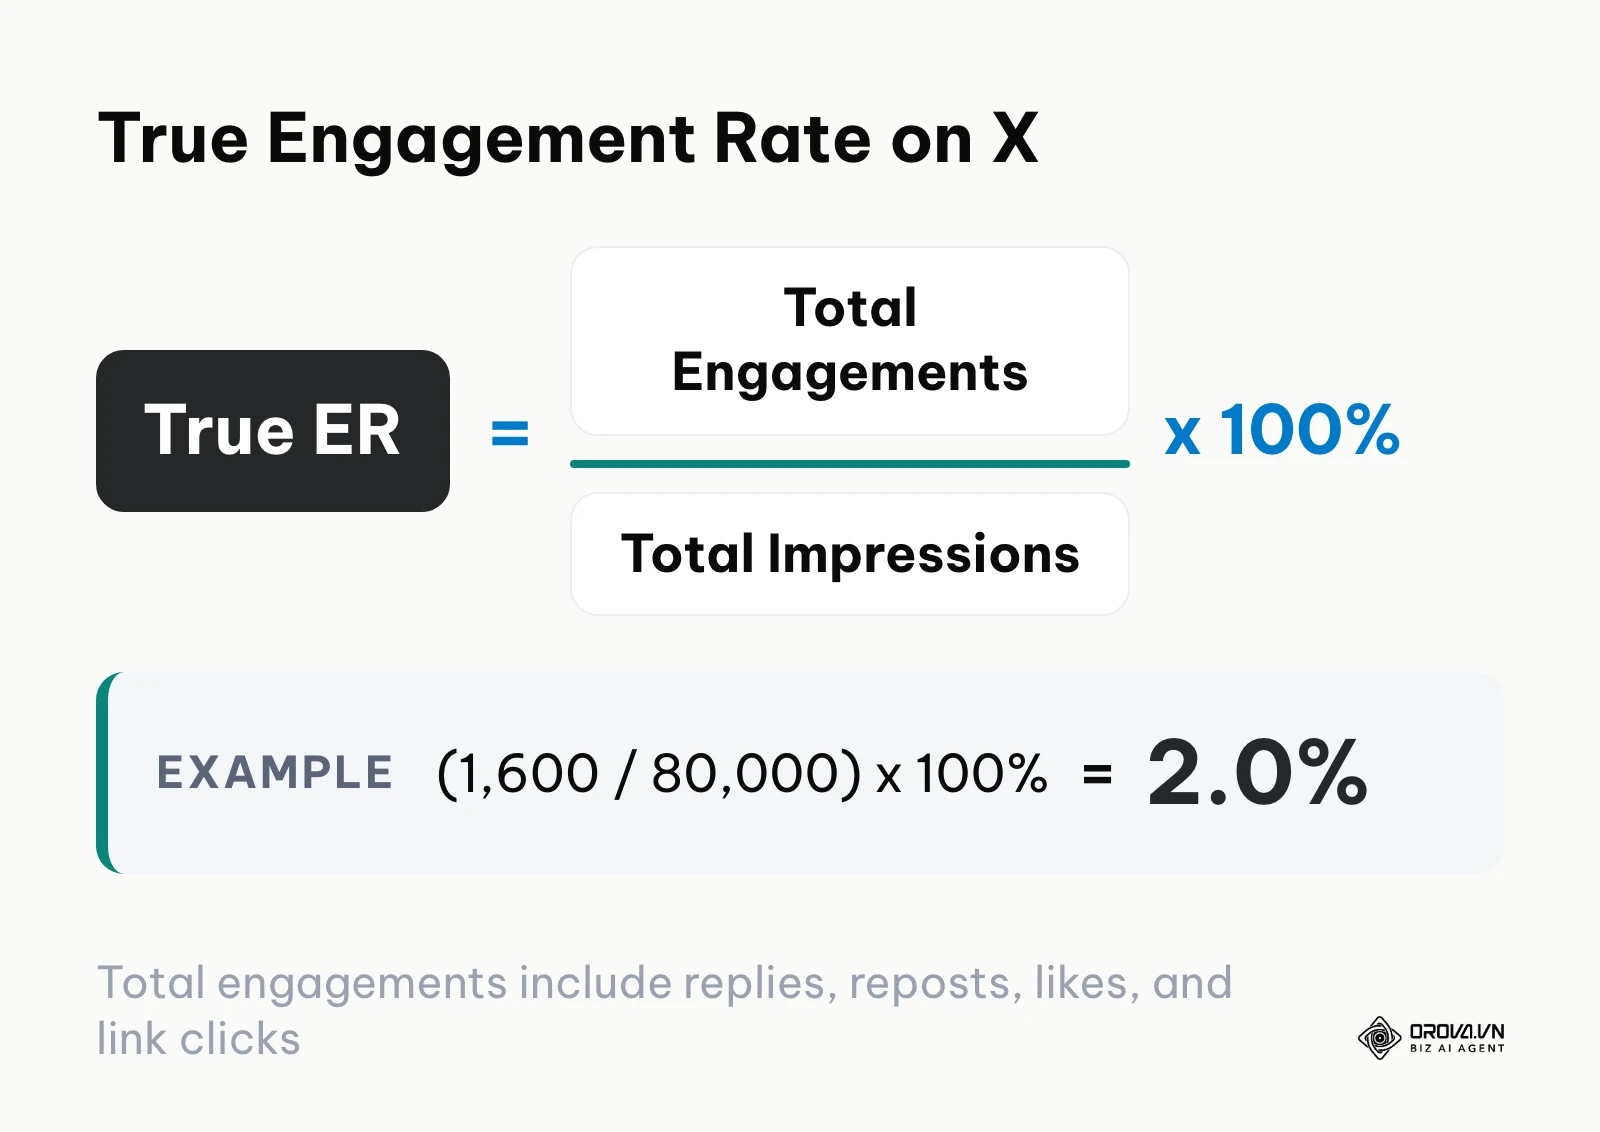
True Engagement Rate = (Total Engagements / Total Impressions) x 100%
To calculate True Engagement Rate (True ER), divide total post interactions by total impressions and multiply by 100. Total interactions must encompass all registered user actions: direct replies, reposts (retweets), quotes, likes, link clicks, media expansions, and profile clicks.
Total Engagements = Replies + Reposts + Quotes + Likes + Link Clicks + Media Expansions + Profile Clicks
Consider a concrete numerical calculation: An account publishes an in-depth breakdown of industry market shifts that achieves 80,000 impressions. The native Tweet Activity dashboard records the following interaction breakdown:
- Likes: 800
- Reposts (Retweets): 400
- Direct Replies: 250
- Link Clicks: 150
- Total Engagements = 800 + 400 + 250 + 150 = 1,600
Applying the formula:
True ER = (1,600 / 80,000) x 100% = 2.0%
Engagement measured against follower counts tends to look tiny on X because most views come from the For You feed, which is why impressions give a clearer efficiency baseline. As a starting point, many teams use working thresholds like the ones below, then recalibrate them against their own 90-day median:
- Below 0.5%: Underperforming content. The hook or format failed to stop user scrolling.
- 0.5% – 1.2%: Standard baseline engagement for corporate and educational commentary.
- 1.3% – 2.5%: Strong content performance. The post sparked meaningful community discussion or bookmarking.
- Above 2.5%: Exceptional viral resonance. The format should be dissected and repurposed into future editorial workflows.
For a wider view of how X fits into cross-network reporting, see this guide to social analytics tools. Understanding whether your threads serve broad top-of-funnel reach or function as bottom of funnel content designed to initiate product trials helps set realistic engagement benchmarks for each publishing format.
Isolating Non-follower Reach Ratio: measuring algorithmic For You distribution
Under the modern architecture of X, impressions originate from two fundamentally distinct discovery vectors: the chronological Following feed and the algorithmic For You recommendation tab. Evaluating whether your account is growing organically requires isolating the percentage of views originating from users who do not follow your profile.
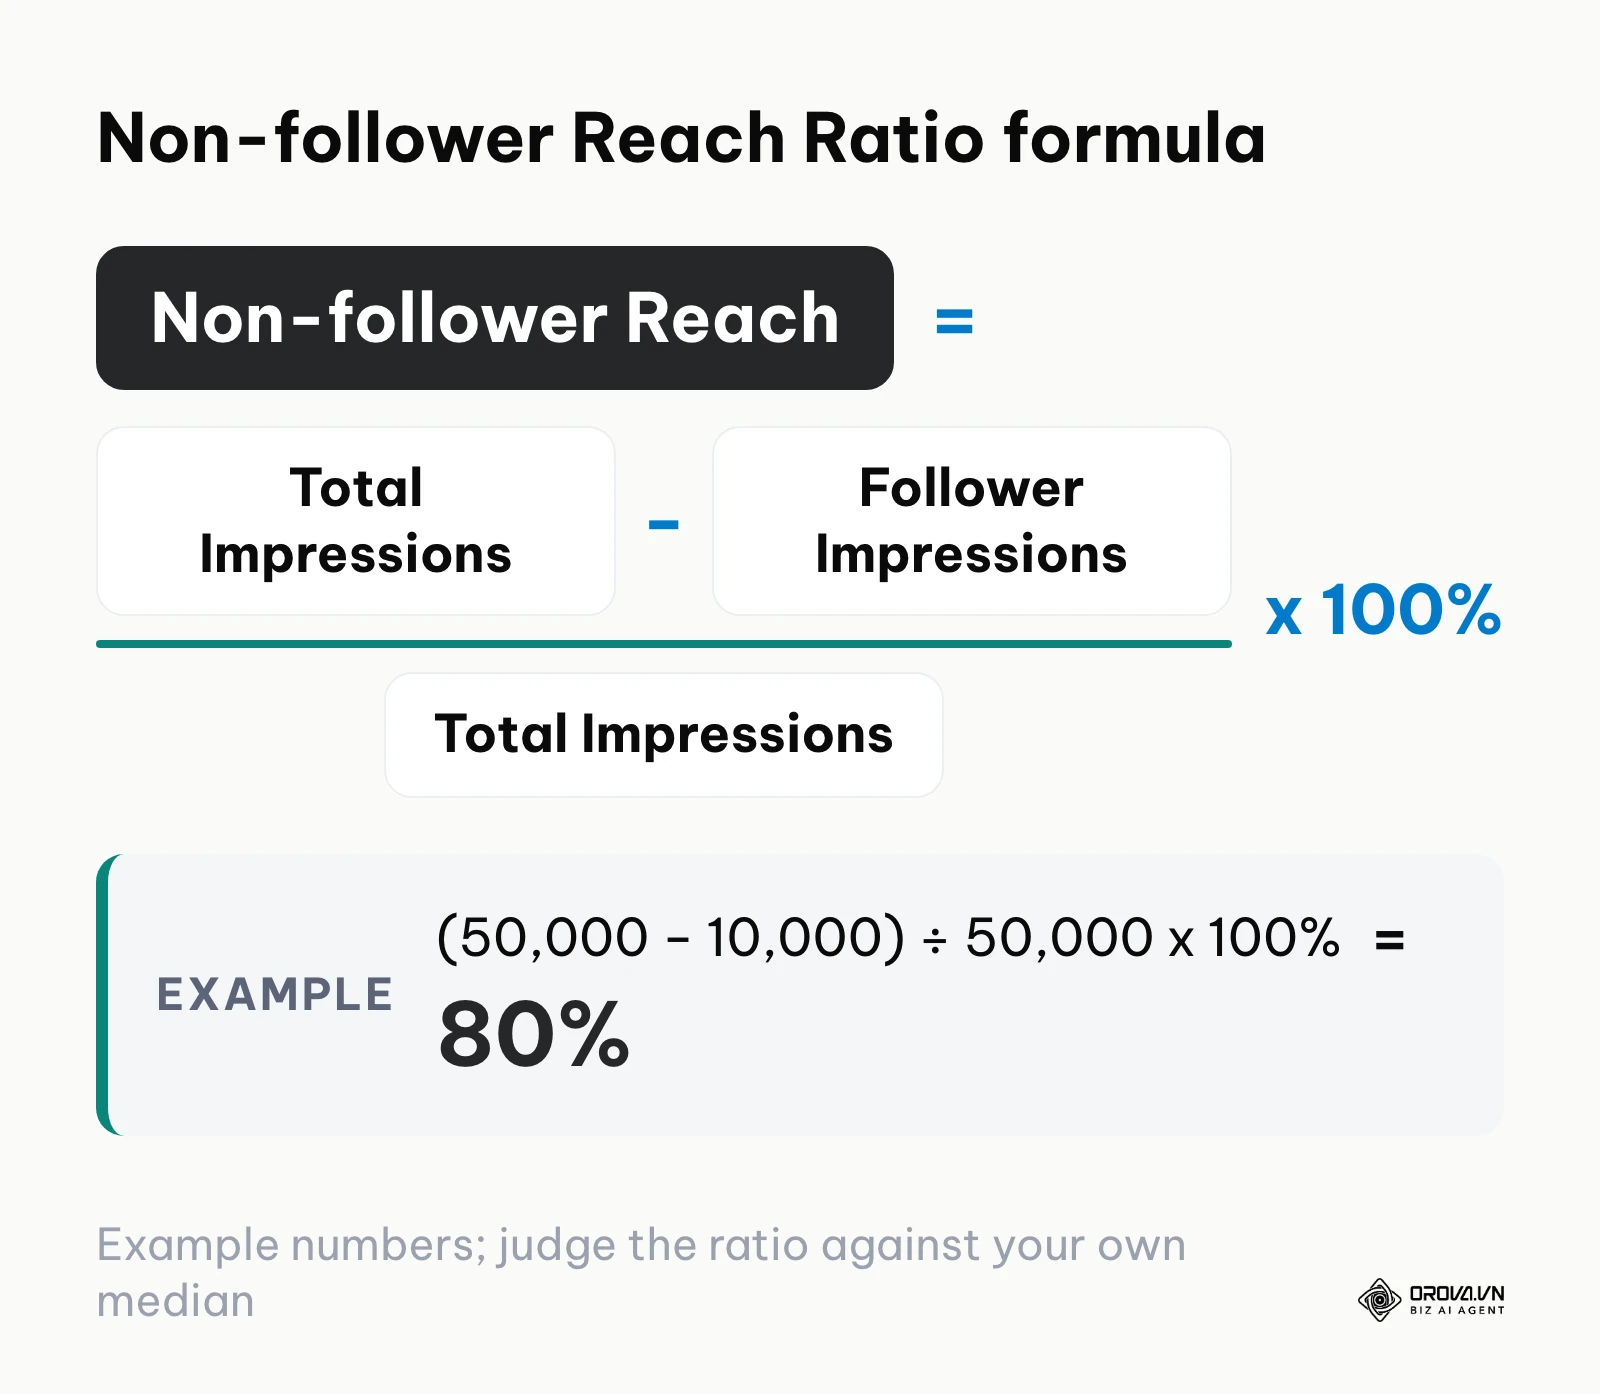
Non-follower Reach Ratio = ((Total Impressions - Follower Impressions) / Total Impressions) x 100%
When non-follower reach is not isolated directly in standard charts, calculating this ratio via native CSV exports reveals how effectively the algorithm distributes your content to broader audiences. If a post records 50,000 total impressions and your historical follower baseline accounts for approximately 10,000 impressions, the calculation is straightforward:
Non-follower Reach Ratio = ((50,000 - 10,000) / 50,000) x 100% = 80.0%
As a working rule, a high Non-follower Reach Ratio indicates that the algorithm successfully classified your content topic and served it to active users browsing relevant interest clusters in the For You tab. Conversely, a low ratio suggests that your content remained confined to your existing audience, signaling that the post lacked the retention signals or topical clarity necessary for automated platform distribution.
Optimizing the Video Activity Dashboard: retention curves and completion benchmarks
Short-form video has become a primary driver of algorithmic engagement on X. Yet many brands evaluate video performance using only total video views, failing to realize that X registers a video view after just two seconds of playback with at least 50% of the player visible on screen.
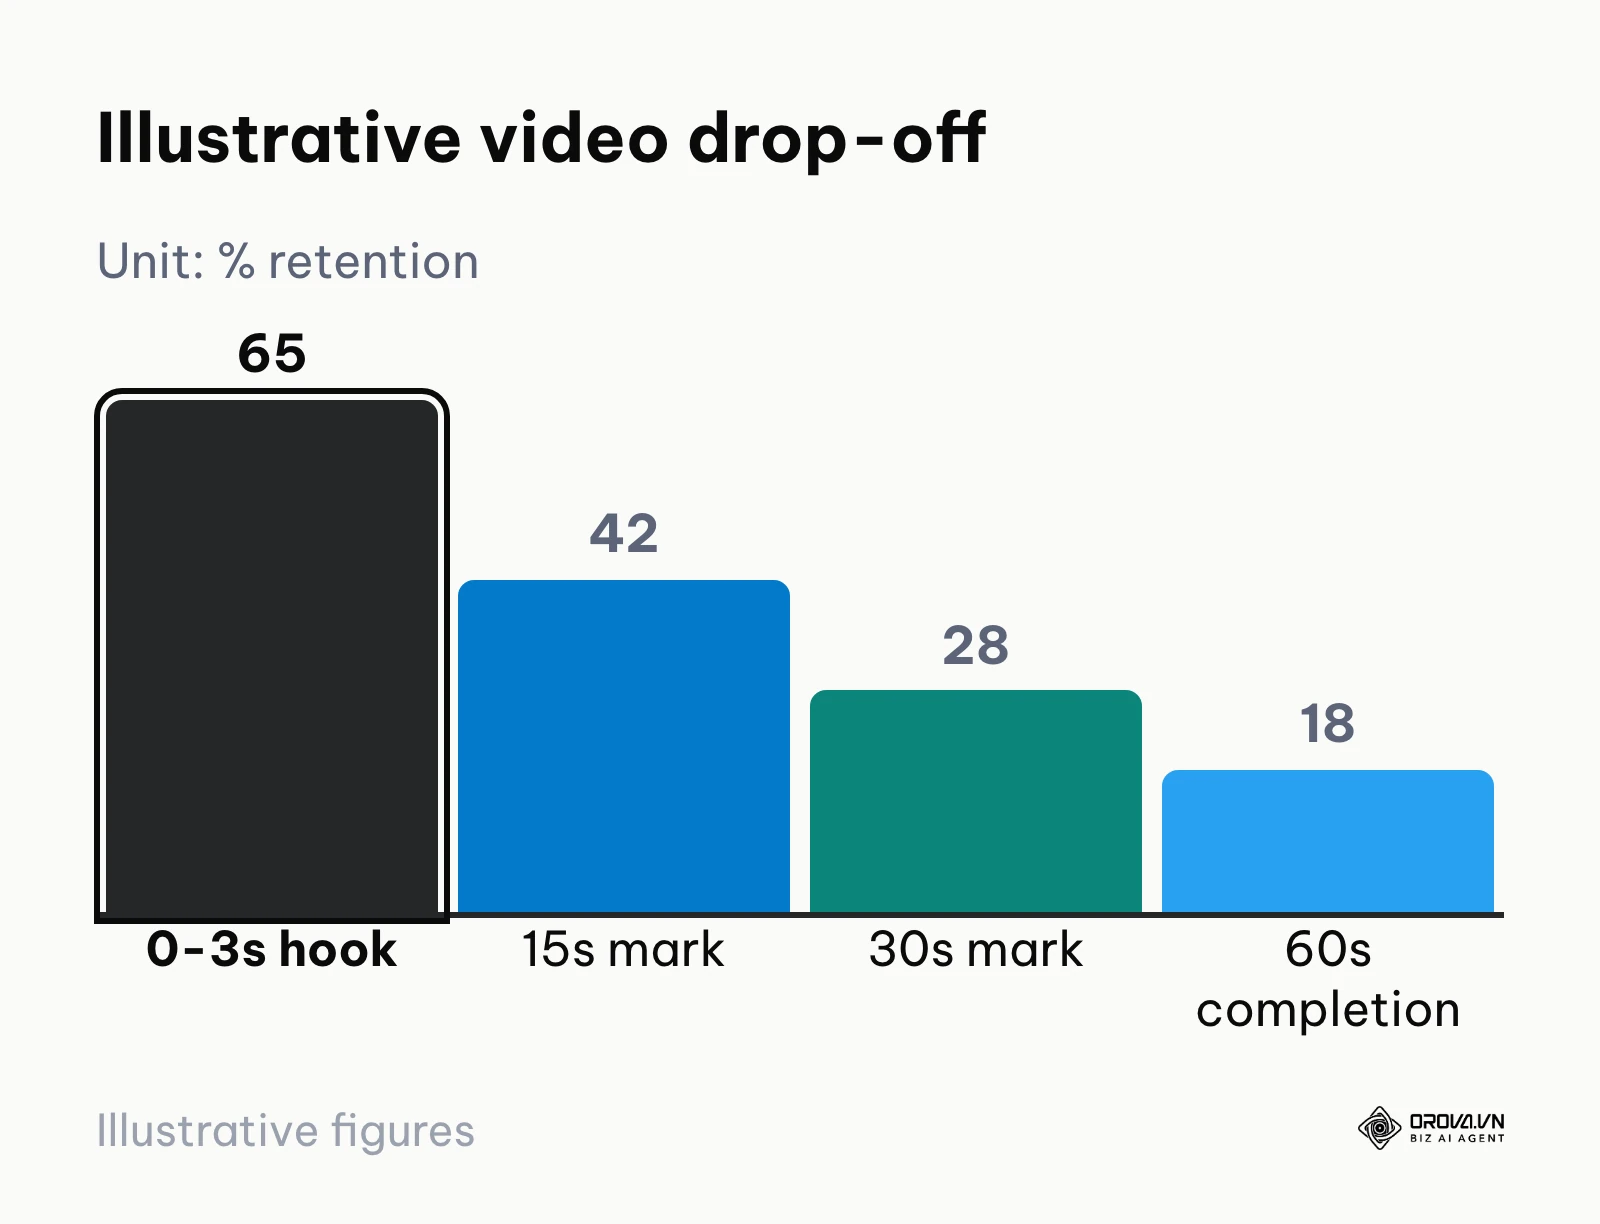
The chart shows an illustrative viewer drop-off pattern across key video milestones (example numbers, not an industry benchmark). The video analytics in X Media Studio let social managers review how viewers drop off over the length of each clip. The table below gives illustrative targets to start from; replace them with your own medians after a few weeks of data:
| Video Duration Bucket | Target 3-Second Hook Retention | Target Midpoint Retention | Target Completion Rate | Primary Failure Factor |
|---|---|---|---|---|
| Micro (15–30 seconds) | > 70% | > 50% | > 35% | Slow opening frame or generic stock imagery |
| Standard (30–60 seconds) | > 65% | > 40% | > 20% | Protracted verbal introductions or late visual payoff |
| Long-form (60–120 seconds) | > 55% | > 30% | > 12% | Monotonous pacing and lack of text captions |
| Deep Dive (2 minutes+) | > 45% | > 20% | > 8% | Insufficient audio clarity or weak chapter structure |
Illustrative example:
- Context: A boutique fintech content studio producing two educational video breakdowns weekly for an audience of 15,000 industry professionals.
- Steps taken: The team audited the native Video Activity Dashboard over six consecutive weeks, logged viewer drop-off markers across 12 video assets, and mapped viewer decline against specific editing choices.
- Roadblock and resolution: Viewers were dropping off sharply at second 4 because every video opened with a branded 3-second animated title logo; the team eliminated the animated bumper, placed a contrarian visual chart on the opening frame, and added high-contrast burned-in subtitles.
- Visible outcome: The 3-second hook retention increased from 38% to 68%, mid-video completion rates doubled across subsequent releases, and video impressions expanded beyond their existing subscriber base into the For You video stream.
Step-by-step monthly audit: extracting actionable insights from raw CSV data
Third-party analytics dashboards provide convenient visual charts, but performing a monthly audit on raw CSV data gives social teams complete control over historical trends without ongoing software subscription costs. Teams that need to manage all social media in one place often use these manual audits to set benchmark performance targets across their broader publishing ecosystem. If you want to move these archives into a proper dashboard later, this overview of marketing analytics tools compares the main options.
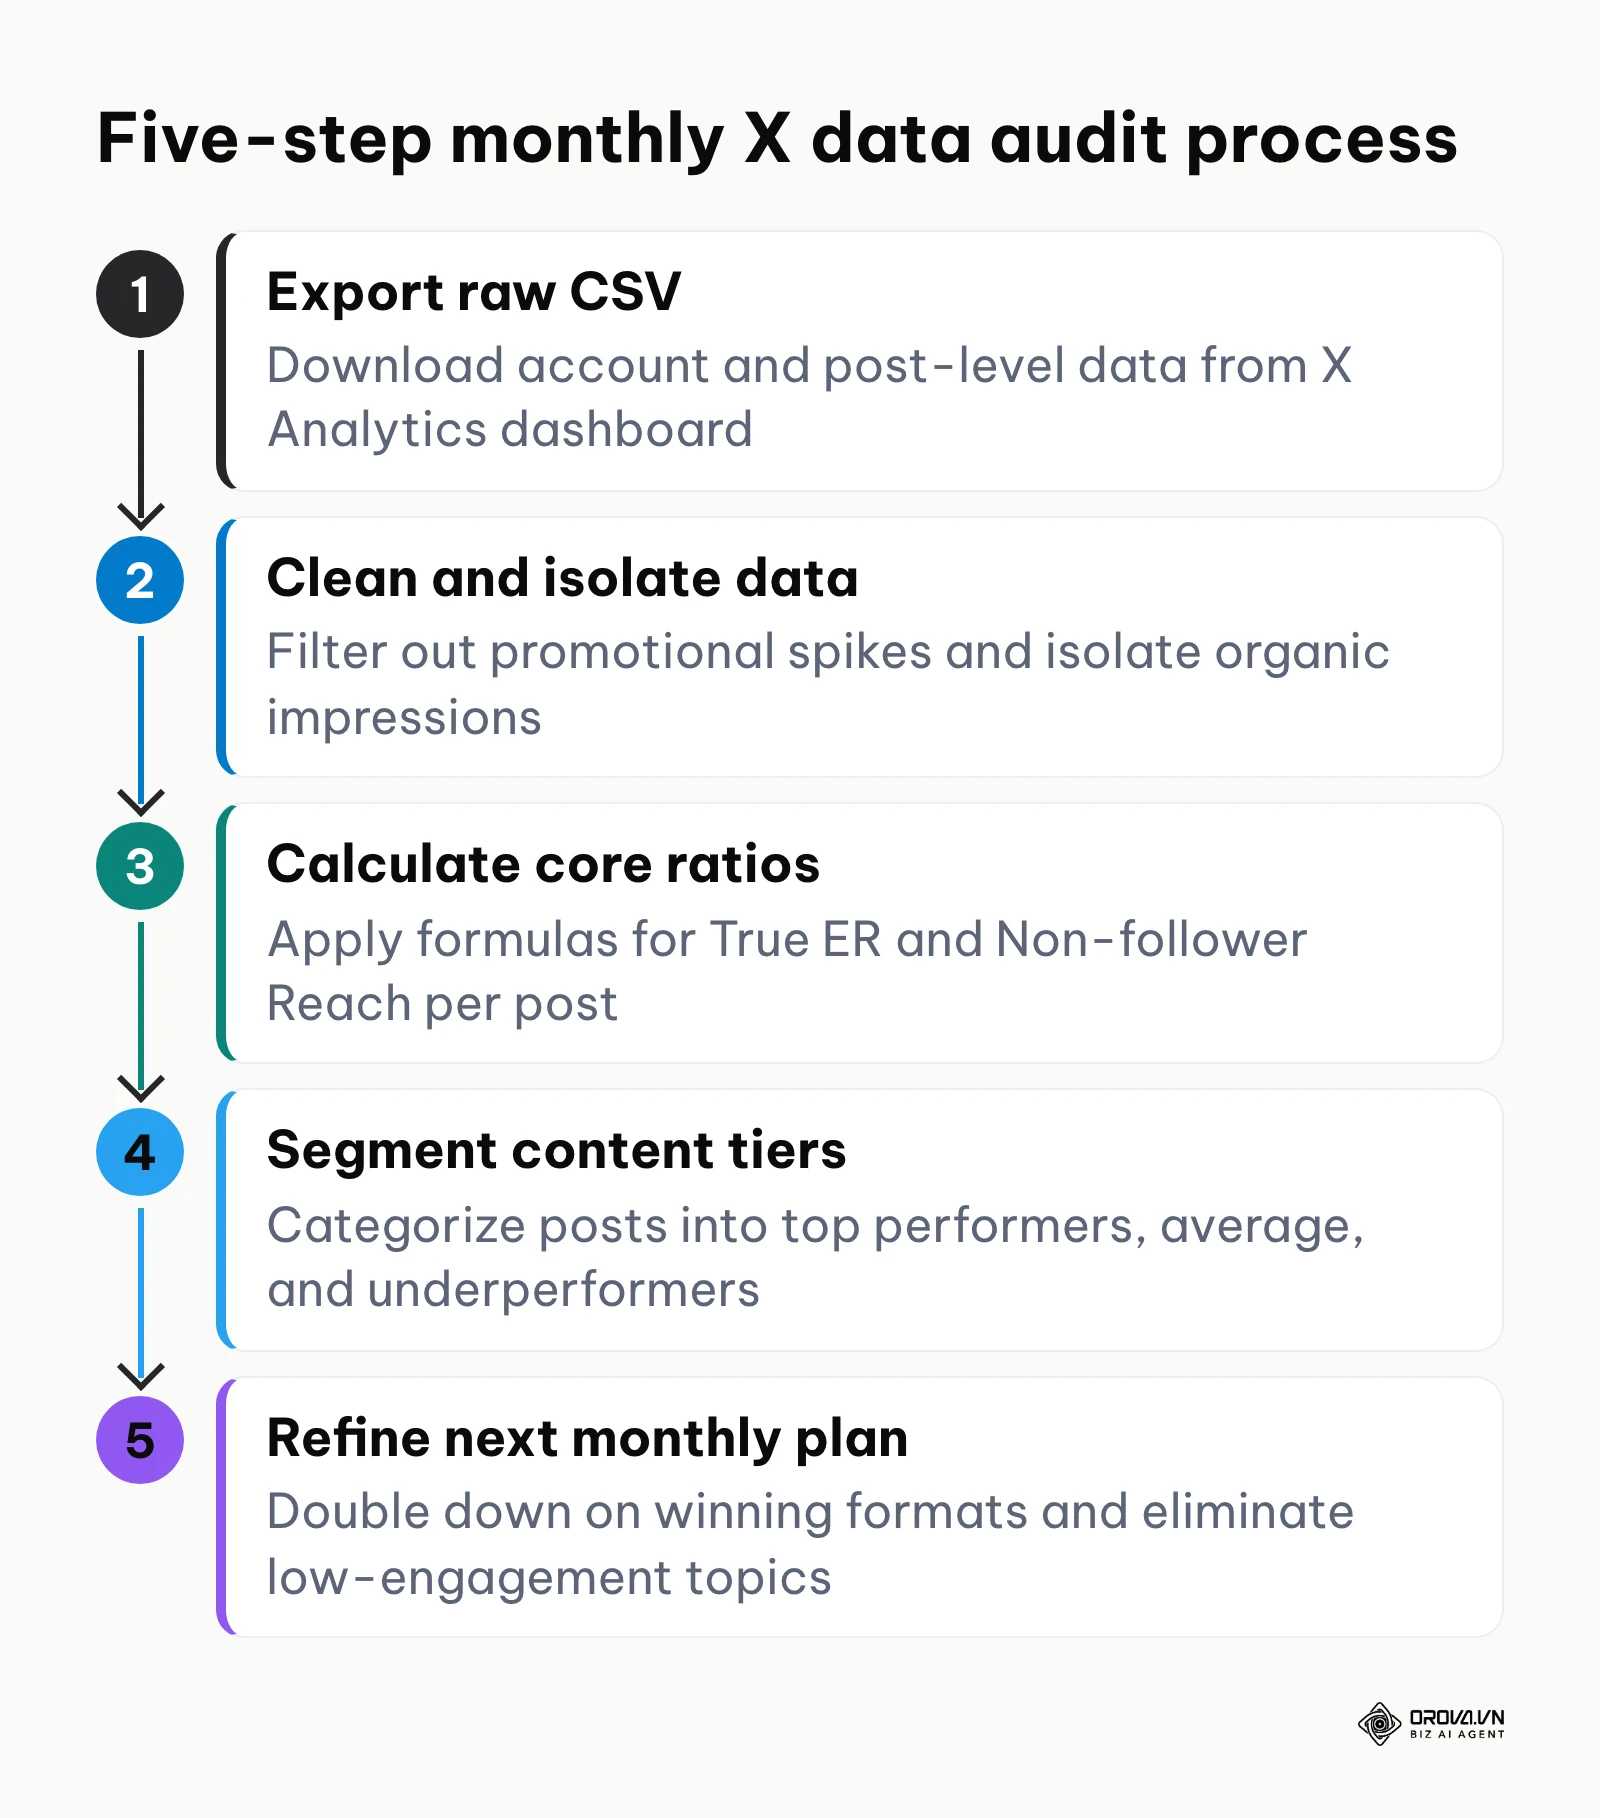
The five steps below turn a raw export into next month's editorial plan.
Step 1: Export raw CSV files
Navigate to the native X Analytics dashboard on the first day of each month (export availability depends on your account tier). Select the previous calendar month date range and download two distinct files: the Account Summary CSV and the Tweet Activity CSV. Save these files using a consistent naming protocol (e.g., 2026-03_X_tweet-activity.csv).
Step 2: Clean and normalize data columns
Open the Tweet Activity CSV in Google Sheets or Microsoft Excel. Filter out paid promotional rows to isolate purely organic impressions. Delete unnecessary metadata columns and format numerical fields (impressions, retweets, replies, likes, link clicks, media views) as clean integers.
Step 3: Compute calculated ratio columns
Insert two calculated columns alongside the raw data:
- True ER: Calculated as (engagements / impressions) * 100.
- Engagement Quality Index: Calculated as ((replies * 3) + (retweets * 2) + likes) / impressions * 100, weighting comments and shares higher than passive likes.
Step 4: Segment posts into performance quartiles
Sort your data by True ER in descending order and divide total published updates into three distinct buckets:
- Top 10% (Growth Drivers): Formats that generated outlier interaction. Identify common structural patterns in hooks, media types, and publishing timestamps.
- Middle 70% (Core Baseline): Reliable updates that sustained baseline presence without generating significant conversational spread.
- Bottom 20% (Format Retires): Posts that fell below 0.3% True ER. Review these updates to identify unengaging topics or weak opening lines.
Step 5: Adjust editorial buckets for the upcoming month
Translate quartile insights into editorial guidelines for the following month. If short text-based contrarian statements generated 2.4% True ER while link-heavy announcements averaged 0.2%, reallocate publishing resources toward discussion-oriented formats.
Illustrative example:
- Context: A single social media manager handling an educational B2B software account with 25,000 followers.
- Steps taken: The manager downloaded 90 days of raw CSV data, cleaned promotional test spikes, and applied True ER formulas across 140 published posts.
- Roadblock and resolution: Initial analysis showed massive impression spikes on three giveaway posts, skewing monthly averages while producing zero qualified newsletter subscribers; the manager filtered out giveaway outliers and isolated organic thought leadership threads.
- Visible outcome: The team replaced daily broad industry news links with two structured analytical threads per week, increasing median True ER from 0.4% to 1.8% and generating consistent, inbound product inquiries.
Weekly X Content Review Checklist
Executing a concise weekly review prevents underperforming publishing tactics from persisting unnoticed over full quarters. The six checkpoints below keep the review short.
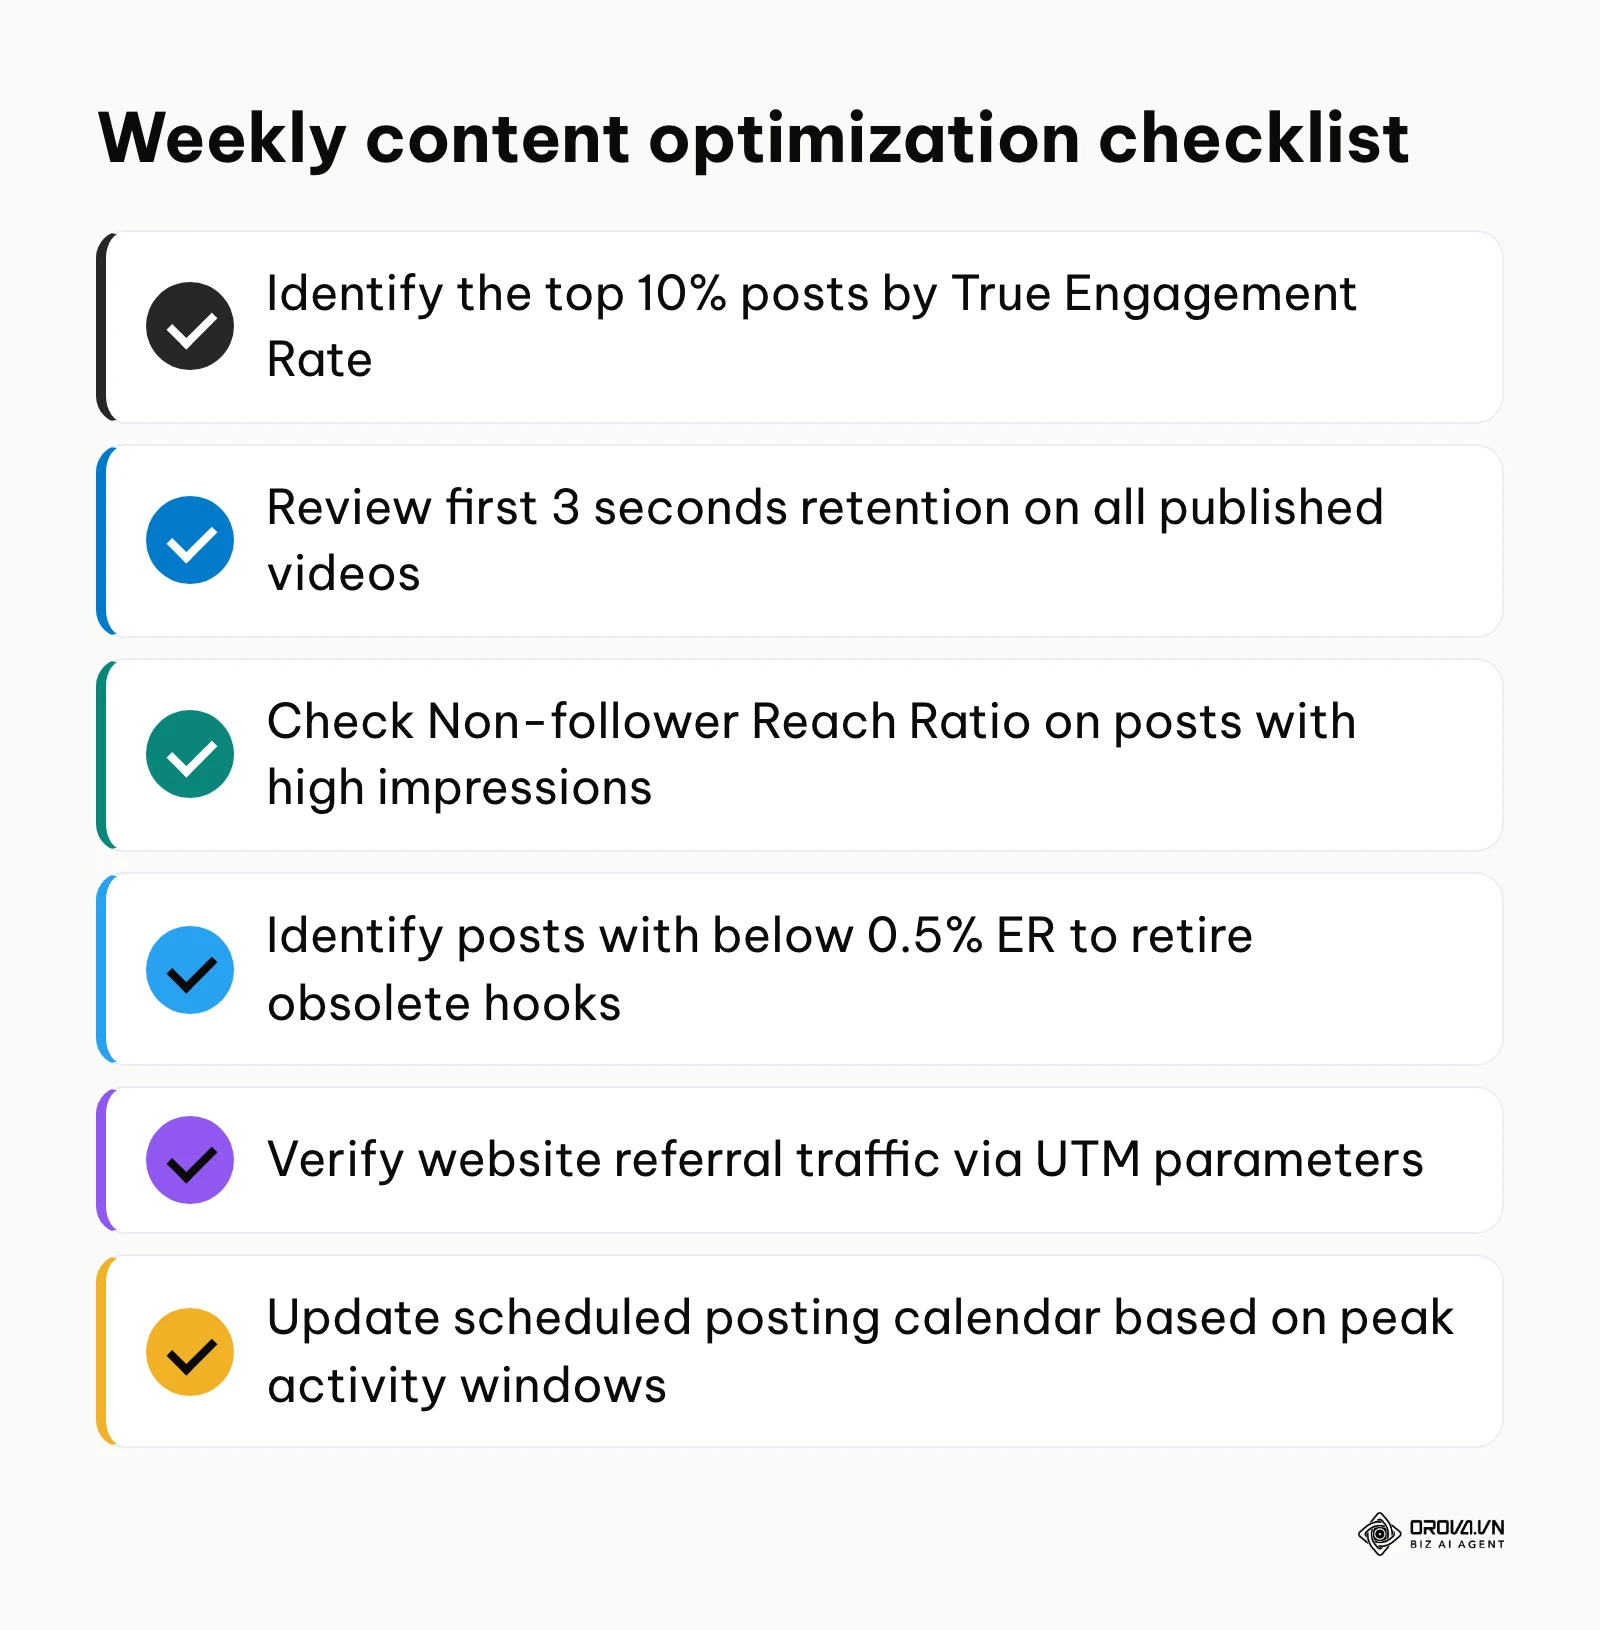
Before scheduling the upcoming week's editorial calendar, review your live performance data against this six-point checklist:
- [ ] Identify the top 10% of posts by True Engagement Rate from the past seven days and note the hook structure.
- [ ] Review native video analytics to confirm early retention stays at or above your own target on every video.
- [ ] Calculate the Non-follower Reach Ratio on high-impression posts to verify recommendation placement in the For You tab.
- [ ] Flag any post recording below 0.5% True ER to isolate failing formats or confusing phrasing.
- [ ] Inspect Google Analytics UTM campaign tags to evaluate actual website referral traffic and session duration.
- [ ] Adjust upcoming scheduled publishing time slots based on the past week's peak interaction windows.
How to measure website conversions when X suppresses external links
Modern social media recommendation engines, including the X algorithm, are widely observed to give less reach to updates that contain outbound links. The platform's incentive is to keep users inside its feed, so posts with external URLs often receive noticeably fewer impressions than native text or media posts. Test this on your own account by comparing similar posts with and without links.
To preserve reach while driving qualified referral traffic, digital marketers implement two strategic workarounds:
- The 'Link in First Reply' Architecture: Publish a complete, high-value educational thread or native video update that contains zero external links in the initial post. Immediately following publication, post the destination URL with comprehensive UTM tracking parameters as the first reply to your own post.
- Native Long-Form Articles: Where your account tier supports Articles, format detailed insights as native long-form articles directly inside X, placing the outbound call to action at the conclusion of the article.
Aligning organic social metrics with broader performance marketing objectives requires attributing downstream revenue rather than stopping at vanity retweets. Setting up clean web analytics parameters and properly registering each sign-up as a verified conversion event allows marketing teams to calculate true customer acquisition costs from social referrals.
Illustrative example:
- Context: An e-commerce marketing lead running organic campaigns on X to generate registrations for a live product demonstration.
- Steps taken: The lead configured Google Analytics UTM parameters (utm_source=twitter&utm_medium=social&utm_campaign=webinar_march), published three link-heavy announcement posts, and monitored referral traffic.
- Roadblock and resolution: The announcement posts generated fewer than 1,200 impressions each because the algorithm penalized the direct outbound links; the marketer shifted to publishing a 6-part analytical breakdown of the industry problem, placing the registration link exclusively in the first reply.
- Visible outcome: Total post impressions expanded to 28,000, referral clicks increased by 400%, and verified webinar registrations rose from 8 to 64 within a single campaign cycle.
Replace scattered scheduling spreadsheets with one calendar. With Orova Social, every plan includes every publishing feature, AI captions and video clipping, free until 7 July 2027. Sign up without a credit card and start scheduling today.
How to choose the right analytic twitter tool by situation
No single analytics platform suits every operational setup. The decision framework guides tool selection by your main requirement, and the situational table gives a concrete recommendation. Review your operational constraints in the table below to select the most appropriate solution immediately.
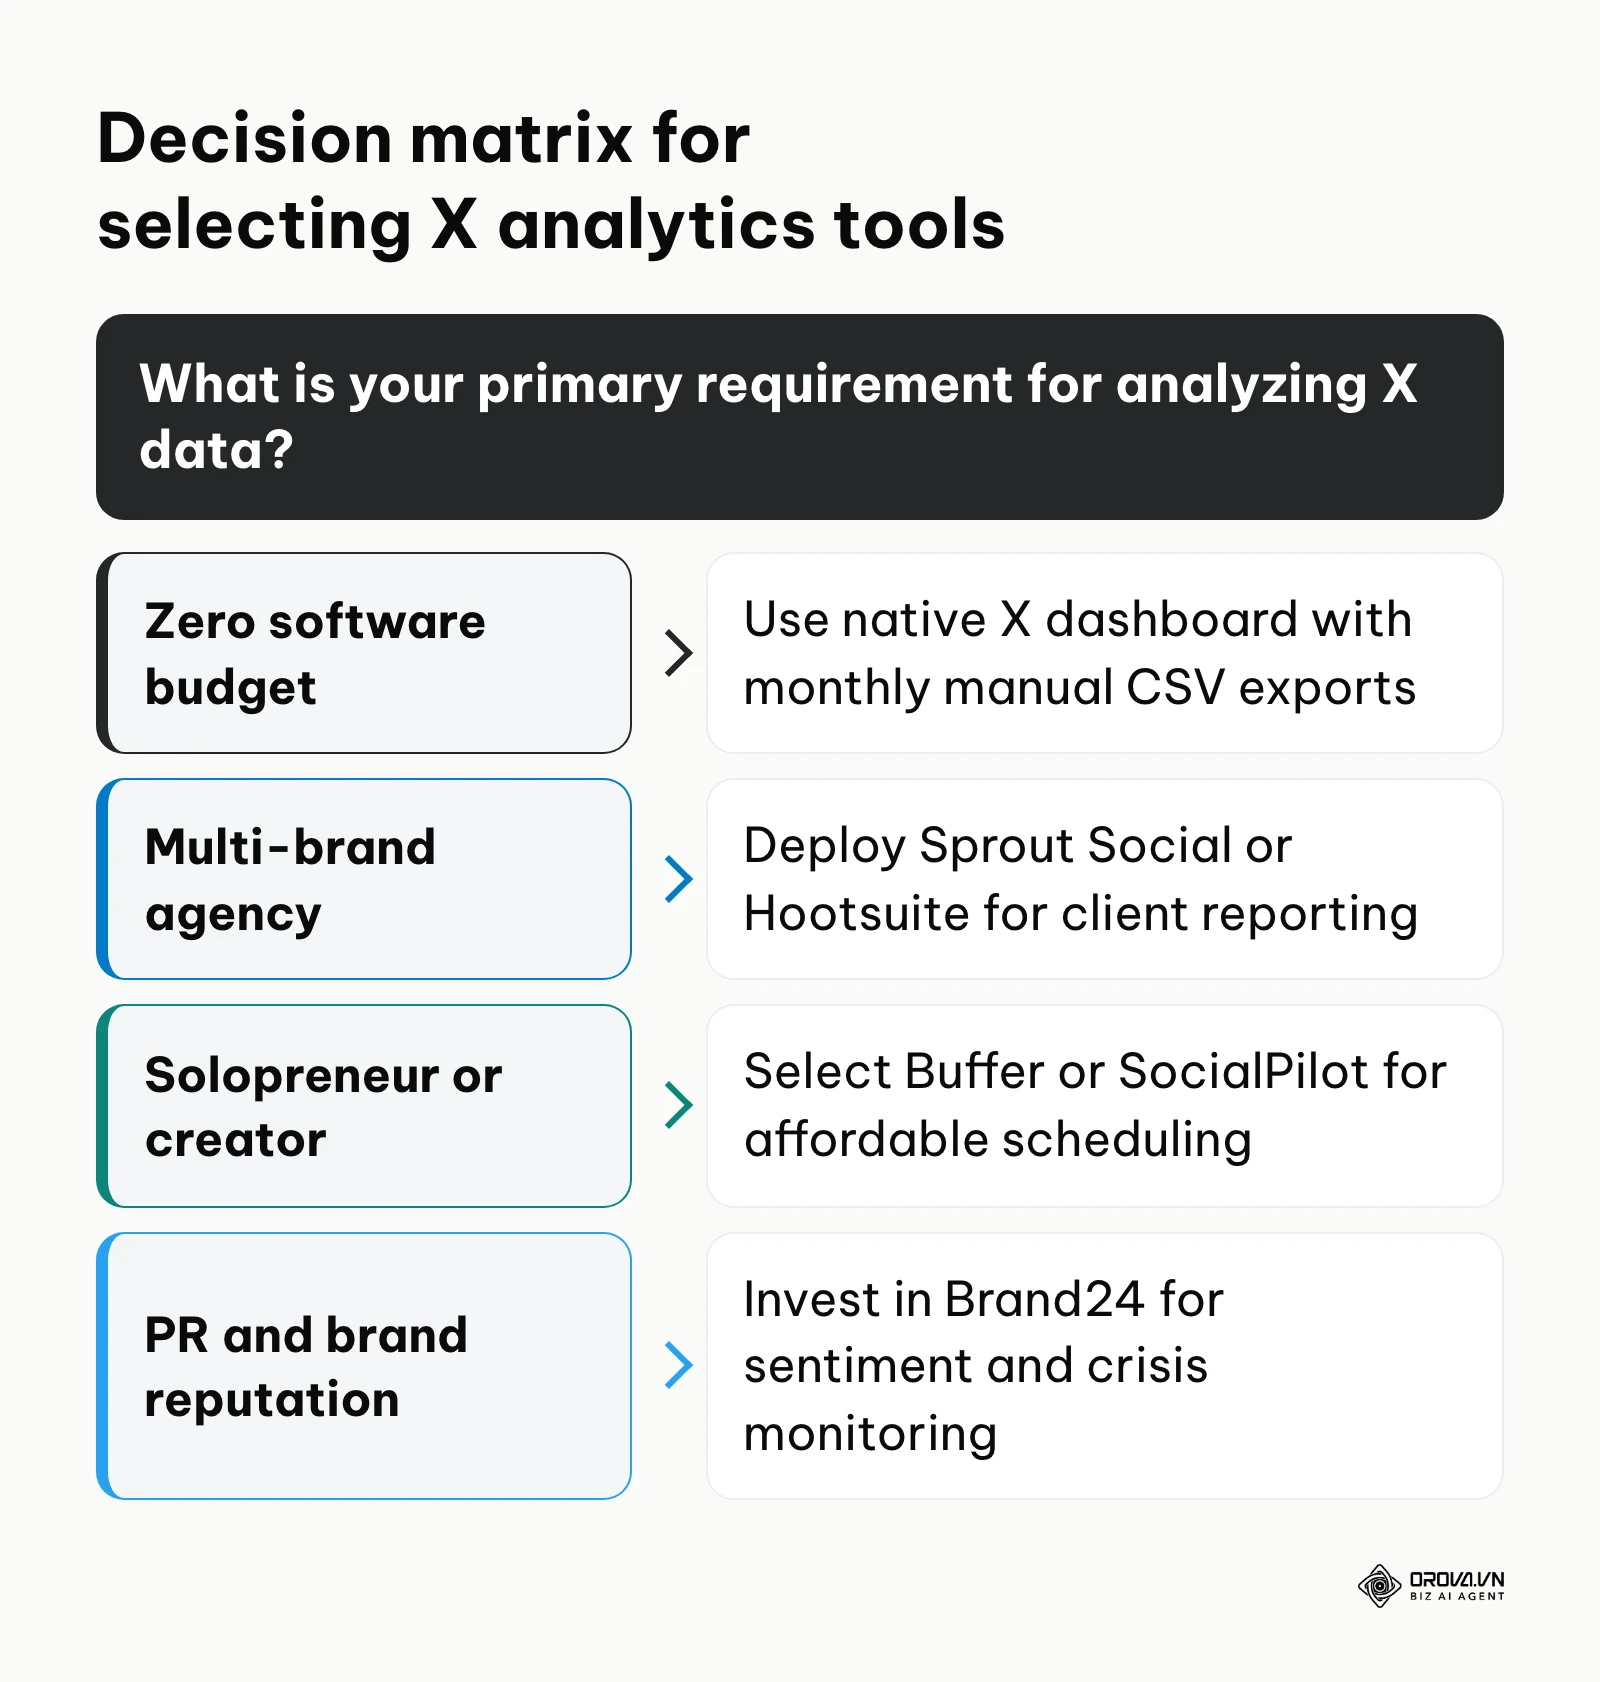
| Operational Situation | Recommended Solution | Practical Rationale |
|---|---|---|
| Solopreneur or early-stage startup with no software budget | Native X Analytics | No extra software, direct platform data, and spreadsheet tracking from exports where your tier allows. |
| Growing boutique agency managing many client social profiles | SocialPilot | Generous account allowances and automated white-label PDF reports for client delivery. |
| Mid-market brand requiring unified multi-channel reporting | Sprout Social or Hootsuite | Sophisticated cross-platform dashboards that aggregate Meta, LinkedIn, and YouTube metrics alongside X data for executive stakeholders. |
| Corporate enterprise monitoring brand PR crises and executive reputation | Brand24 | Specialized social listening and sentiment analysis that monitors untagged brand mentions across public accounts. |
| Growth team planning major product repositioning or market research | Audiense | Advanced demographic clustering and sociological affinity mapping to evaluate follower sub-communities. |
| Brand that also publishes on 8 non-X networks and wants one scheduler | Orova Social (alongside an X tool) | Draft once, schedule to 8 channels, AI captions, and vertical clips with subtitles; it does not cover X itself. |
Trends in analytic twitter over the next few years: author's perspective
Examining structural developments across social media infrastructure reveals three shifts that I believe will define how organizations track and evaluate their presence on X over the coming years.
First, I observe that the platform is moving toward semantic video comprehension and native dwell time as primary distribution signals, rather than relying on retweets and text replies. As of 2026, the algorithmic feed increasingly mimics short-form video discovery networks, prioritizing whether a user paused scrolling and watched a clip to completion. In my view, the next two to three years will see traditional impression counts lose analytical relevance, replaced by 'engaged viewing seconds' and completion ratios. Social media managers should prepare for this shift today by training their teams to audit the Video Activity Dashboard weekly and structuring hooks within the first three seconds of playback. This prediction could prove inaccurate if user pushback causes the platform to pivot back toward short text-only commentary.
Second, I expect that qualitative, AI-powered conversational clustering will largely replace generic quantitative engagement percentages. Today, most tools count a reply as a positive interaction, regardless of whether the user expressed enthusiastic agreement or criticized brand quality. I believe social listening platforms over the next few years will automatically categorize comment sections into nuanced sentiment vectors, evaluating audience intent, product feature requests, and buyer readiness scores in real time. Marketing teams should begin auditing comment sentiment manually in monthly reviews so they understand how their audience communicates before relying entirely on automated scoring models. However, severe API rate limits or excessive data scraping pricing could delay the widespread rollout of these deep semantic analysis tools for smaller businesses.
Third, I anticipate a widening division between closed native analytics environments and unified third-party data ecosystems. As platform architectures become increasingly proprietary, native dashboards will restrict advanced features like demographic modeling to high-tier enterprise subscriptions, while independent social suites will focus on cross-channel orchestration across decentralized networks. In my perspective, businesses should avoid relying exclusively on any single platform's closed reporting dashboard. Developing internal data pipelines that archive raw CSV data into independent data warehouses or reporting templates ensures long-term operational resilience. If platform API policies become more open and standardized across the web, this fragmentation risk could diminish significantly.
Frequently asked questions about analytic twitter
How can free X accounts preserve analytics history beyond 28 days?
Any account that can export data can preserve history indefinitely with a consistent monthly export routine; if your tier does not include export, log key post numbers into a spreadsheet each week instead. On the first day of every month, download the account and post activity files for the preceding month. Store these files in an organized cloud storage directory or import them into a persistent Google Sheets or Looker Studio reporting dashboard. This practice ensures your historical records remain accessible regardless of native platform visualization limits.
Is Twitter engagement rate calculated by impressions or followers in 2026?
Modern social media practitioners calculate engagement rate on X exclusively by dividing total engagements by total impressions. Because algorithmic distribution in the For You tab regularly serves content far beyond an account's existing follower list, calculating engagement against follower totals distorts content efficiency. Benchmarking performance against impressions (True Engagement Rate) provides an accurate reflection of how effectively your hook and message resonated with readers who actually saw the post.
How do external links impact tweet distribution and conversion tracking?
The recommendation algorithm applies a distribution penalty to updates containing external destination links, seeking to maximize user dwell time inside the platform. Posts with outbound links often reach noticeably fewer people than native text or media posts. To mitigate this penalty, publish comprehensive native educational content and place your tracking link inside the first reply, or use native long-form articles. Ensure all destination URLs feature complete UTM parameters to track conversions accurately in Google Analytics.
What is the role of artificial intelligence in modern Twitter analytics?
Artificial intelligence in social analytics has advanced beyond basic keyword matching to perform deep semantic sentiment analysis and predictive engagement modeling. Modern AI engines categorize thousands of conversational replies into thematic clusters, identifying customer pain points, purchase intent, and emerging PR risks. Furthermore, AI tools help teams generate contextual editorial variations and optimize publishing schedules based on predictive audience activity patterns.
Is upgrading to X Premium or Verified Organizations necessary for analytics?
It depends on what your account can see today. Every post shows a public view count, but X has moved parts of the account-level dashboard and data export behind X Premium or Verified Organizations at different times. Open the Analytics menu on your own account first: if it already gives you post activity and export, you do not need to upgrade for basic tracking; if it does not, compare the subscription against a third-party tool that connects through X's official access.
What is considered a good benchmark engagement rate on X?
There is no universal number, because rates differ by industry, account size, and format. A practical approach is to calculate True Engagement Rate on impressions for your last 90 days, treat the median as your baseline, and judge each post against it. Follower-based rates look far smaller on X and are less useful for comparing posts.
Where should you start with analytic twitter?
Improving your performance measurement does not require subscribing to expensive enterprise software suites on day one. Your immediate action depends on your current operational maturity:
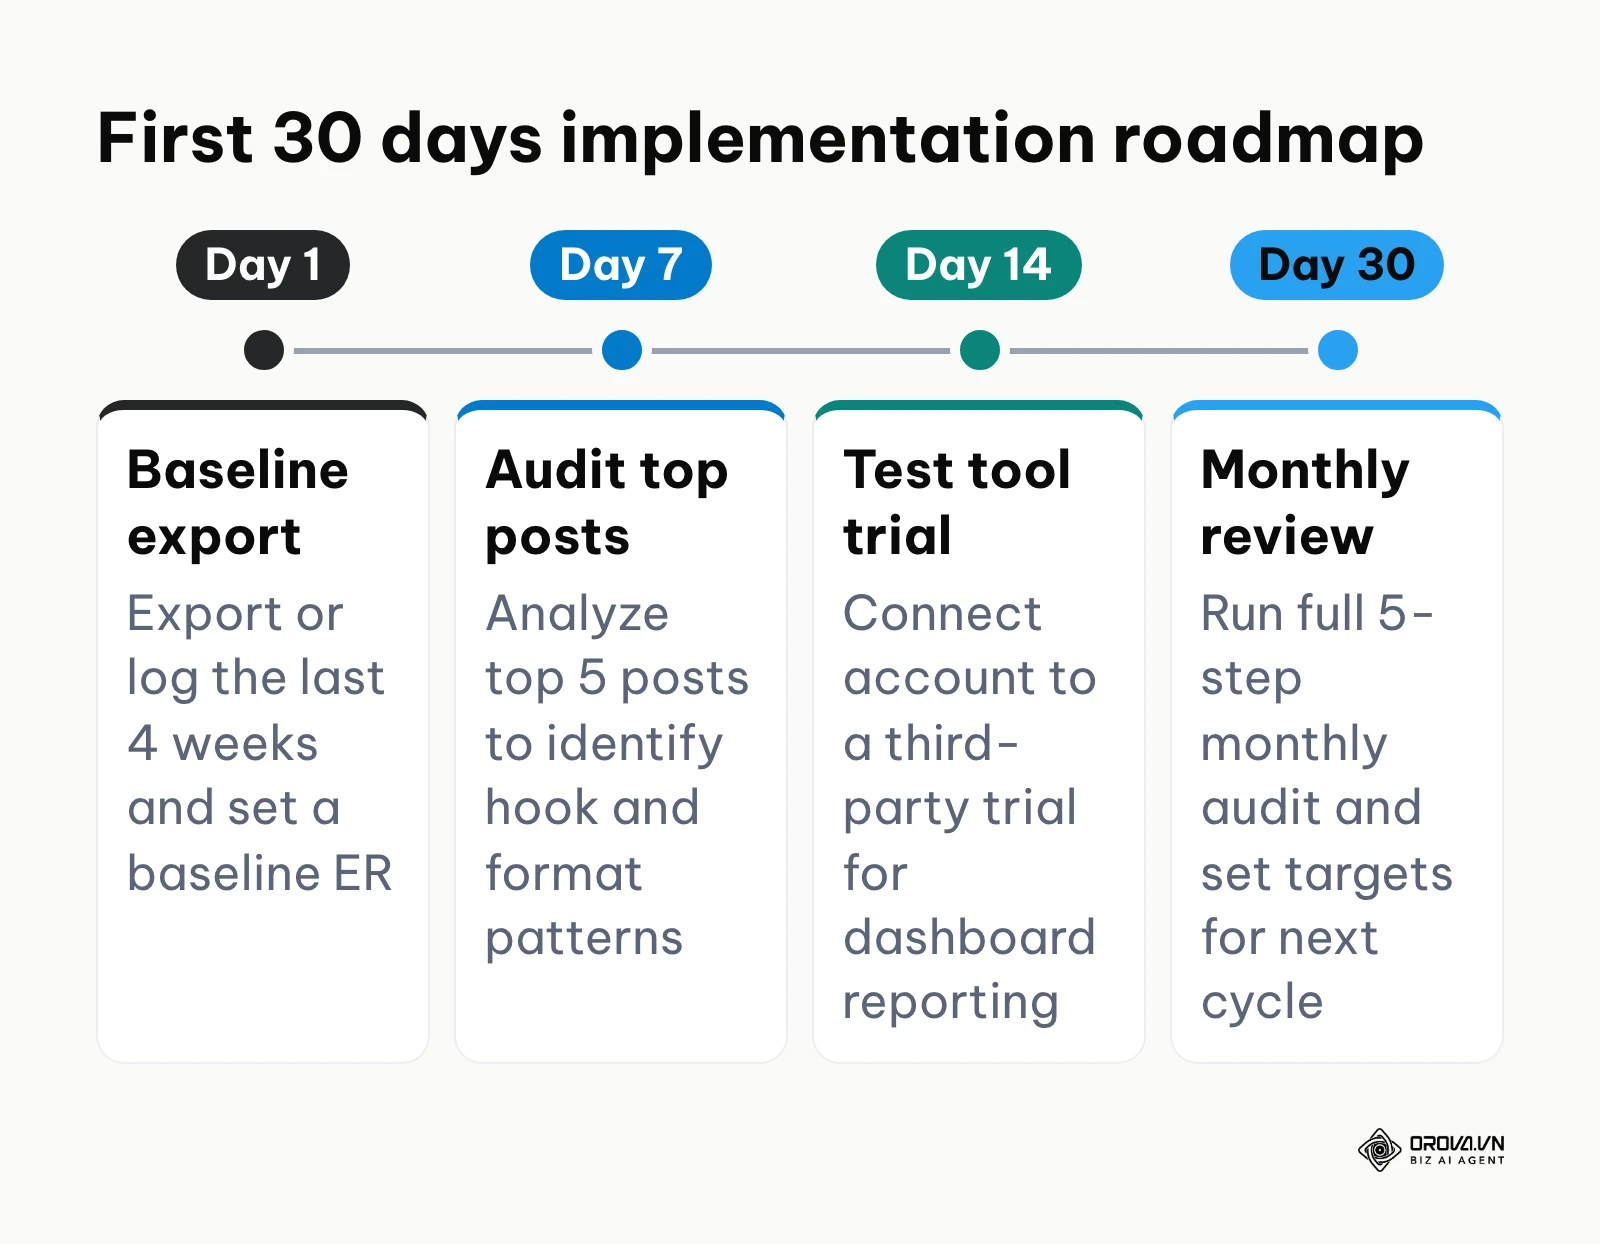
If you are an individual founder or creator operating with an unverified profile, open your native X Analytics dashboard this afternoon. Download or log your post activity for the past four weeks, calculate your baseline True Engagement Rate across your last 20 published posts, and identify the single format that generated your highest interaction total.
If you are a growing business noticing unpredictable reach swings, audit your recent video and multimedia updates. Open your video analytics to examine early drop-off, eliminate protracted introductory title sequences from your video templates, and test moving outbound destination links into the first reply of your next three content threads.
If you lead an active marketing agency managing cross-platform brand distribution, audit your monthly software expenditures against client reporting requirements. Evaluate whether high per-seat platforms justify their cost, or if deploying an affordable, white-labeled reporting tool like SocialPilot can fulfill your reporting obligations while freeing budget for creative production.
By establishing clean baseline benchmarks and reviewing retention metrics consistently each week, your team can build a predictable growth engine powered by reliable analytic twitter data.
About the author

Builder of Orova
Nguyễn Đỗ Trọng Ân has 8 years of experience in marketing, including 6 years managing market development across Asia. He builds Orova, a Biz AI Agent that never sleeps: it plans, runs and optimizes work for businesses.
Run your business with AI Agents
Orova is the always-on Biz AI Agent — it plans, runs, and optimizes the work for you.
Save time, unlock productivity.