
Social network advertising: how to launch and scale in 7 steps (2026)

Social network advertising means paying social platforms such as Facebook, Instagram, TikTok, and LinkedIn to show your ads in their feeds, where the platform's algorithm decides who sees each ad and you pay per impression, click, or result. It can scale customer acquisition quickly, yet executing it profitably requires operational rigor rather than guesswork. When you complete this guide, you will have a fully functioning multi-channel paid social deployment with calibrated server-side tracking, verified audience segmentation, automated fatigue controls, and an explicit budget scaling framework. Before launching your first ad set, ensure you have active business manager administrative access across Meta, TikTok, or LinkedIn, verified domain DNS records, an initial testing budget of at least 1,500, US dollars and a repository of at least four modular creative assets. Teams operating non-transactional websites without defined conversion actions or businesses lacking basic unit economic validation should not execute paid social campaigns until their underlying offer converts organically.
What Is Social Network Advertising and How the 7-Step Workflow Operates
Social network advertising is the process of purchasing targeted, algorithmically distributed paid placements across social platforms such as Meta, TikTok, and LinkedIn to generate quantifiable customer actions. Executing an enterprise-grade campaign takes between three and five business days across seven sequential technical stages: tracking calibration, unit economic modeling, audience architecture, modular creative staging, baseline auction configuration, fatigue mitigation, and controlled vertical scaling.
At its core, social network advertising differs fundamentally from paid search. In search advertising, prospects express active intent through explicit queries. In social advertising, algorithms identify passive intent by matching user telemetry, engagement history, and lookalike profiles against advertiser bid parameters. Because social networks monetize attention within fast-scrolling algorithmic feeds, your media buying architecture must balance technical conversion data pipelines with creative resonance.
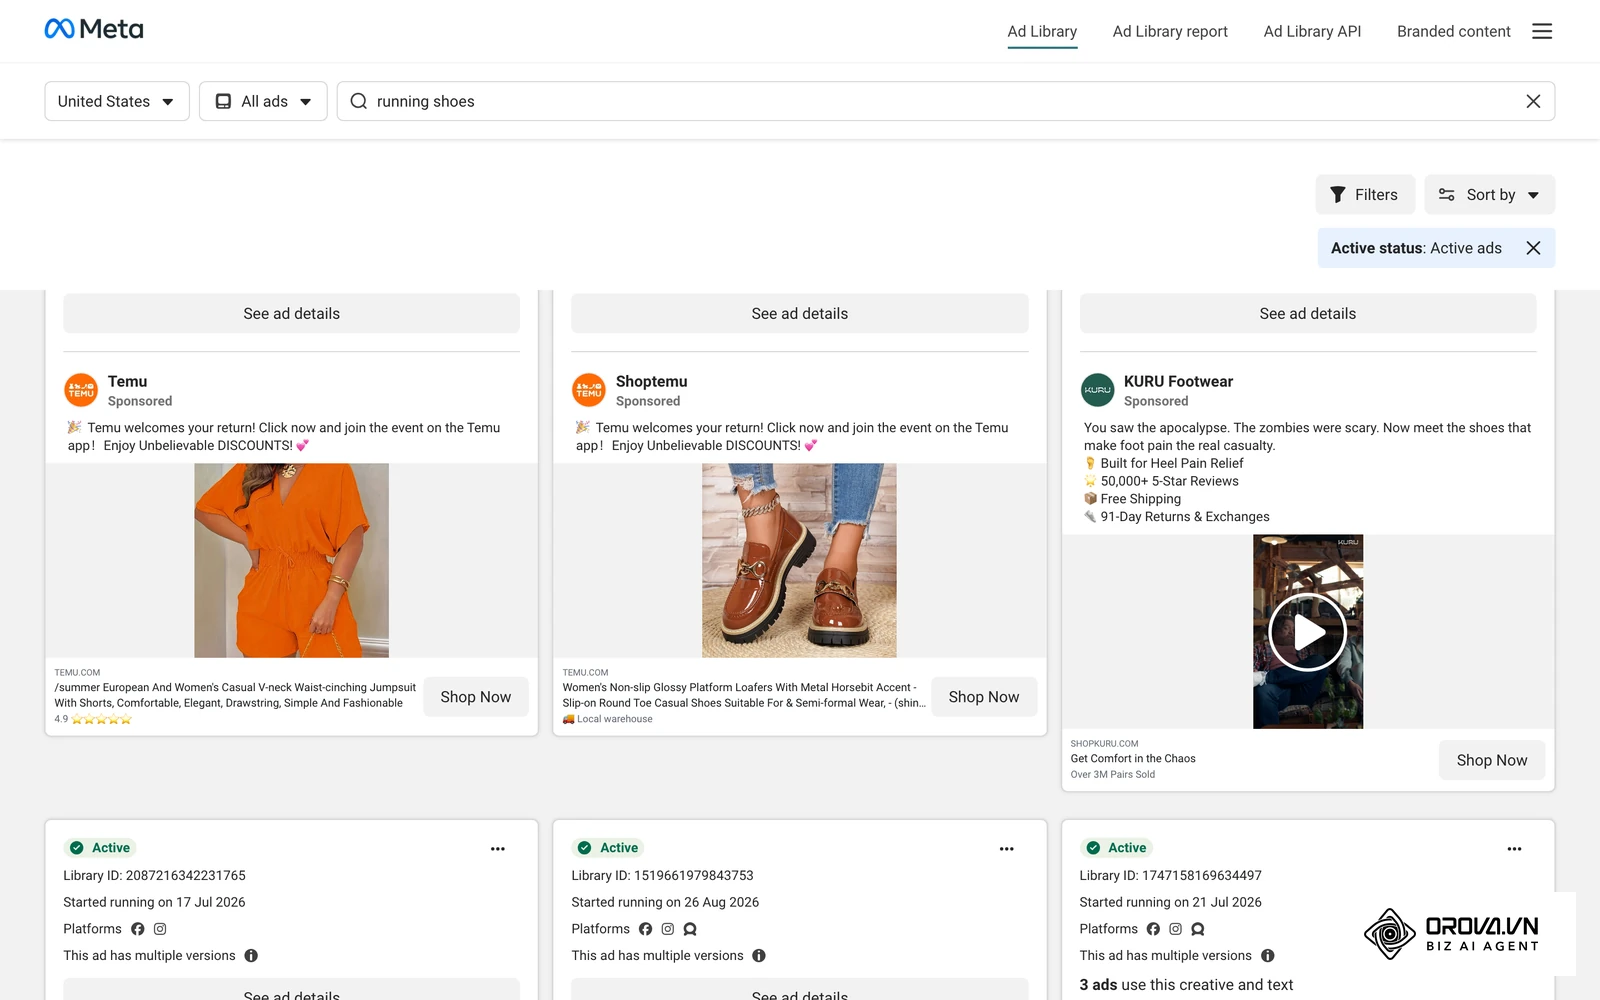
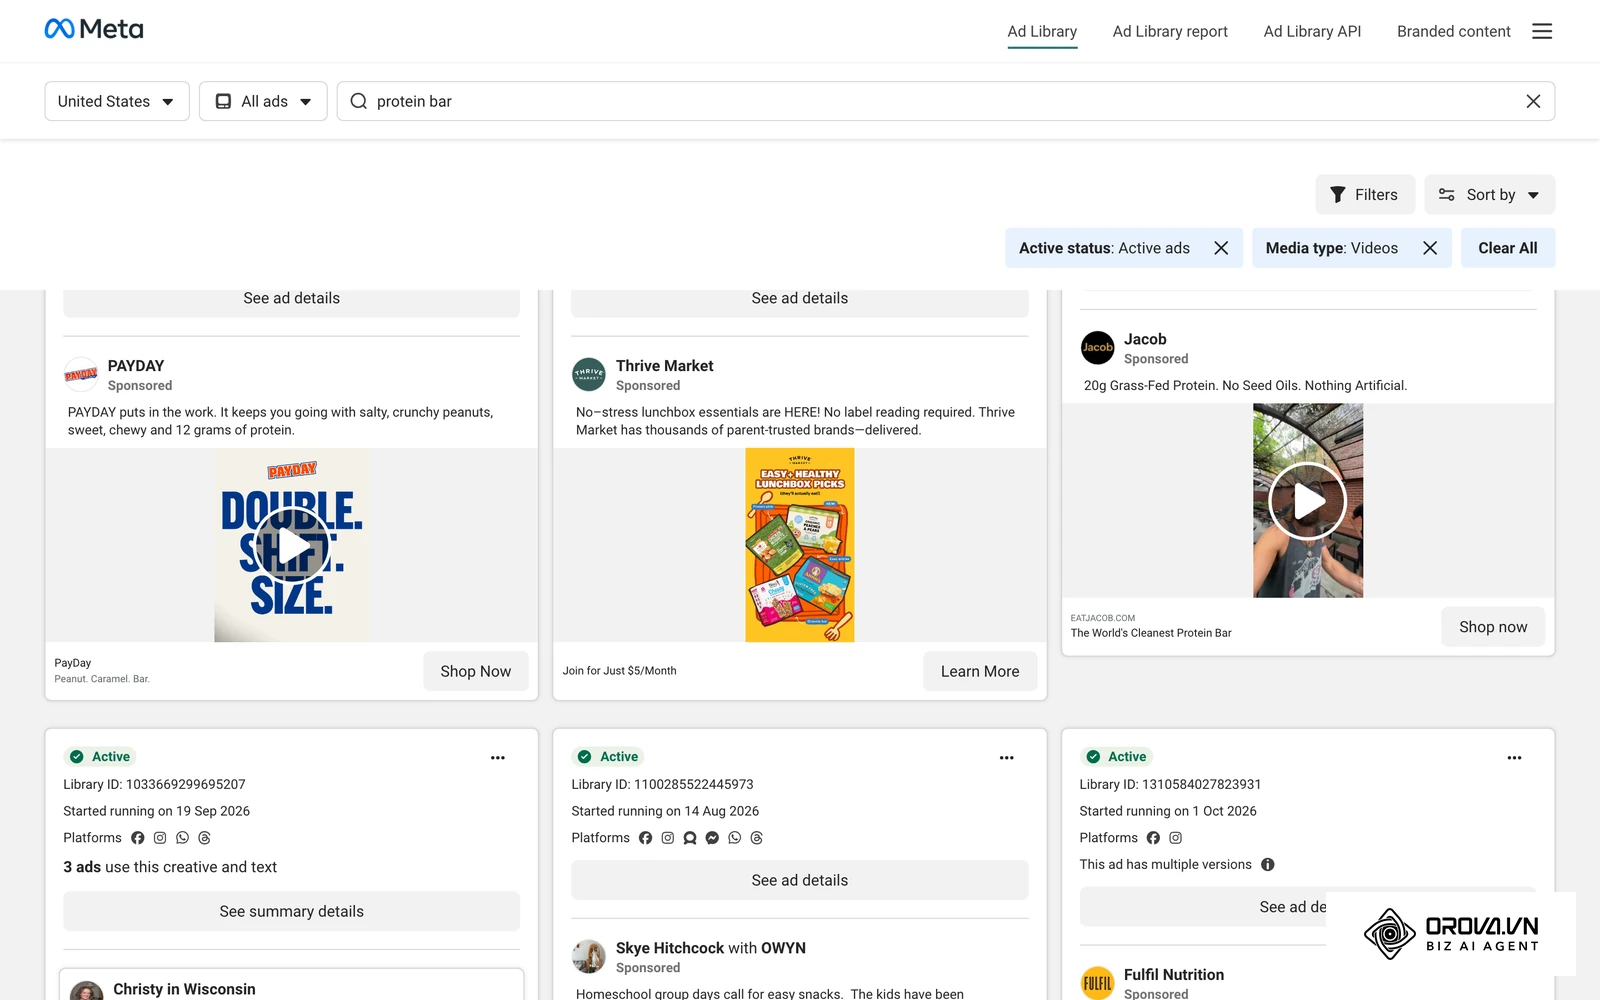
Before building anything, look at what real social ads look like right now. The Meta Ad Library below shows active ads, their formats, and launch dates for any advertiser, which makes it the fastest way to see how competitors in your niche run social network advertising.
Prerequisites: What to Prepare Before Launching Paid Campaigns
Launching paid social campaigns without audited administrative, technical, and asset prerequisites guarantees wasted media spend and resets platform learning phases prematurely.
The following table itemizes the foundational assets and credentials required before opening an ad management interface.
| Prerequisite Item | Where to Retrieve / Configure | Time Required | Risk If Missing |
|---|---|---|---|
| Business Manager & Ad Accounts | Meta Business Suite, TikTok Ads Manager, LinkedIn Campaign Manager | 30–45 minutes | Inability to establish centralized asset ownership, assign agency permissions, or run split tests |
| DNS Verification & Event Aggregation | Domain registrar DNS zone editor (Cloudflare, Namecheap, GoDaddy) | 15–30 minutes | Delivery restrictions, inability to optimize for conversion events under strict mobile privacy frameworks |
| Server-Side Access Tokens | Platform Events Manager settings (Conversions API / Events API) | 45–60 minutes | Conversion underreporting due to browser-level ad blockers and iOS Safari tracking prevention |
| Modular Creative Asset Library | Internal design repository, Google Drive, or Figma workspace | 2–4 hours | Instant creative fatigue, spiking cost per acquisition (CPA), and inability to test hook variations |
| Validated Financial Unit Economics | Internal accounting sheets, Stripe dashboard, or ERP system | 30 minutes | Blind bidding below margin thresholds, leading to unprofitable gross transaction volume |
Before committing ad spend, confirm that your administrative permissions allow full control over billing, pixels, and connected social pages. Fragmented agency permissions frequently cause unexpected campaign pauses during billing cycles.
Step 1: Audit Conversion Tracking and Implement Server-Side CAPI
Your first technical objective is establishing an infallible measurement pipeline that transmits browser events and server payloads simultaneously without creating duplicate conversions.
Step 1.1: Verify Browser-Side Pixels and Webhook Endpoints
Open Meta Events Manager, TikTok Events Manager, or LinkedIn Campaign Manager. Navigate to the Data Sources menu and inspect your active web pixel. In modern environments, relying solely on client-side JavaScript tags leaves campaigns blind to significant user cohorts. Browser extensions, privacy browsers, and mobile operating system restrictions routinely intercept client-side script execution.
Meta's Business Help Center documentation on the Conversions API explains that server-side event transmission helps recover signal lost to browser-level ad blockers and tracking restrictions. To configure server-to-server data transmission, navigate to Settings within Events Manager, scroll to the Conversions API section, and select Generate Access Token. Store this secure alphanumeric string inside your server-side environment variables or tag management container.
Client Event Payload:
{
  "event_name": "Purchase",
  "event_time": 1773489600,
  "event_id": "order_ord_98412_prod",
  "user_data": {
    "em": "4f8a... (SHA-256 hashed email)",
    "ph": "9b1c... (SHA-256 hashed phone)",
    "client_ip_address": "192.0.2.1",
    "client_user_agent": "Mozilla/5.0..."
  }
}
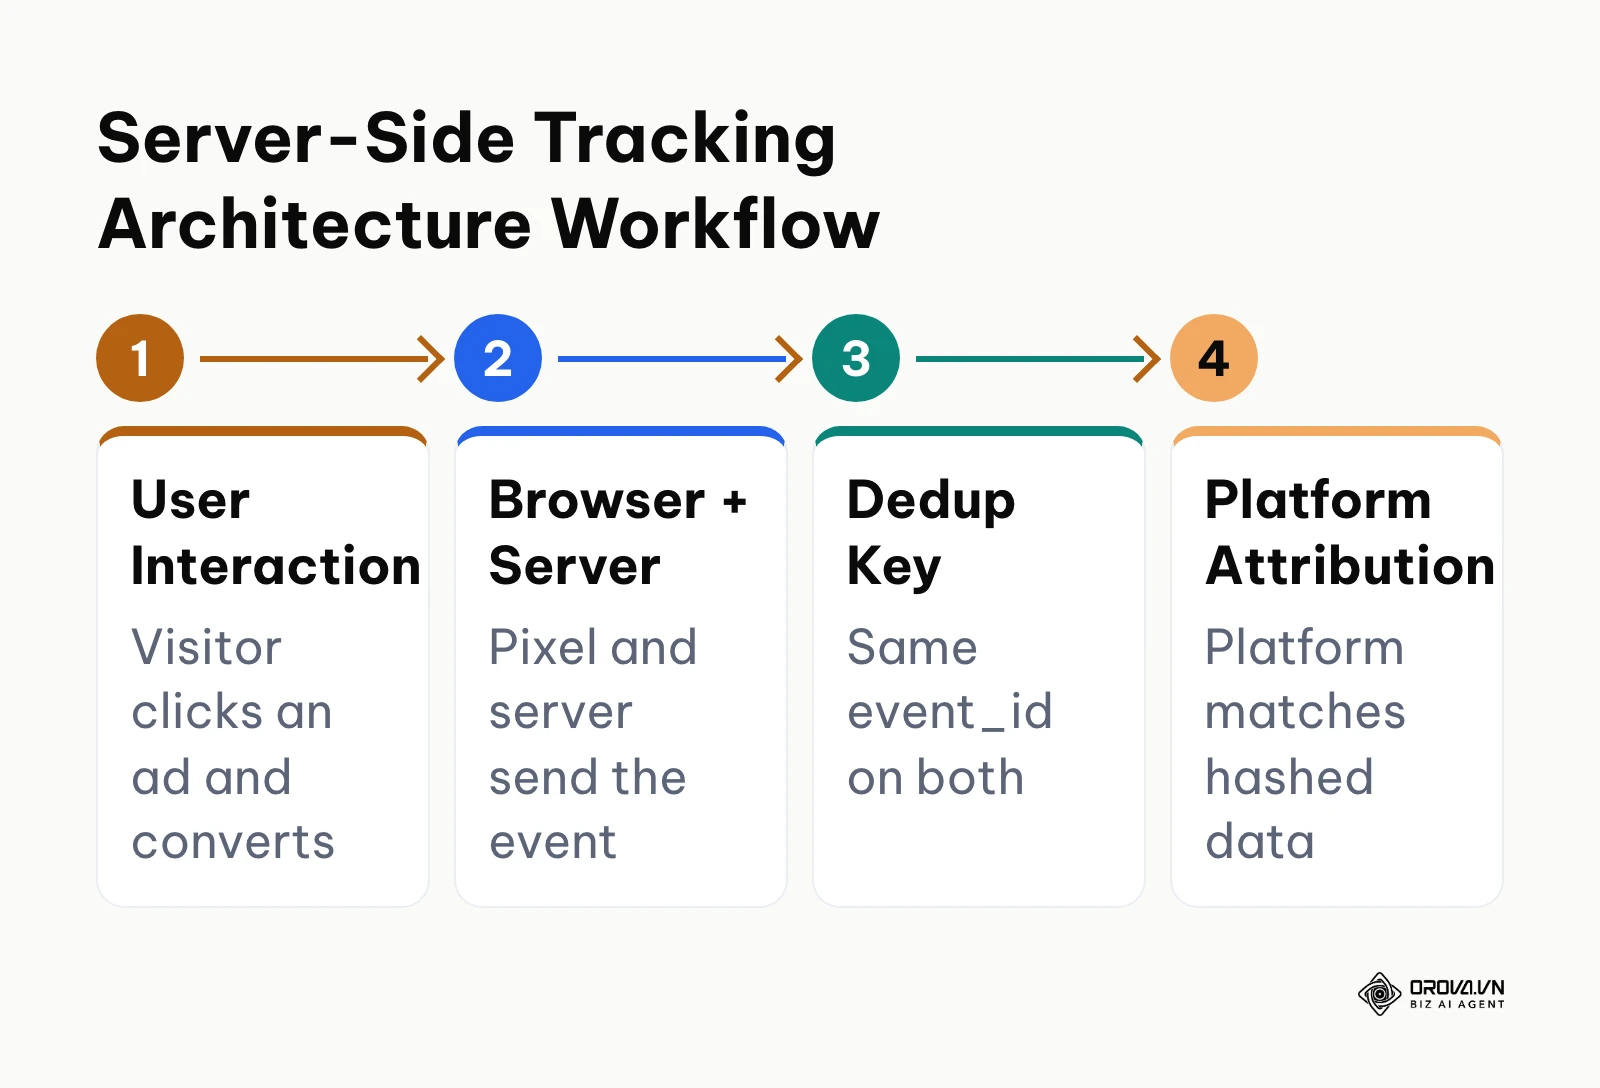
Ensure your web server generates a unique event_id string for every checkout or lead form submission. As outlined in our guide on what is a conversion event, passing identical event_id parameters across both the client-side JavaScript pixel and the server-side payload enables ad platforms to deduplicate the dual signals seamlessly.
The process flow below outlines the exact dual-stream deduplication pipeline used to route client tags and server payloads into algorithmic attribution models.
Step 1.2: Verify Event Match Quality and Parameter Integrity
Once your server endpoint dispatches payloads, inspect the Event Match Quality score within Events Manager. Platforms calculate this metric by assessing how many customer information parameters (such as hashed email addresses, phone numbers, browser IP addresses, and external click IDs like fbclid or ttclid) accompany each event payload.
The more first-party identifiers each event carries, the better the platform can match it to a user and optimize delivery. Review your data practices against standard online advertising regulations to ensure hashing occurs locally on your infrastructure before transmission.
Observable visual confirmation: In Meta Events Manager under the Overview tab, the status indicator shows active green status dots next to PageView, ViewContent, AddToCart, and Purchase. The Event Match Quality rating displays a numerical grade of 7.0/10 or higher, and the deduplication rate indicator confirms that matching events are consolidated into single counts.
Common operational failure: Event duplication or zero deduplication observed. This occurs when developers pass differing event names between the browser tag (buy_now) and the server payload (Purchase), or when the event_id variable is omitted from one channel. To resolve this, log outgoing server JSON payloads in your backend console and cross-reference them against browser network requests in Chrome DevTools to confirm matching string identifiers.
Illustrative example: An online apparel retailer with 25,000 US dollars monthly ad spend noticed their reported Meta ad conversions dropped by 32% following an e-commerce platform upgrade. The media buyer opened Google Tag Manager, verified that the browser pixel fired, and then checked Meta Events Manager. They discovered that while the browser tag fired reliably, the newly implemented server-side CAPI integration sent non-hashed customer emails, causing the platform algorithm to reject the payload. The team updated their server payload script to hash emails via SHA-256 before transmission and inserted matching order numbers into the event_id parameter. Within 48 hours, Meta Events Manager displayed an Event Match Quality score improvement from 3.2 to 8.4, restoring algorithmic bid stability.
Step 2: Calculate Break-Even ROAS and Allocate Channel Budgets
The primary operational goal of this step is determining your mathematical bidding boundaries and distributing initial capital across platforms without depleting funds before algorithmic learning completes.
Step 2.1: Establish Mathematical Break-Even Thresholds
Never launch a social advertising campaign relying on generic platform return targets. You must establish your exact break-even Return on Ad Spend (ROAS) and Target Cost per Acquisition (CPA) using your actual profit margins.
To determine your break-even metrics:
- Identify your Average Order Value (AOV) or Customer Lifetime Value (LTV).
- Deduct Cost of Goods Sold (COGS), payment gateway transaction fees, and operational fulfillment costs.
- Calculate your Gross Profit Margin percentage: (Gross Profit ÷ Revenue) × 100%.
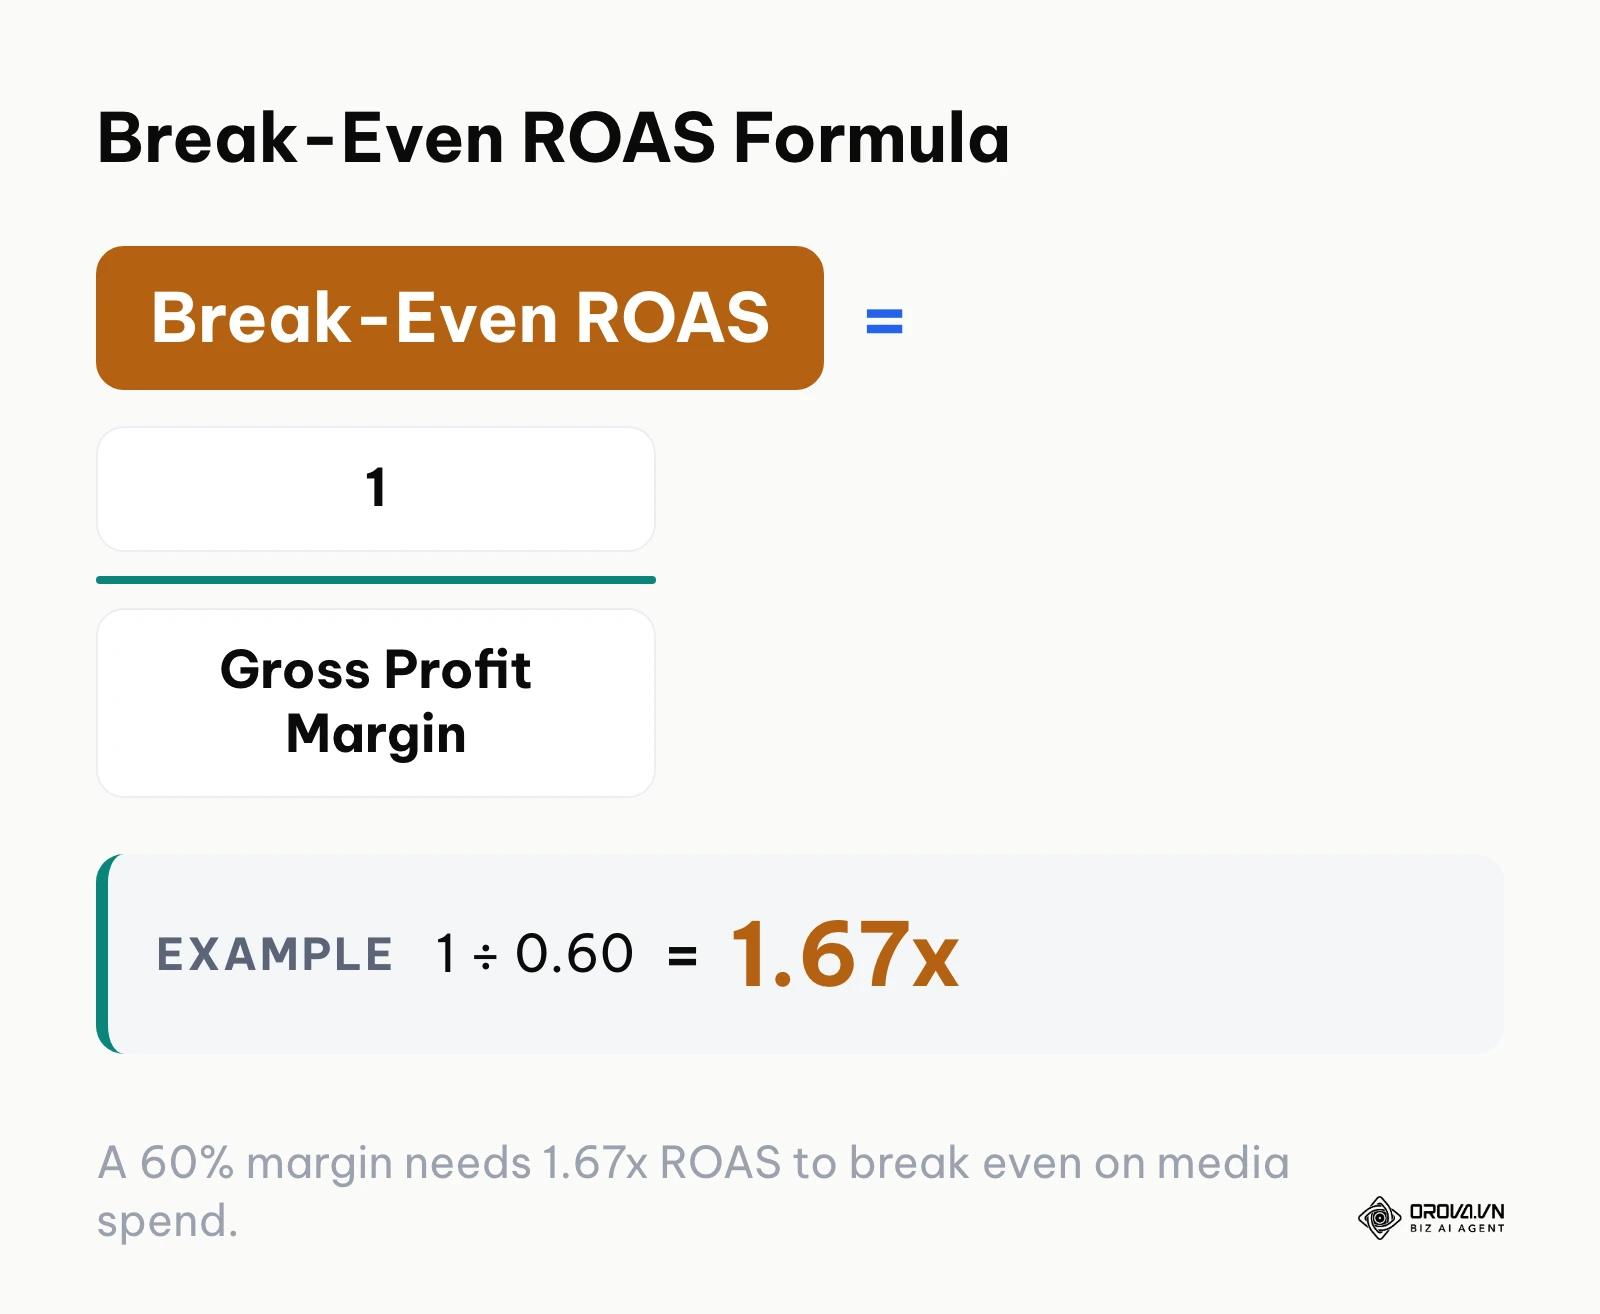
- Derive Break-Even ROAS: 1 ÷ Gross Profit Margin.
- Establish Maximum Allowable CPA: AOV × Gross Profit Margin.
If your store sells a 120-dollar item with 48 US dollars in direct COGS and merchant fees, your gross profit is 72 US dollars (a 60% margin). Your break-even ROAS is 1 ÷ 0.60 = 1.67x, and your maximum allowable CPA is 120 × 0.60 = 72 US dollars. Any campaign acquiring customers below 72 US dollars operates profitably; any acquisition exceeding 72 US dollars loses capital on the initial transaction.
Step 2.2: Reference Industry Cost Benchmarks and Allocate Budgets
When structuring initial media plans, use realistic industry benchmarks to forecast initial click and impression volume across Meta, TikTok, and LinkedIn.
Exact costs move with season, country, and auction pressure, so treat the table below as a relative planning guide for eight common sectors rather than a price list, and replace it with your own account data after the first two weeks.
| Advertising Platform | Industry Sector | Relative CPC | Relative CPM | What usually drives cost |
|---|---|---|---|---|
| Meta (FB/IG) | E-commerce (Apparel & Goods) | Low to medium | Medium | Seasonal peaks such as Q4 sales |
| Meta (FB/IG) | B2B SaaS & Tech Services | High | High | Narrow job-related audiences |
| Meta (FB/IG) | Higher Education & Courses | Medium | Medium | Enrollment deadlines |
| Meta (FB/IG) | Healthcare & Telehealth | Medium to high | Medium to high | Ad policy limits on targeting |
| TikTok Ads | E-commerce (Impulse / D2C) | Low | Low | Creative freshness |
| TikTok Ads | Mobile Gaming & Apps | Low | Low | Install volume competition |
| TikTok Ads | F&B / Quick Service Dining | Low | Low | Local audience size |
| LinkedIn Ads | Enterprise Software & FinTech | Very high | Very high | Job title and company targeting |
Step 2.3: Case Study of a 3,000-Dollar Monthly Allocation Model
When allocating a standard monthly media budget of 3,000 US dollars (about 100 US dollars per day), split your spend according to the 70/20/10 capital preservation framework:
- Core Scaled Delivery (70% = 2,100 US dollars per month or 70 US dollars per day): Deployed into your proven baseline broad-interest and custom conversion ad sets.
- Creative & Audience Sandbox (20% = 600 US dollars per month or 20 US dollars per day): Isolated into testing ad sets to evaluate new angles and formats without disrupting learning on main sets.
- Re-engagement & Retention (10% = 300 US dollars per month or 10 US dollars per day): Directed at high-intent cart abandoners and past customer cross-sells.
To measure total impact across paid channels, track your Marketing Efficiency Ratio (MER), calculated as Total Business Revenue ÷ Total Paid Social Media Spend. If your 3,000 US dollars ad spend generates 12,000 US dollars in gross revenue, your blended MER is 4.0x, providing a realistic check against siloed platform attribution figures.
For teams managing restricted budgets under 1,500 US dollars per month, do not split funds across multiple ad platforms. Allocate 100% of capital into a single ecosystem (typically Meta for direct-response e-commerce or LinkedIn for high-ticket B2B) to ensure the platform algorithm achieves the minimum threshold of 50 weekly conversion events needed to exit the learning phase.
Observable visual confirmation: Your campaign budget settings in Meta or TikTok Ads Manager display daily budgets conforming exactly to your 70/20/10-dollar structure, with maximum bid caps (if utilizing Cost Caps) set below your pre-calculated maximum allowable CPA.
Common operational failure: Allocating a micro-budget of 5 US dollars per day across ten competing ad sets. This fragments data delivery, causing every ad set to become trapped in platform "Learning Limited" status. To fix this, consolidate fragmented ad sets into one broad ad set funded with at least 3x to 5x your target CPA per day.
Step 3: Run Audience Overlap Audits and Structure Exclusion Lists
The technical objective of this step is auditing custom audience overlaps to eliminate self-competition in the ad auction, which inflates CPMs and degrades ROAS.
Step 3.1: Audit Shared Profiles Using Overlap Diagnostics
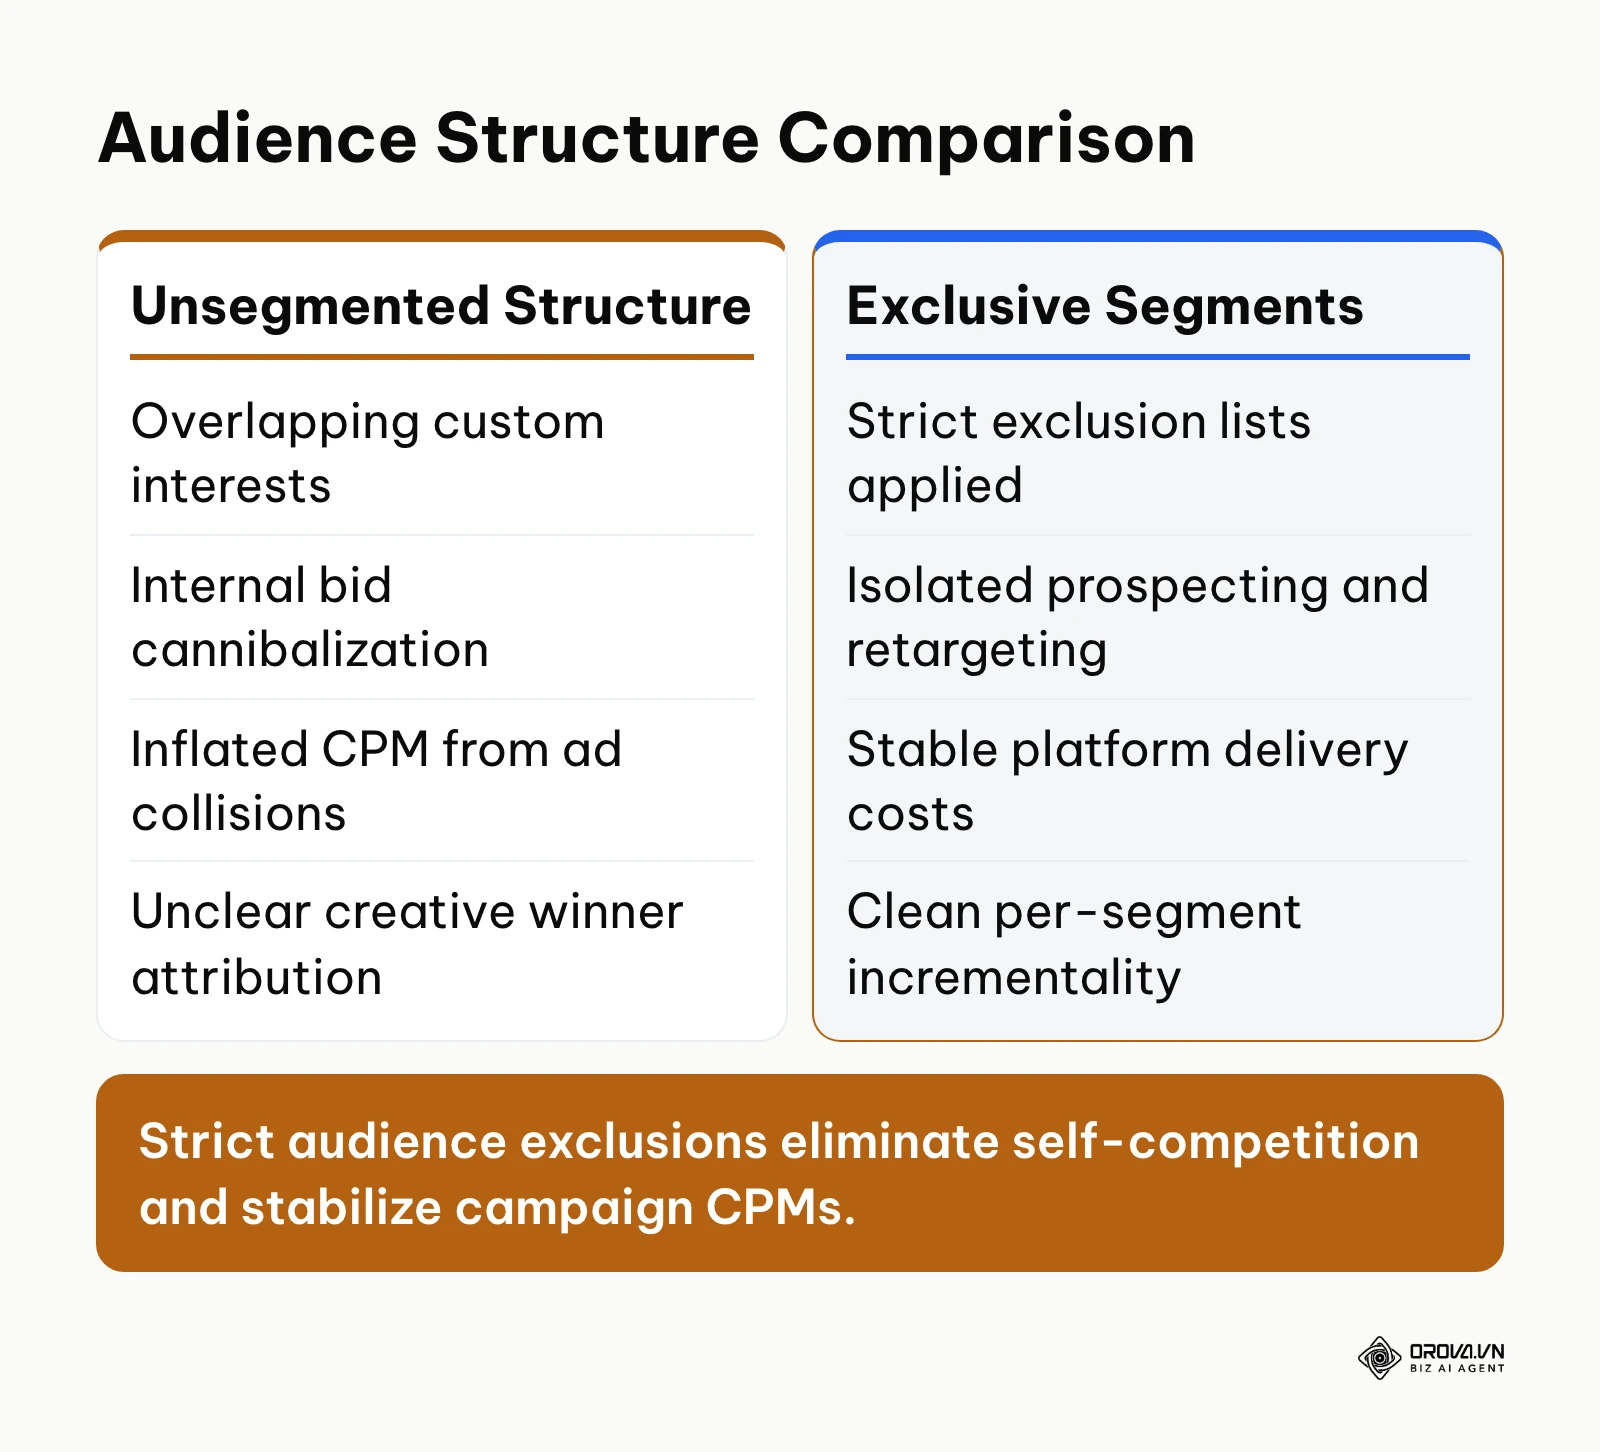
When an advertiser runs multiple ad sets targeting similar customer segments (for instance, one ad set targeting an engaged email list and another targeting a 1% lookalike audience), both ad sets compete against each other in the exact same ad auction. This issue, known as auction overlap or internal cannibalization, forces your own ad sets to drive up their own bid prices.
To diagnose audience overlap in Meta:
- Open Meta Ads Manager and select the Audiences tool from the left navigation panel.
- Select two or more custom or lookalike audiences using the checkboxes.
- Click the three horizontal dots in the action bar and select Show Audience Overlap.
- Review the overlap percentage matrix.
If your audience overlap exceeds 25%, running these groups in separate simultaneous prospecting ad sets causes self-competition.
The comparison below highlights the operational difference between competing, non-excluded audience sets and clean, segregated delivery architecture.
Step 3.2: Implement Systematic Exclusion Rules
To ensure complete audience isolation, implement strict exclusions at the ad set configuration level:
- In top-of-funnel (TOFU) prospecting ad sets: Exclude 180-day website visitors, 365-day social page engagers, and all past customer lists.
- In middle-of-funnel (MOFU) consideration ad sets: Target 90-day social page engagers and 30-day video viewers, while strictly excluding 30-day purchasers and cart abandoners.
- In bottom-of-funnel (BOFU) retargeting ad sets: Target 14-day add-to-cart users while excluding all completed 30-day purchasers.
Exclusion Rule Architecture:
+-----------------------------------------------------------+
| TOFU Prospecting Set: Broad Interests / Lookalikes       |
| EXCLUDE: 180d Web Visitors, 365d Page Engagers, Customers|
+-----------------------------------------------------------+
                             |
                             v
+-----------------------------------------------------------+
| MOFU Engagement Set: 90d Engagers / Video Viewers         |
| EXCLUDE: 14d Cart Abandoners, 30d Purchasers             |
+-----------------------------------------------------------+
                             |
                             v
+-----------------------------------------------------------+
| BOFU Conversion Set: 14d Add-to-Cart / Checkout Initiated |
| EXCLUDE: 30d Purchasers                                   |
+-----------------------------------------------------------+
Observable visual confirmation: The Audience Definition card in your Ad Set editing pane displays negative parameter tags (marked in red or labeled "Exclude") containing your customer and pixel visitor lists, with estimated audience reach reflecting net unreached prospects.
Common operational failure: Forgetting to exclude past purchasers, resulting in high delivery frequencies toward customers who purchased within the last 24 hours. To resolve this, create a dynamic Custom Audience based on the Purchase event (retention set to 180 days) and apply it as a global exclusion across all non-retention ad sets.
Illustrative example: A B2B software company running LinkedIn ads noticed their average Cost per Lead climbed from 85 US dollars to 190 US dollars over three weeks. The performance lead reviewed their campaign architecture and discovered that three distinct campaigns were running simultaneously: one targeting IT Directors by job title, one targeting members of enterprise IT groups, and one targeting accounts on their CRM list. Using the platform's audience forecasting diagnostics, they realized that 48% of the member profiles in the group campaign also existed in the job title campaign, resulting in bidding collisions against their own ads. The media buyer restructured the account by setting the CRM account list as the master targeting group and using job title filters as an internal narrowing parameter, while excluding existing pipeline contacts. Within five business days, ad frequency normalized, eliminating bidding collisions and reducing the average Cost per Lead back to 92 US dollars.
OROVA ADS applies AI Agent to automate and optimize ad performance on Google, Meta and TikTok. Scale your budget safely, monitor 24/7 and expand your business quickly.
Experience the solution at orova.vn/ads
Step 4: Build a Modular Creative Testing Sandbox
Your goal in this step is establishing a structured creative iteration environment that isolates variables (hook, visual body, call-to-action) rather than deploying random disparate videos.
Step 4.1: Construct the Modular Asset Framework
Creative quality is one of the biggest levers in paid social performance. However, producing entirely new creative concepts from scratch for every test drains production resources. Instead, adopt a modular asset testing matrix based on interchangeable components:
- Hooks (Seconds 0–3): Problem callout, counter-intuitive statement, visually striking motion, or direct question.
- Bodies (Seconds 4–20): Product mechanism, feature demonstration, customer testimonial, or data breakdown.
- CTAs (Seconds 21–30): Specific direct-response offer, discount prompt, or direct guarantee.
Modular iteration also keeps ads alive longer than running one unvaried master asset. By combining three distinct hooks with two visual bodies and two calls-to-action, you generate twelve unique testable variations from a single production session.
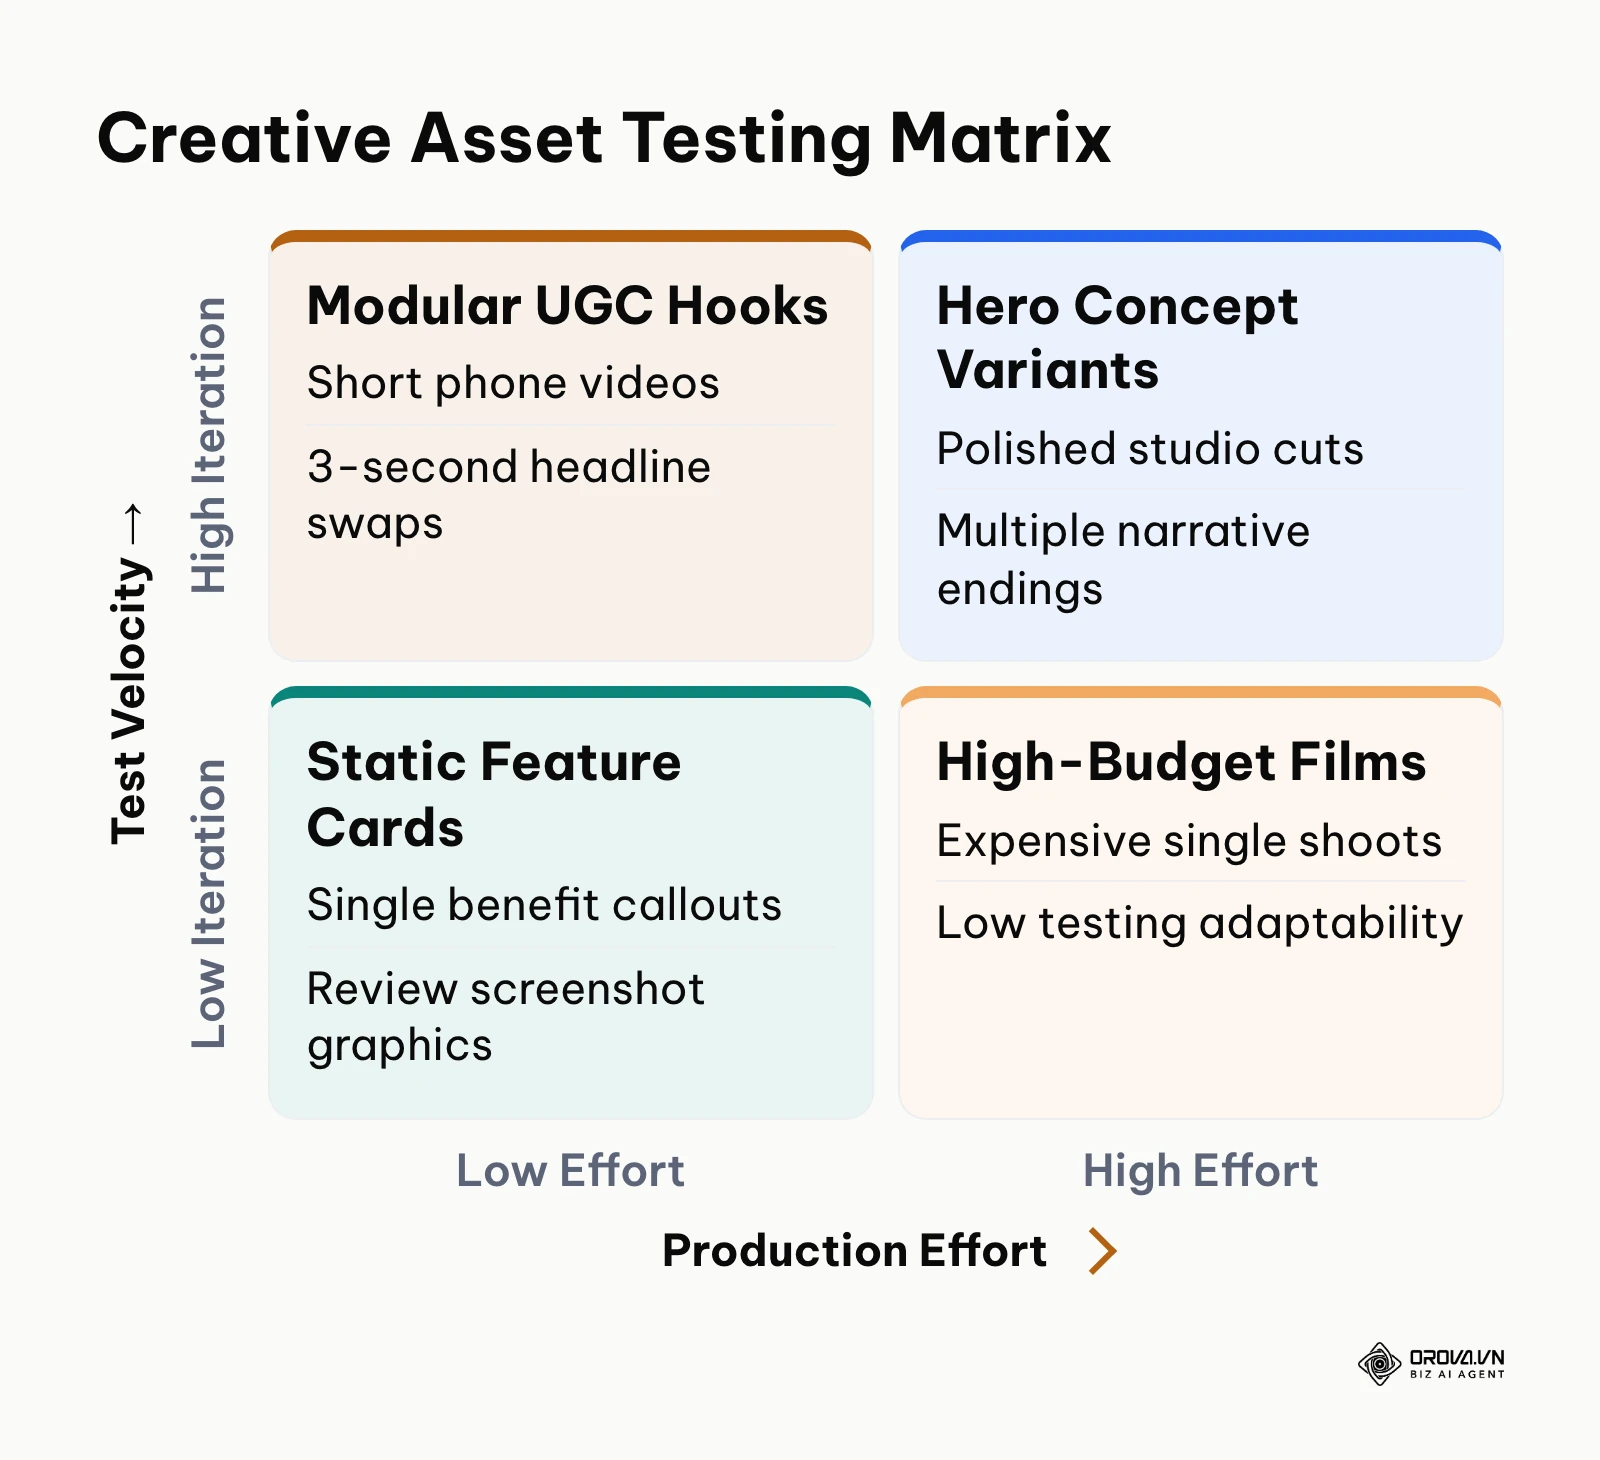
The matrix below illustrates how to categorize and prioritize your creative formats based on production resource allocation and iteration velocity.
Step 4.2: Configure the Testing Ad Set
Create a dedicated campaign named SANDBOX_CREATIVE_TESTING using Ad Set Budget Optimization (ABO) rather than Campaign Budget Optimization (CBO/Advantage+). When testing new assets:
- Keep the audience broad and completely constant across all test ad sets (for example, US Broad 25–54 with zero interest layering).
- Deploy three to five ad variations inside each ad set, altering only the opening hook variable while holding thumbnail, headline, and copy identical.
- Fund the ad set with a daily budget equal to 1.5x your target CPA.
- Run the sandbox until each variation receives at least 1,500 impressions or spends 1x target CPA.
Identify the winning asset using leading engagement indicators: outbound Click-Through Rate (CTR) above 1.2%, Thumb-Stop Rate (3-second video views ÷ impressions) above 30%, and Cost per Outbound Click below your historical benchmark.
Observable visual confirmation: The ad management reporting grid shows three active ads with identical primary copy and landing page URLs, showing distinct statistical divergence in Hook Rate (3-second plays ÷ total impressions) within 48 hours of initial delivery.
Common operational failure: Declaring a creative asset a failure after only spending 10 US dollars when target CPA is 50 US dollars. Cutting ads prematurely prevents the ad auction from finding high-propensity users. Ensure every test variation spends at least 1x to 1.5x target CPA before pausing.
Step 5: Configure Bid Strategies and Launch Baseline Campaigns
The objective of this step is selecting appropriate algorithmic bidding methods, assembling final structural campaign elements, and initiating delivery.
Step 5.1: Select the Proper Bidding Mechanism
Modern social platforms provide three primary bidding configurations:
- Lowest Cost / Highest Volume (Auto Bid): The algorithm spends your entire daily budget while attempting to secure the maximum number of conversions. Ideal for initial testing, smaller budgets, and identifying baseline market costs.
- Cost Cap / Target Cost: You instruct the algorithm to acquire conversions at an average target CPA (for example, target CPA of 40 US dollars). The auction only bids when user conversion probability meets that target. This protects margins, but delivery will halt if your bid cap is set unrealistically low.
- Bid Cap / Maximum Bid: You set an absolute ceiling on the maximum amount the platform can bid in an individual ad auction. Recommended only for advanced media buyers managing high-volume enterprise spend.
For your initial campaign rollout, configure your baseline scaling campaign using Lowest Cost to allow the algorithm uninhibited delivery, then transition toward Cost Caps once stable baseline CPA benchmarks are established.
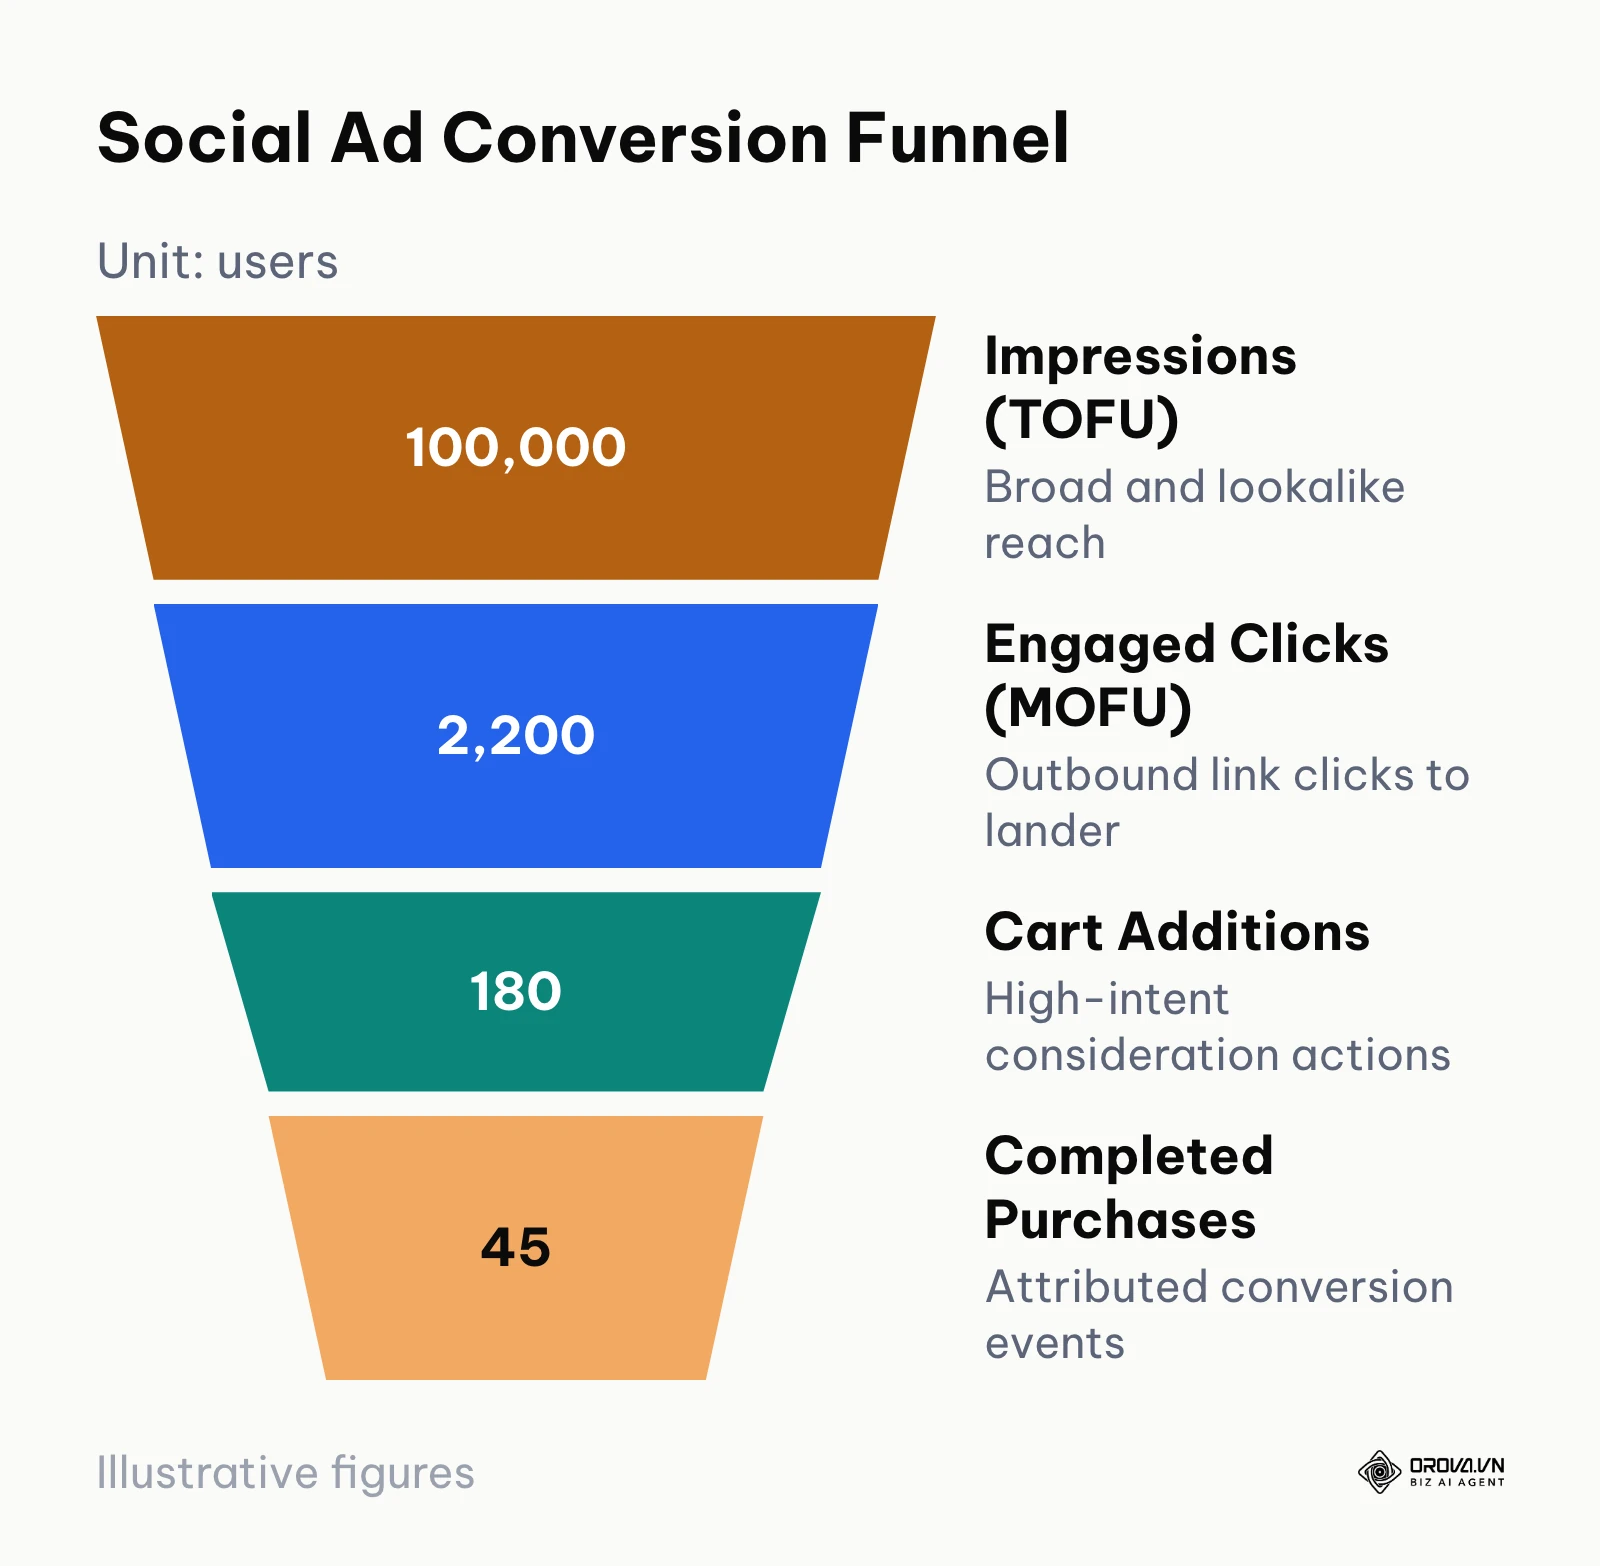
The full-funnel diagram below uses illustrative numbers: 100,000 impressions lead to 2,200 outbound clicks, 180 cart additions, and 45 completed purchases.
Step 5.2: Assemble Campaign Settings and Enable Delivery
- In Meta Ads Manager, click the green Create button.
- Select Sales or Leads as the campaign objective (never use Awareness or Traffic objectives for direct-response marketing).
- Under Campaign settings, choose Advantage Campaign Budget (CBO) if deploying proven winners across multiple audiences, or Ad Set Budget (ABO) if retaining manual budget control.
- Set conversion location to Website, select your verified Pixel, and designate Purchase or Lead as the conversion event.
- In the Placements section, select Advantage+ Placements (Automatic Placements) to maximize delivery liquidity across Feeds, Stories, Reels, and Search feeds.
- Paste your verified landing page URLs, appending standard UTM tracking strings: ?utm_source={{site_source_name}}&utm_medium=paid_social&utm_campaign={{campaign.name}}&utm_content={{ad.name}}
- Click Publish in the bottom-right corner.
Observable visual confirmation: Campaign status transitions from Draft to In Review, followed by Active or Learning status within 2 to 6 hours, with initial impressions appearing in the reporting dashboard.
Common operational failure: Selecting the "Traffic" campaign objective under the mistaken assumption that high click volume leads to sales. Traffic campaigns optimize for low-quality clicks from bots and accidental scrollers rather than qualified buyers. Always choose the specific downstream business action (Purchase or Lead) as the campaign objective.
Step 6: Apply Frequency Capping and Creative Fatigue Controls
The technical objective of this step is establishing automated diagnostic thresholds to detect creative fatigue and prevent budget waste as audience saturation increases.
Step 6.1: Monitor Frequency and Metric Degradation
Creative fatigue occurs when target audiences are exposed to the same ad asset repeatedly, leading to sensory blindness, collapsing engagement, and rising media costs. When fatigue strikes, you will observe a distinct sequence of metric shifts:
- Ad Frequency rises: The average number of times an individual user views your ad within a 7-day window climbs above 2.5 in prospecting audiences.
- First-Time Impression Ratio drops: The percentage of daily impressions reaching new users declines below 50%.
- Outbound CTR falls: Click-through rates drop by 20% to 35% compared to baseline performance.
- CPA escalates: Cost per conversion increases sharply as the platform struggles to find unconverted prospects within the saturated pool.
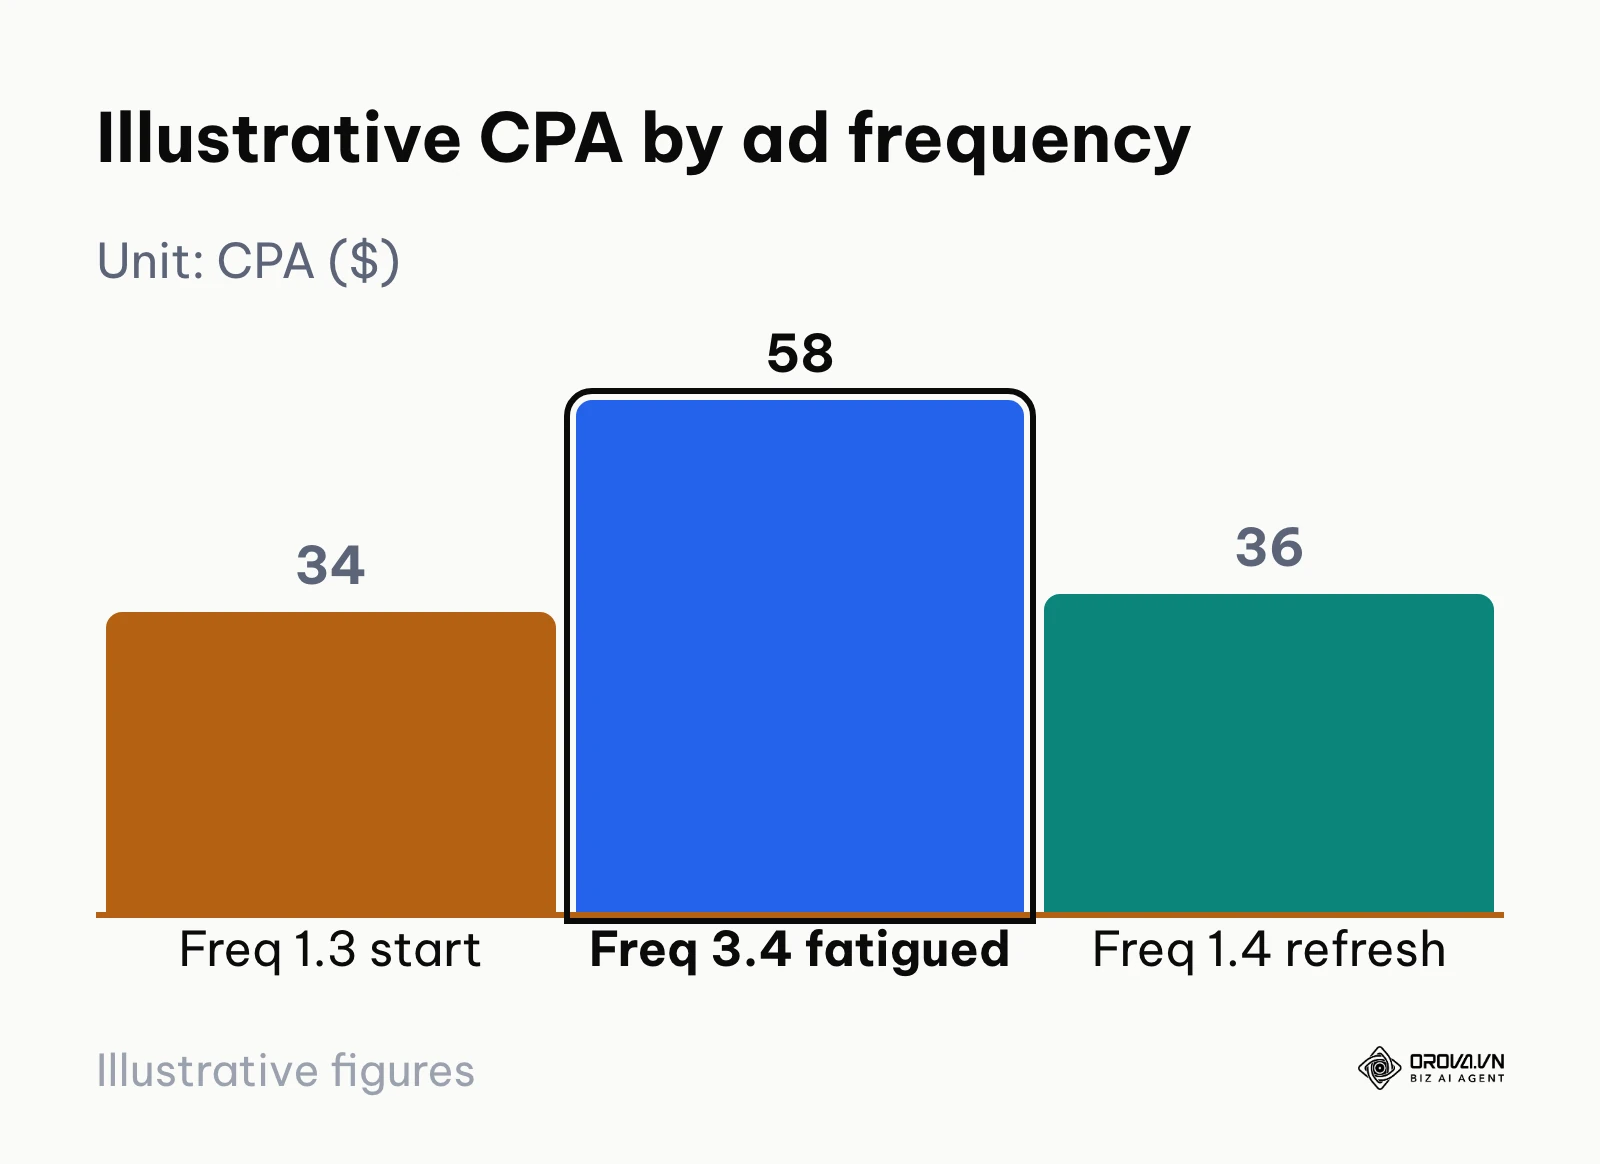
The chart below uses the numbers from the skincare example later in this step: CPA moved from 34 US dollars at frequency 1.3 to 58 US dollars at frequency 3.4, then back to 36 US dollars at frequency 1.4 after a creative refresh.
Step 6.2: Implement the Scale-or-Kill Decision Rules
Never guess whether an ad set should be terminated. Enforce an objective decision framework evaluated every 48 to 72 hours:
+------------------------------------------------------------------------+
|                      SCALE-OR-KILL DECISION MATRIX                     |
+------------------------------------------------------------------------+
| Condition A: Spend > 2x Target CPA & Conversions = 0                   |
| Action: KILL IMMEDIATELY. Do not modify targeting or wait.             |
+------------------------------------------------------------------------+
| Condition B: CPA <= Target CPA & Frequency < 2.2                       |
| Action: SCALE BUDGET by 15-20% every 48-72 hours.                      |
+------------------------------------------------------------------------+
| Condition C: CPA > Target CPA & Frequency > 2.8 & CTR falling          |
| Action: RETIRE CREATIVE. Rotate winning hook from sandbox testing.     |
+------------------------------------------------------------------------+
| Condition D: CPA is profitable, but Volume is capped on Cost Cap       |
| Action: INCREMENT BID CAP by 5-10% to capture higher auction tranches. |
+------------------------------------------------------------------------+
To automate these guardrails within Meta Ads Manager:
- Select the target ad set and click Rules > Create a New Rule.
- Select Turn off ad sets when Spend > [2x Target CPA] and Results < 1 over the past 3 days.
- Apply a notification rule when Frequency > 2.5 over the last 7 days.
Observable visual confirmation: The reporting dashboard displays an automated system log entry inside the History tab confirming rule execution, or ad set status automatically switching to Off when stop-loss limits are breached.
Common operational failure: Manually editing an ad set's creative assets directly inside an active campaign when fatigue occurs. Modifying an active ad resets the entire ad set back into the algorithmic learning phase. To replace fatigued assets properly, build a new ad set or add new ads alongside the active ones, allowing the algorithm to shift delivery dynamically.
Illustrative example: A direct-to-consumer skincare brand running a single top-performing video ad noticed their daily sales volume softened while overall blended CPA rose from 34 US dollars to 58 US dollars across ten days. The growth marketer analyzed performance metrics in Meta Ads Manager and identified that the ad set frequency had risen from 1.3 to 3.4, while first-time impressions dropped to 28%. Instead of increasing the total ad budget, the marketer paused the fatigued ad asset and imported two validated winning concepts from their modular sandbox campaign: one customer unboxing video and one clinical dermatologist demonstration. Within three days of rotating the fresh assets, ad frequency across the prospecting pool returned to 1.4, outbound CTR improved from 0.82% to 1.65%, and CPA restabilized at 36 US dollars.
Step 7: Scale Winning Ad Sets Using Structured Budget Rules
Your final operational objective is expanding media spend sustainably without shocking platform delivery algorithms or destabilizing your cost per acquisition.
Step 7.1: Execute Vertical Scaling Rules
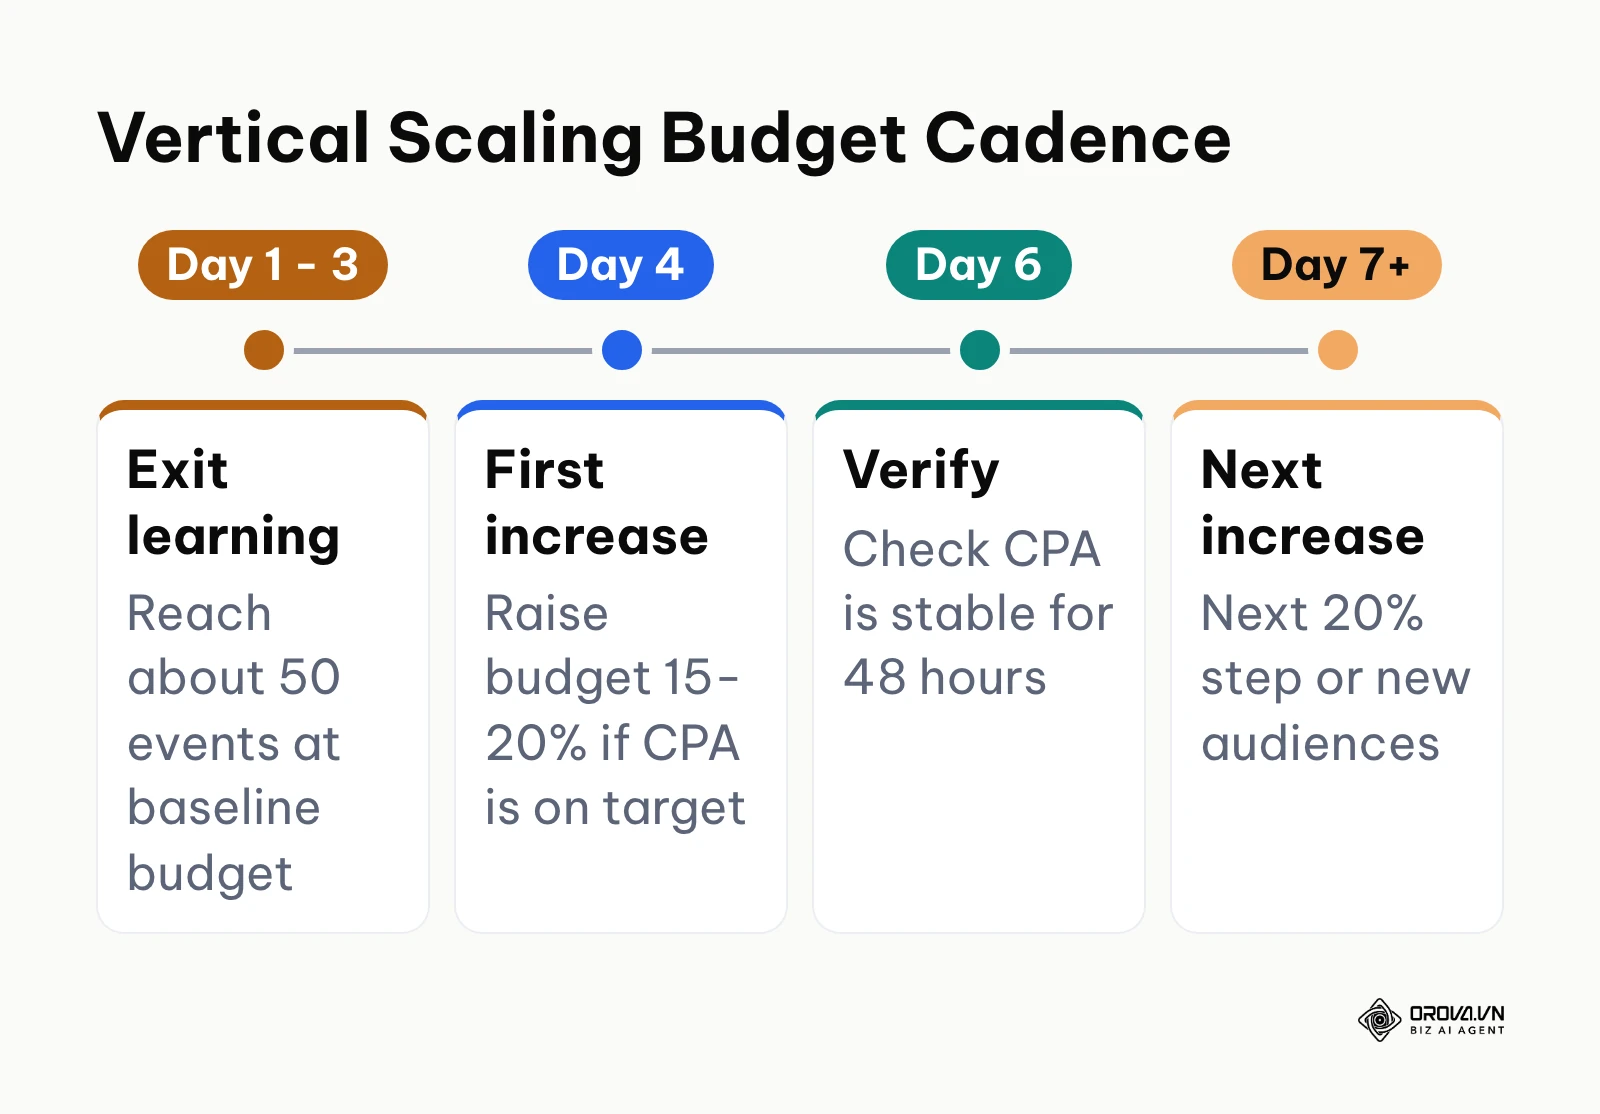
Vertical scaling involves increasing the daily budget of an existing high-performing ad set or CBO campaign. If you double or triple a campaign budget overnight (for example, jumping from 100 US dollars per day to 300 US dollars per day), the delivery algorithm panics. It attempts to deploy the excess capital into lower-quality auction inventory, spikes your CPM, and resets the ad set into the volatile "Learning Phase."
Enforce the 20% Vertical Scaling Rule:
- Confirm that the target ad set has maintained a profitable CPA over the preceding 3-day and 7-day evaluation windows.
- Verify that the ad set has generated at least 50 conversion events since its last structural edit.
- Increase the daily budget by no more than 15% to 20% once every 48 to 72 hours.
- Allow delivery to restabilize over two complete conversion cycles before applying the subsequent budget increase.
The implementation timeline below charts the exact progression required to scale budgets systematically without resetting auction learning status.
Step 7.2: Deploy Horizontal Scaling via Audience Diversification
When vertical budget expansion reaches diminishing returns (manifested as rising CPA even with modest 15% budget increases), transition your strategy toward Horizontal Scaling. Rather than pushing more capital through the same audience pipe, open new targeting pipelines:
- Broad Demographic Targeting: Remove all interest and behavioral filters entirely. Configure age, gender, and geographic parameters, allowing platform machine learning to locate buyers purely based on creative hook engagement and pixel feedback.
- Stacked Lookalike Audiences: Generate 1%, 2%, 3%, and 5% lookalikes derived from your highest-value customer data (LTV-ranked buyers, repeat purchasers, or high-intent lead submissions). Combine these into clean, segregated ad sets.
- Cross-Platform Channel Expansion: Export validated winning creative assets from Meta and reformat them into 9:16 vertical video assets for TikTok Spark Ads, or adapt headline copy into LinkedIn Sponsored Content formats.
To monitor cross-channel attribution hygiene as you scale, compare your paid media metrics using dedicated social analytics tools alongside native platform ad managers.
Observable visual confirmation: Campaign daily spend reflects your increased budget allocation, while the delivery status column remains marked as Active rather than reverting to Learning.
Common operational failure: Scaling budgets while checking only 1-day attribution windows. Post-iOS privacy frameworks introduce reporting delays where platform conversion attribution may take up to 72 hours to populate fully. Scaling or killing campaigns based on incomplete same-day data leads to erratic decision-making. Always evaluate scaling decisions using a 3-day or 7-day attribution lookback window.
Comprehensive Implementation Checklist for Social Network Advertising
Print or save the following operational matrix to audit your end-to-end execution across every technical stage.
| Implementation Step | Primary Operational Task | Verifiable Completion Signal | Estimated Duration |
|---|---|---|---|
| Step 1: Tracking Audit | Implement server-side CAPI and client pixel deduplication | Event Match Quality >= 7.0/10 with matched Event IDs | 1.5–2 hours |
| Step 2: Unit Economics | Determine break-even ROAS and split budget via 70/20/10 model | Daily budgets reflect strict financial allocation formulas | 1 hour |
| Step 3: Audience Isolation | Run overlap diagnostics and establish master exclusion lists | Overlap below 25% across ad sets with purchaser exclusions applied | 45 minutes |
| Step 4: Creative Sandbox | Deploy modular hook-testing ad sets under ABO control | 3+ distinct hook assets active against identical broad targeting | 2 hours |
| Step 5: Auction Launch | Configure Sales/Lead campaigns with Advantage+ placements | Campaigns Active with proper UTM tracking strings attached | 45 minutes |
| Step 6: Fatigue Defense | Establish automated stop-loss and frequency threshold rules | Automated rules visible in system log; daily frequency < 2.5 | 30 minutes |
| Step 7: Scaling Protocol | Execute 20% budget increases or deploy horizontal broad sets | Budget expanded by <= 20% with zero learning phase resets | Ongoing (3-day cycles) |
Want to scale your budget but afraid of breaking performance?
Integrate OROVA ADS now - an AI Agent that automatically monitors and optimizes Google, Meta, TikTok ads 24/7. Now, expanding and replicating your Performance Ads team is just one click away.
Try it now at: orova.vn/ads
Common Pitfalls in Social Network Advertising and How to Resolve Them
Even experienced growth teams stumble into systemic traps when managing paid social campaigns at scale.
The table below outlines the six most destructive operational errors encountered in social media advertising, their root technical causes, and actionable resolutions.
| Common Pitfall | Root Technical Cause | Immediate Corrective Action |
|---|---|---|
| Persistent "Learning Limited" status | Budget too low to generate 50 conversion events within a 7-day window | Consolidate micro ad sets into a single broad audience; increase daily budget to at least 4x target CPA |
| Sudden CPM inflation across ad sets | Audience overlap causing internal auction self-competition | Use the Audience Overlap diagnostic tool; apply strict negative custom audience exclusions |
| High CTR but zero landing page sales | Disconnect between creative hook and post-click page content; slow mobile page load | Align page headlines directly with ad promises; optimize mobile site load speed below 2.5 seconds |
| Rapid performance collapse after 10 days | Ad creative fatigue due to small audience size or high spend saturation | Refresh visual opening hooks; rotate secondary winning concepts from testing sandbox |
| Over-reporting conversion metrics | Double-counting from firing both client pixel and server CAPI without unique Event IDs | Implement identical event_id parameters across client and server event payloads |
| Premature campaign termination | Evaluating performance on same-day data before attribution windows finalize | Enforce minimum 72-hour evaluation windows; assess campaigns against blended 7-day MER |
To prevent these execution bottlenecks from draining media buying hours, teams running multi-channel campaigns often move repetitive checks such as stop-loss rules and frequency alerts into automated ads workflows that apply one rule set across every platform.
How to Measure Performance After Launching Social Campaigns
Evaluating paid social campaigns requires separating vanity engagement metrics from verifiable commercial outcomes.
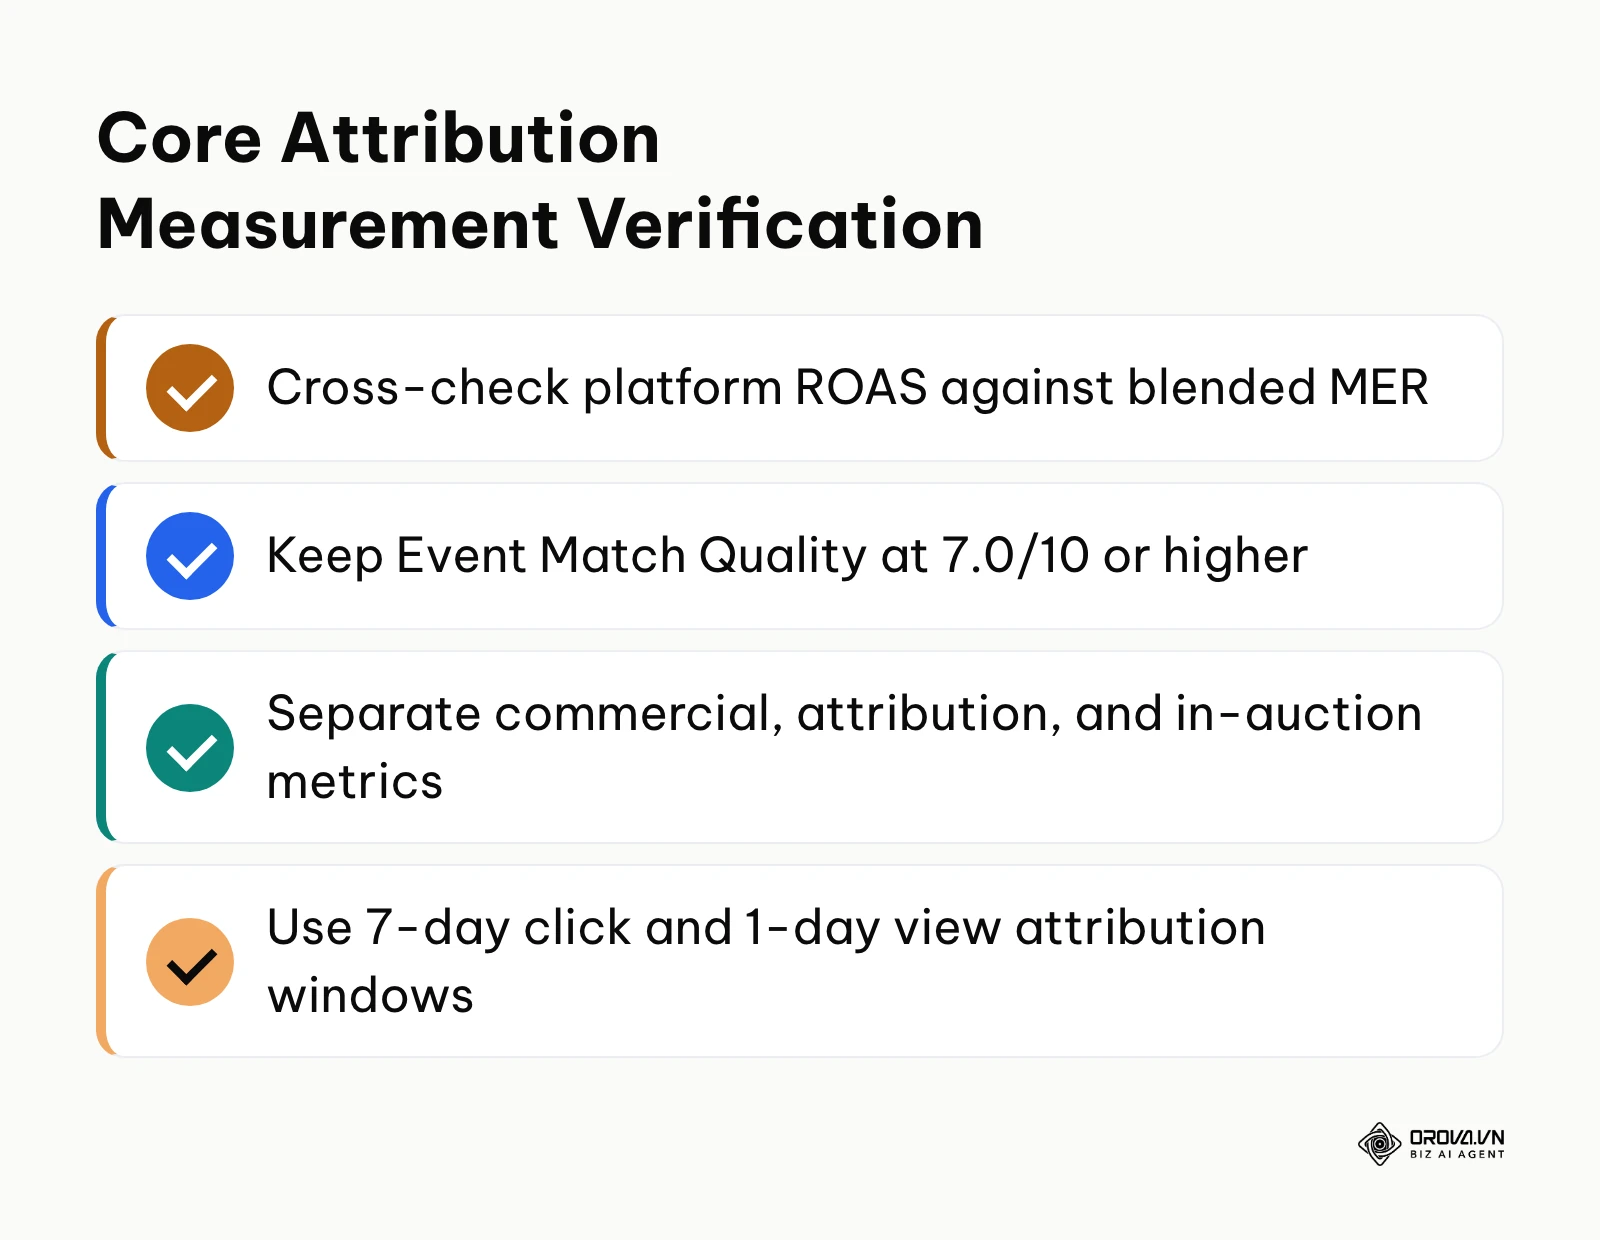
Begin your evaluation by categorizing metrics into three analytical tiers:
- Top-Tier Commercial Metrics: Blended Marketing Efficiency Ratio (MER), Net Revenue, Customer Acquisition Cost (CAC), and Cash-on-Cash Return. These figures reside in your payment processor and banking ledger, immune to platform attribution bias.
- Platform Attribution Metrics: Attributed CPA, Purchase Conversion Value, and Return on Ad Spend (ROAS). View these inside your ad manager using a standard 7-day click and 1-day view attribution window.
- In-Auction Diagnostic Indicators: CPM, Outbound CTR, Thumb-Stop Rate, and Frequency. Use these diagnostic metrics exclusively to identify creative fatigue or technical delivery friction.
Check platform diagnostic indicators once daily to confirm that campaigns deliver without unexpected delivery errors. However, reserve commercial budget modifications and scaling decisions for structured weekly reviews, allowing cross-device attribution and 72-hour reporting delays to stabilize.
The summary diagram below consolidates the four essential verification procedures required to audit campaign reporting accuracy across platforms.
Future Trends in Social Network Advertising: Author's Outlook
The mechanics of social network advertising are shifting from manual targeting configurations toward total algorithmic automation and autonomous creative synthesis.
Shift 1: The Total Elimination of Manual Demographic and Interest Layering
Ad platforms like Meta and TikTok already push advertisers toward broad, automated setups such as Advantage+ and Smart Performance Campaigns. In my view, manual interest targeting and granular behavioral layering will keep shrinking in importance. The ad algorithm no longer relies on self-reported user profile interests. Instead, it parses natural language transcripts, image recognition vectors, and real-time viewing behavior to determine audience matching dynamically. Marketers must accept that the ad creative itself has become the targeting parameter. Those who continue clinging to hyper-segmented 50,000-person interest groups will find themselves priced out of efficient auction tiers. If browser privacy regulations enforce stricter limits on server-side matching, platforms might temporarily re-introduce contextual targeting options, which would complicate this timeline.
Shift 2: Autonomous AI Creative Generation and Real-Time Asset Assembly
I believe that, over time, human media buyers will less often construct fixed, finished 30-second video files for direct-response campaigns. Today, we already observe platforms assembling text assets, image layers, and background audio automatically based on user propensity profiles. The next evolution will see generative video engines dynamically assembling personalized ad variations in the split-second between auction bid requests, matching color palettes, pacing, and value propositions directly to the specific viewer's psychographic profile. To prepare for this shift, marketing teams must stop operating as monolithic production studios and restructure themselves as modular asset providers, focusing their creative energy on high-fidelity value propositions, authentic hooks, and foundational brand guidelines. This transition could stall if consumer backlash against synthetic media leads to mandatory watermarking laws that depress engagement on AI-generated assets.
Shift 3: First-Party Identity Infrastructure and Zero-Party Data Dominance
Third-party cookies are legacy technology, and mobile operating system privacy frameworks continue tightening signal accessibility. Looking ahead, I project that media buying success will correlate directly with an organization's internal data warehouse infrastructure rather than their on-platform tactical tricks. Advertisers that capture zero-party data through interactive post-purchase quizzes, custom onboarding flows, and direct customer engagement will feed their ad platform APIs with superior training signals. I lean toward the conclusion that performance gaps between enterprise brands and amateur media buyers may widen, driven largely by first-party data matching quality. Teams should immediately invest in robust Customer Data Platform (CDP) hygiene, server-side data routing, and continuous identity resolution. This forecast could prove inaccurate if global antitrust actions force social networks to open up decentralized, platform-agnostic identity protocols that equalize data access across all advertisers.
Frequently Asked Questions About Social Network Advertising
How much initial budget do I need to test social network advertising profitably?
You typically need an initial testing budget equal to at least 50 times your target Cost per Acquisition (CPA), or a minimum of 1,500 US dollars to 2,000 US dollars per month. Ad platform machine learning algorithms require approximately 50 conversion events per ad set within a 7-day rolling window to exit the learning phase and optimize delivery costs. If your target CPA is 30, US dollars allocating 1,500 US dollars ensures sufficient auction volume for the algorithm to locate conversion patterns.
How does artificial intelligence impact social network advertising today?
Artificial intelligence fundamentally powers modern social advertising across algorithmic bidding, audience modeling, and dynamic creative delivery. Rather than manually selecting keywords or granular interest tags, advertisers rely on machine learning models to parse creative assets and match them to users exhibiting high conversion probability. Modern platforms also leverage predictive AI to forecast user conversion value and adjust real-time auction bids accordingly.
Should I split my ad budget between Meta Ads and TikTok Ads immediately?
If your monthly advertising budget is below roughly 1,500, US dollars you should not split your budget across multiple networks. Fragmenting limited capital prevents both platform algorithms from accumulating the 50 weekly conversions necessary to exit the learning phase. Focus 100% of your resources on the platform where your audience demonstrates the highest natural affinity, expand your daily budget profitably, and only introduce a secondary channel once your primary channel achieves stable unit economics.
How do I handle cross-device tracking when users view ads on mobile but purchase on desktop?
Cross-device attribution requires implementing server-side conversion tracking (such as Meta Conversions API or TikTok Events API) combined with robust first-party customer matching parameters. By passing hashed user identifiers, including emails, phone numbers, and persistent external customer IDs, alongside standard click parameters, ad network algorithms can reconcile a mobile ad impression with a subsequent desktop transaction completed under the same user identity.
What is the most reliable metric to determine whether an ad set should be scaled or paused?
The most reliable operational metric is your blended Cost per Acquisition (CPA) evaluated against your predetermined break-even margin threshold over a 3-day to 7-day lookback window. If an ad set spends more than twice your target CPA without generating conversions, it should be terminated immediately. If an ad set maintains a CPA at or below your target while ad frequency remains under 2.2, it is primed for budget expansion.
Why do my social ads generate high click volume but very few conversions?
High click-through rates paired with low conversion volume typically indicate either poor traffic quality or post-click landing page friction. When campaigns are configured using "Traffic" rather than "Sales" or "Leads" objectives, algorithms intentionally target users who click links indiscriminately without ever purchasing. Alternatively, slow mobile page loading speeds, pricing surprises, or mismatched messaging between your ad hook and landing page headline will cause immediate bounce rates.
Where Should You Start?
If you are launching a brand-new social advertising account with no historical conversion data, your immediate priority for today is implementing server-side tracking and verifying your event deduplication pipeline. Open your website management platform, configure your server-to-server connection using Meta Conversions API or TikTok Events API, and fire test transactions in Events Manager until your Event Match Quality score registers above 7.0. Establishing clean measurement telemetry prevents initial media spend from being wasted on untracked conversion data.
If you are currently managing an active paid social campaign suffering from rising acquisition costs and stagnating volume, dedicate your afternoon to an audience overlap and creative fatigue audit. Open the Audience Overlap diagnostic tool inside your ad manager to verify that your active ad sets are not bidding against each other in the auction. Once you have established strict exclusion lists between your prospecting and retargeting pools, review your ad frequency metrics over the past 7 days and replace any creative assets exceeding a frequency of 2.5 with fresh modular hooks.
If you are an established brand preparing to scale a proven, profitable product offer across multiple social channels, begin by establishing your 70/20/10 budget allocation model and formalizing your automated scale-or-kill rules. Consolidate fragmented micro-budgets into centralized Advantage Campaign Budget structures, establish an isolated modular testing sandbox, and enforce systematic 20% vertical budget scaling increments every 48 to 72 hours. By anchoring your daily decisions to explicit financial formulas and technical guardrails, you can build a predictable, scalable revenue engine through disciplined social network advertising.
About the author

Builder of Orova
Nguyễn Đỗ Trọng Ân has 8 years of experience in marketing, including 6 years managing market development across Asia. He builds Orova, a Biz AI Agent that never sleeps: it plans, runs and optimizes work for businesses.
Run your business with AI Agents
Orova is the always-on Biz AI Agent — it plans, runs, and optimizes the work for you.
Save time, unlock productivity.