
Facebook ads report guide: from metrics to diagnostic decisions

You open your Meta Ads Manager, and the numbers are staring back at you. Your acquisition costs have spiked, and the return on ad spend is plummeting. You quickly export a facebook ads report, hoping the raw CSV file will give you the answers. But it doesn't. A useful report does more than list numbers: it tells you why a number moved and what you should change next. You are left with rows of data and zero direction. The traditional approach to reporting—simply listing metrics like click-through rates, costs per click, and overall spend—is fundamentally broken. Relying on isolated data points without understanding the underlying context leads to panic decisions, like pausing a winning creative just because of a temporary cost spike.
This article will change how you approach your data. Instead of showing you how to click the "export" button, this guide provides a deep, actionable diagnostic framework. You will learn how to build a root-cause analysis system, measure creative fatigue before it kills your budget, and reconcile mismatched data between Meta and your CRM. By the end, you won't just be tracking numbers; you will have a repeatable way to turn every report into a clear decision. If you need a refresher on what each metric means before diving into diagnosis, start with our guide to ad performance metrics, then come back here for the Meta-specific workflow.
What exactly is a Facebook ads report?
A Facebook ads report is a structured summary of your campaign performance metrics, pulled directly from Meta's ecosystem or integrated third-party tools. It exists to answer one core question: Is your advertising investment generating a profitable return?
Any business scaling budgets beyond a modest daily spend should build comprehensive reports. This process is for marketers, founders, and agency operators who need to move beyond vanity metrics. However, you should not obsess over granular reporting if you are running a single small-budget awareness campaign; at that level, the data volume is too low to yield statistically significant insights. The true power of a report unlocks when you use it to diagnose systemic issues within complex funnels.
Pre-reporting requirements: Setting up for accuracy
Before diving into any analysis, your data foundation must be perfectly solid. If your tracking pixel is misfiring, your entire facebook ads report will lead you to the wrong conclusions. You cannot optimize a campaign based on ghost data.
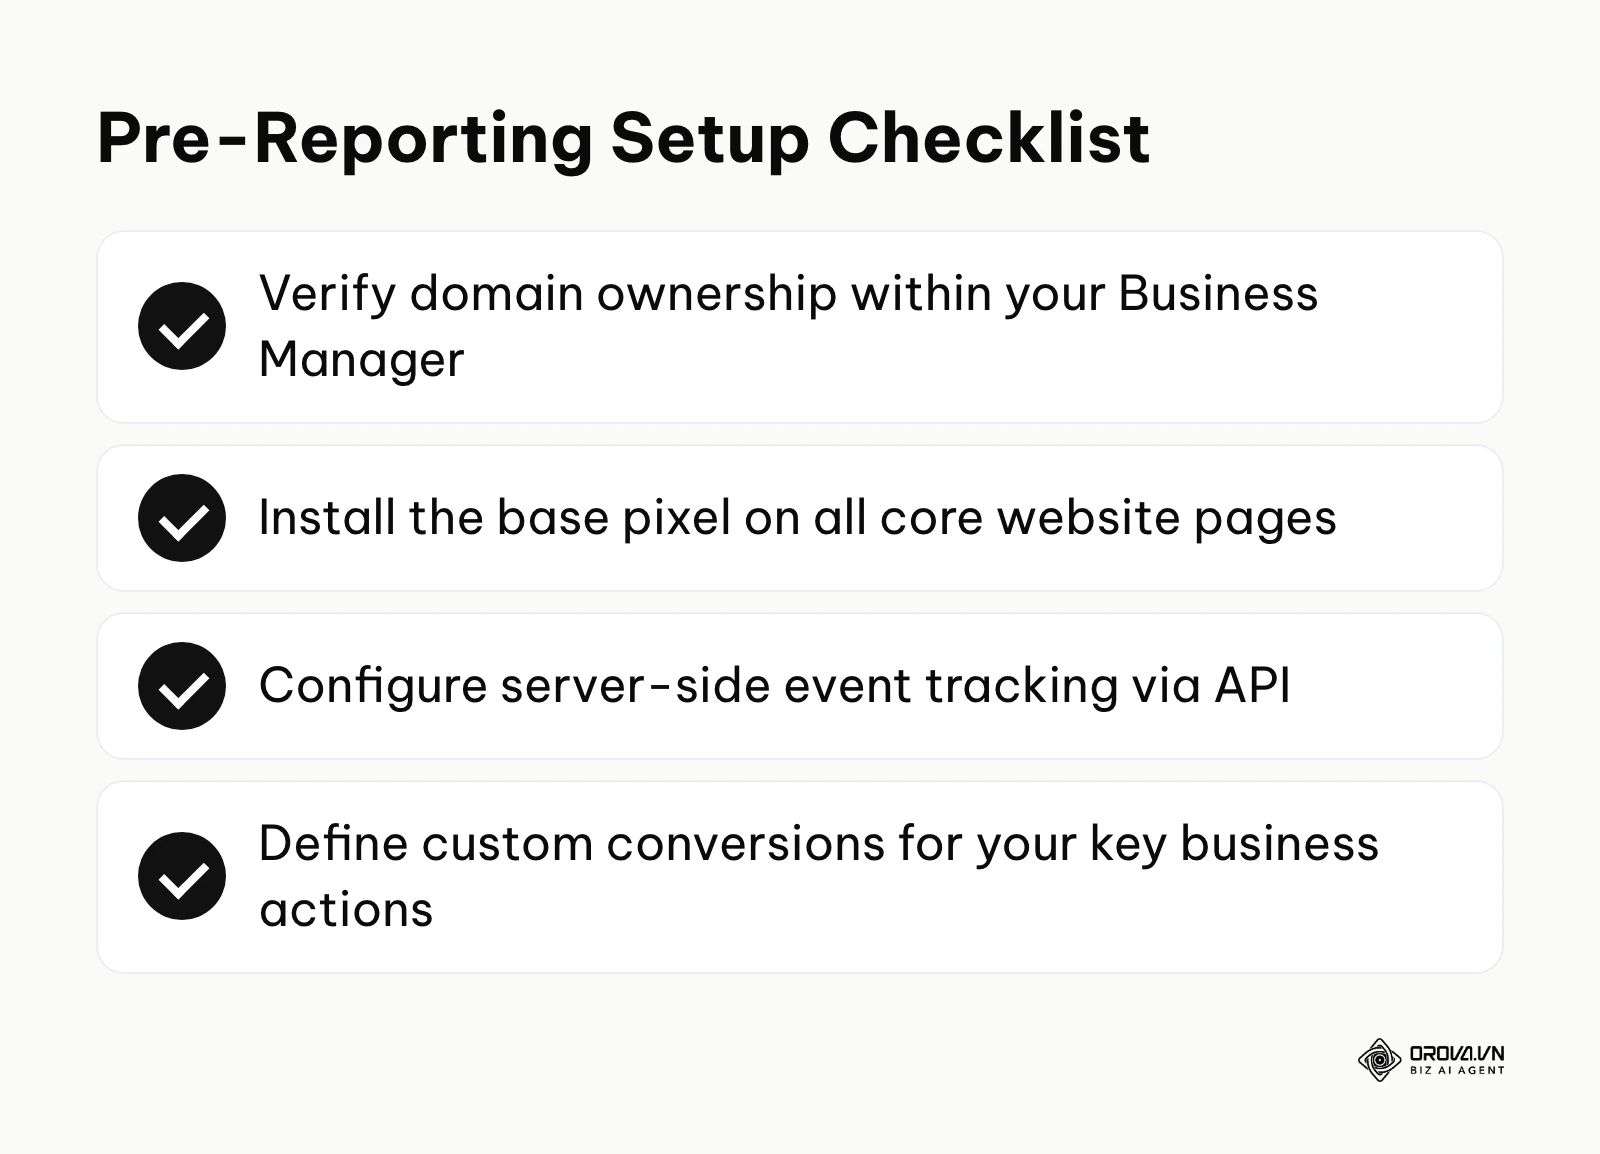
To ensure accuracy, you must configure your technical infrastructure properly before spending any significant budget. This preparation phase is non-negotiable. Meta's own Business Help Center documentation on the Conversions API recommends a redundant setup that uses both the pixel and the server-side API to reduce data loss. By sending data directly from your server alongside browser events, you bypass ad blockers and privacy restrictions that cripple standard pixel tracking.
| Requirement | Where to access it | Expected time to complete |
|---|---|---|
| Domain Verification | Business Manager Settings > Brand Safety | 15 minutes |
| Base Pixel Installation | Events Manager > Data Sources | 30 minutes |
| Conversions API Setup | Events Manager > Settings > Conversions API | 2-4 hours |
| Custom Conversions | Events Manager > Custom Conversions | 20 minutes |
Without these elements functioning correctly, you will experience severe under-reporting. Once this foundation is built, you can trust the numbers populating your dashboard. Ensure you understand facebook pixel tracking deeply, as it dictates the quality of every report you will ever generate.
Step-by-step: Building and analyzing your Facebook ads report
This is the core operational process. Creating a report is not a single action; it is a sequence of strategic decisions that dictate how you view your business.
Step 1: Defining the North Star metric for your funnel stage
What this is: Every campaign stage requires a distinct primary metric to measure success. You cannot judge a brand awareness video by direct sales, just as you cannot evaluate a retargeting campaign strictly by link clicks.
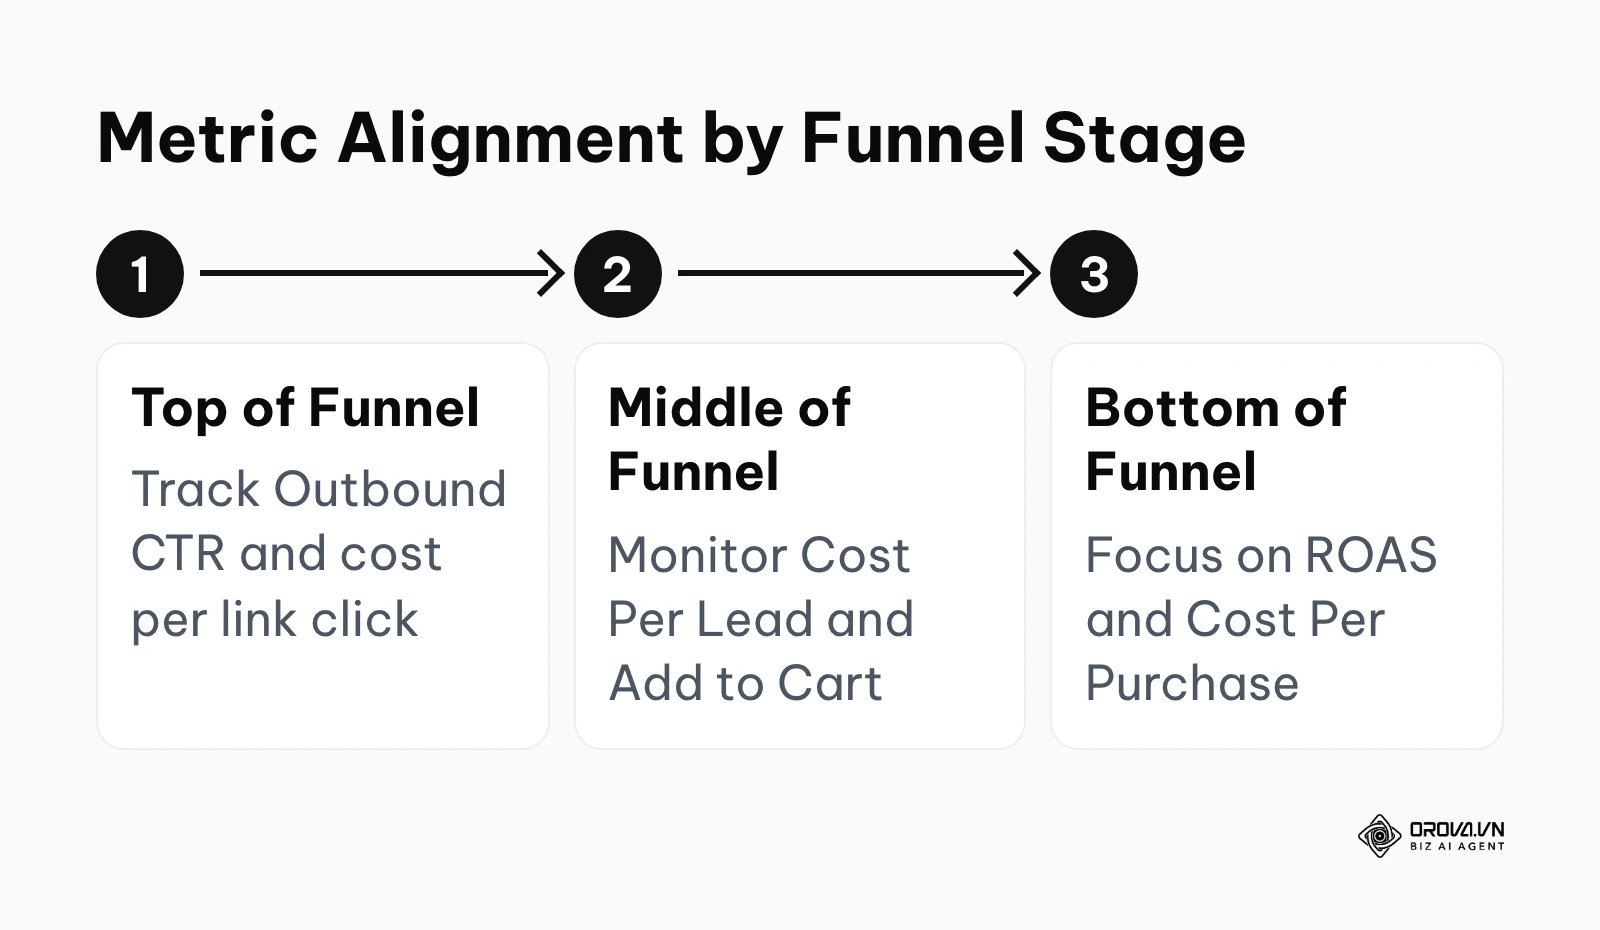
How to execute: Segment your report by the marketing funnel. For Top of Funnel (TOFU) campaigns aimed at cold audiences, focus on Outbound Click-Through Rate (CTR) and Cost Per Unique Link Click. For Middle of Funnel (MOFU) campaigns focused on consideration, track Cost Per Lead (CPL) or Cost Per Add to Cart. For Bottom of Funnel (BOFU) retargeting, your North Star is strictly Return on Ad Spend (ROAS) and Cost Per Purchase.
Success sign: You know you have defined this correctly when your team stops arguing over low conversion rates on campaigns that were explicitly designed to drive cheap traffic.
Common errors: The most devastating error here is applying bottom-funnel expectations to top-funnel creatives. This mismatch causes marketers to prematurely kill excellent prospecting ads because they haven't generated immediate, same-day sales. If your goal is lead generation, understanding what lead form ads are and how their cost per lead behaves will prevent this misalignment.
Step 2: Creating a custom Meta Ads Manager dashboard
What this is: The default Ads Manager view is cluttered with irrelevant vanity metrics like "Page Likes" and "Post Shares." Creating a custom dashboard means stripping away the noise to expose only the operational levers that dictate profitability.
How to execute: Open your Ads Manager, click the "Columns" dropdown, and select "Customize Columns." Delete all default metrics. Add the following in this exact order: Delivery, Budget, Amount Spent, Results, Cost per Result, ROAS, Outbound CTR, CPM (Cost per 1,000 Impressions), and Frequency. Save this configuration as a preset named "Master Diagnostic View" and check the box to make it your default. You can learn more about navigating this interface by mastering the facebook ads manager core functions.
Success sign: Your workflow becomes significantly faster. You can immediately spot the relationship between a rising CPM and a dropping ROAS without scrolling horizontally across thirty columns.
Common errors: Failing to differentiate between "Clicks (All)" and "Outbound Clicks." "Clicks (All)" includes people clicking to expand text or view a profile, which artificially inflates your CTR. Always track Outbound Clicks to measure actual traffic landing on your website.
Step 3: Implementing Creative Fatigue Reporting
What this is: Creative fatigue reporting is the proactive process of monitoring specific data points to determine exactly when an ad has lost its effectiveness. You do this to avoid turning off good ads too early, while simultaneously preventing dead ads from draining your daily spend.
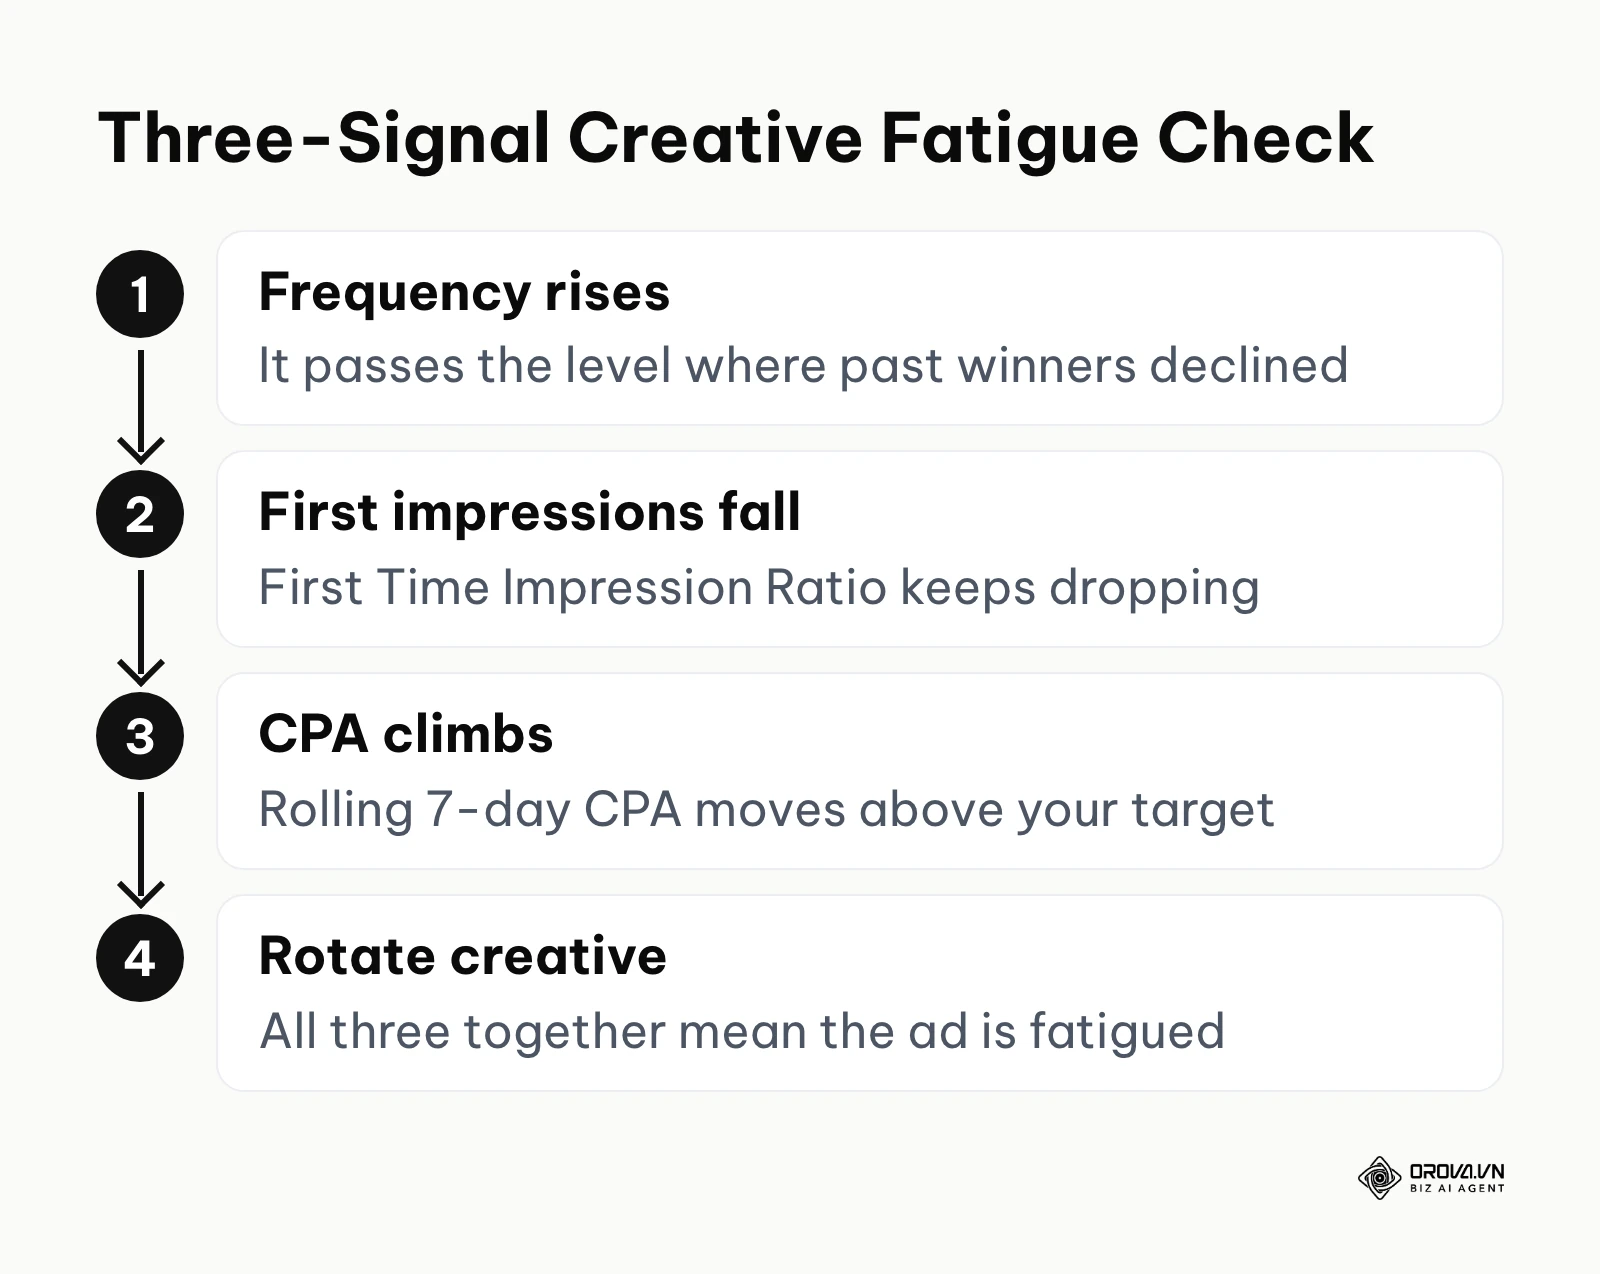
How to execute: To build this, you must customize your columns to track three specific metrics side-by-side. First, add Frequency (the average number of times a single person sees your ad). Second, add First Time Impression Ratio (the percentage of your daily impressions that come from people seeing the ad for the very first time). Third, add your Cost Per Acquisition (CPA). You then monitor the trendline over a rolling seven-day period. Set your own warning levels from the account's history rather than borrowing someone else's numbers: note the Frequency and First Time Impression Ratio at which your past winners started to decline. When Frequency climbs past that level and the First Time Impression Ratio keeps falling, look at the CPA. If the CPA is simultaneously rising above your target threshold, the creative is fatigued. One signal alone is not enough; you need all three moving in the wrong direction together.
Success sign: You know this is working when you can confidently predict a CPA spike two days before it ruins your weekly average, allowing you to cycle in new creatives seamlessly without disrupting account stability.
Common errors: The most frequent mistake here is looking at daily data instead of a rolling average. Daily data fluctuates wildly based on user behavior on weekends versus weekdays. Reacting to a single bad day will cause you to prematurely kill an ad that was just experiencing a temporary market dip.
Illustrative example: Consider a media buyer managing a large monthly ad budget for a B2B software company. First, they customized their report columns to include Frequency and First Time Impression Ratio alongside their standard cost metrics. Second, they began tracking these specific numbers daily against the overall Cost Per Acquisition. The stumbling block was that the acquisition cost fluctuated wildly on weekends, causing premature panic and leading them to pause ads too early based on false signals. To resolve this, they adjusted their reporting window to a rolling seven-day average to smooth out the daily volatility. The visible result was a highly stable workflow where creatives were only replaced when the seven-day average cost crossed their target CPA threshold, keeping the core campaigns running uninterrupted for weeks longer.
Step 4: Multi-channel data reconciliation (Meta vs GA4)
What this is: Relying solely on a facebook ads report is dangerous because Meta inherently favors its own platform in attribution models. Multi-channel reconciliation is the practice of comparing Meta's claimed conversions against your website analytics (like GA4) and your backend CRM to find the true source of a sale.
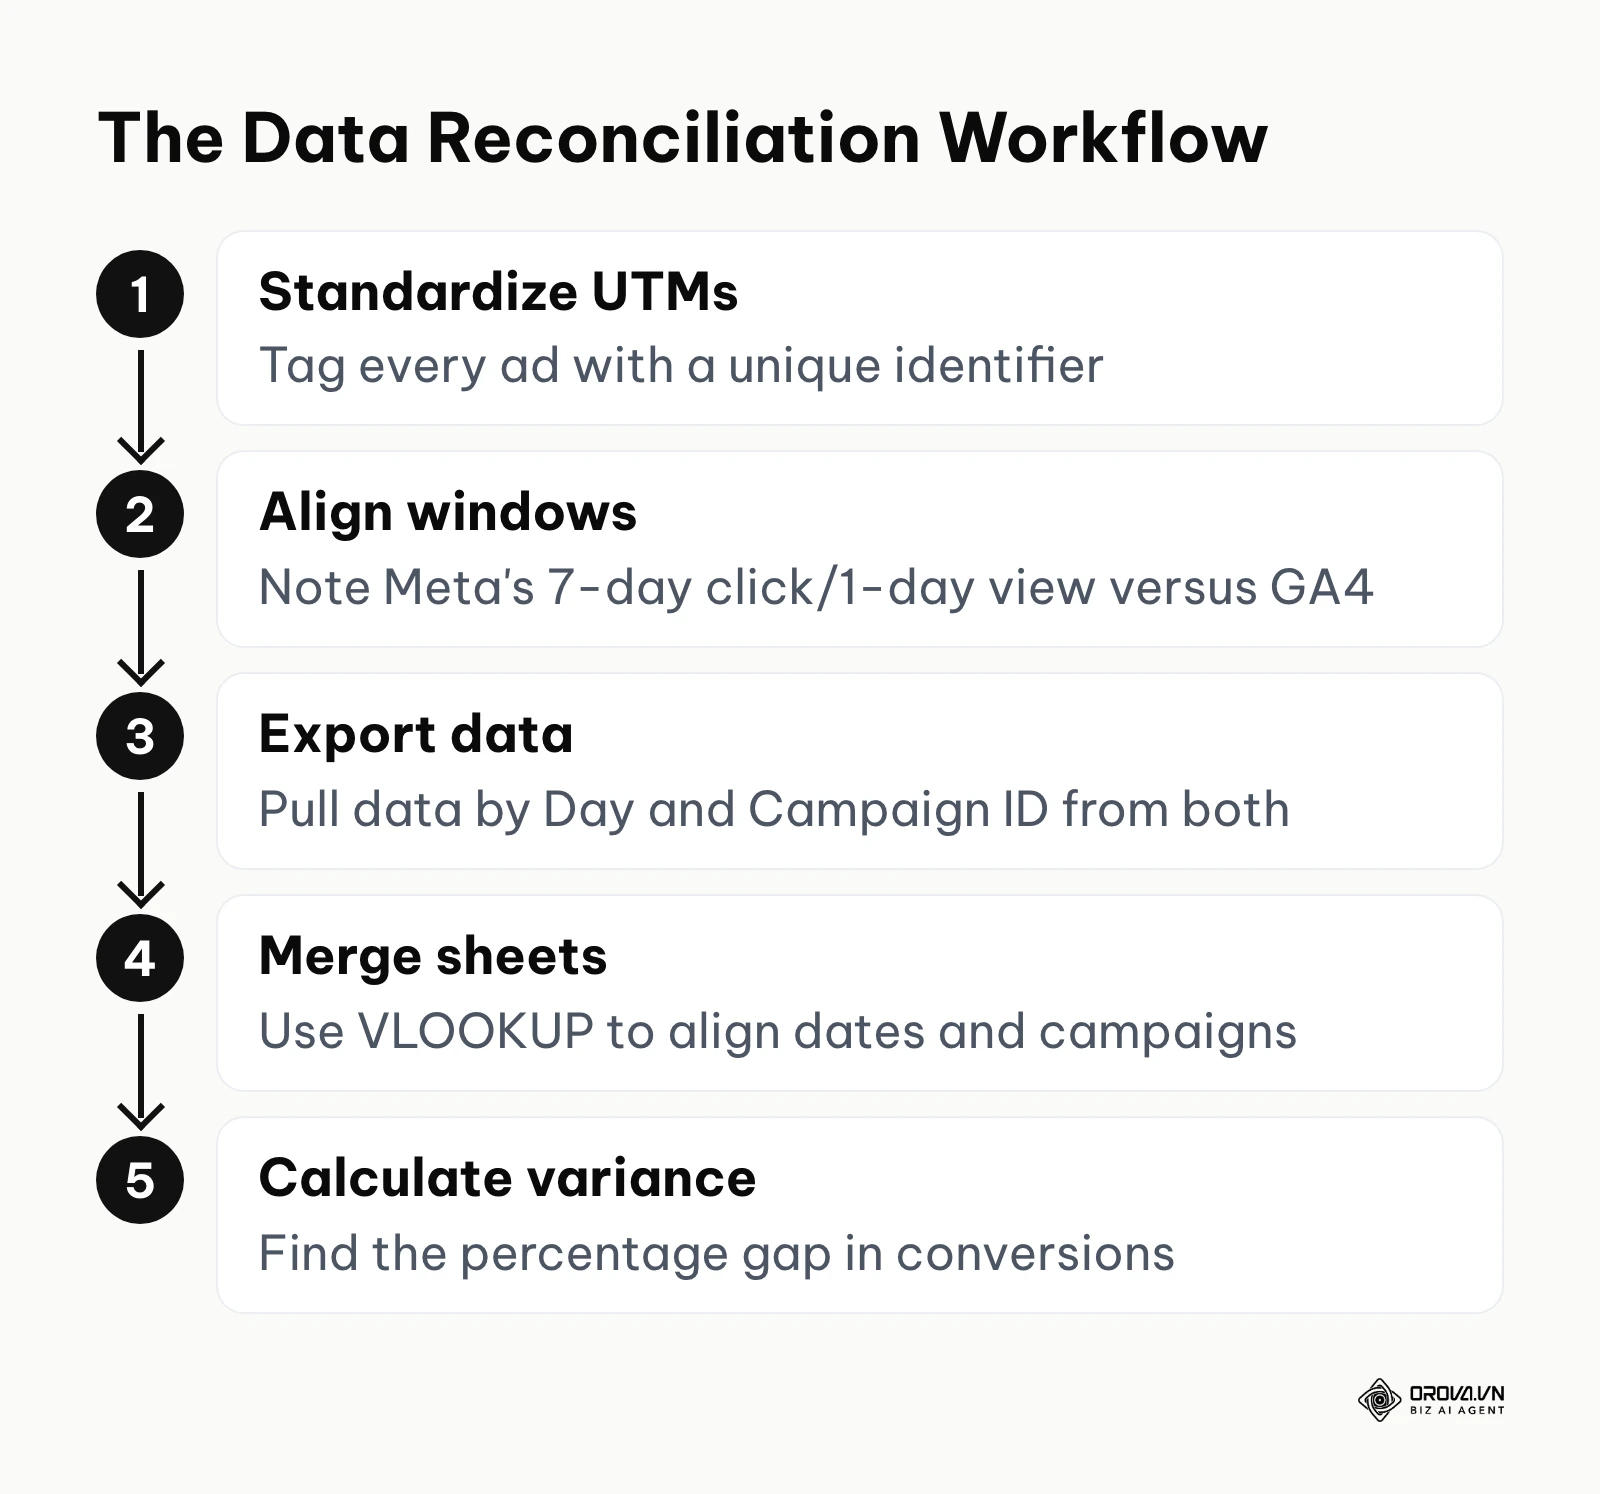
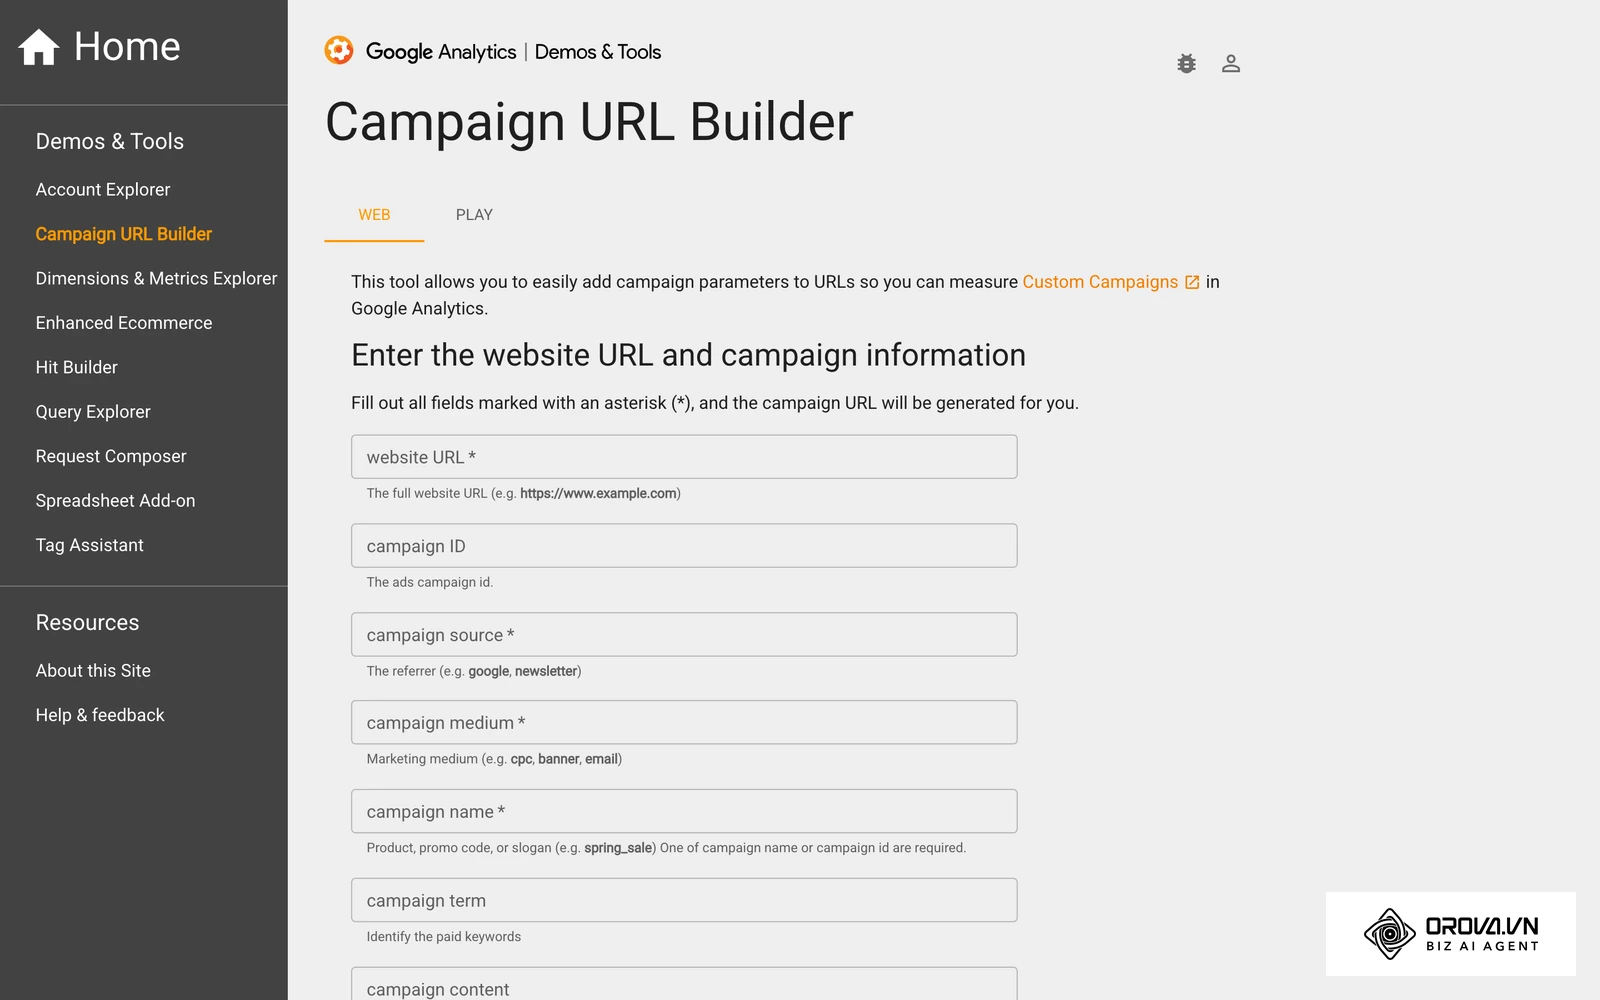
How to execute: You must follow a strict five-step checklist. First, standardize your UTM parameters at the ad level so every click carries a unique identifier. Second, align your attribution windows; note that Meta defaults to a 7-day click/1-day view model, while GA4 uses data-driven attribution. Third, export raw data by Day and Campaign ID from both platforms. Fourth, use a VLOOKUP or Index/Match function in a spreadsheet to merge the data sets based on the date and campaign name. Fifth, calculate the variance percentage. If Meta claims 100 sales and GA4 claims 80, your variance is 20%. Track that variance week over week: a stable gap is a known offset you can plan around, while a sudden jump usually points to a broken tag, a changed checkout flow or missing UTMs. The same reconciliation logic applies across Google and TikTok too, which our PPC reporting masterclass covers for multi-platform accounts; this guide stays focused on Meta's own data.
Success sign: You stop arguing with clients or stakeholders about which platform is "lying." You establish a single source of truth based on backend revenue, using platform data strictly as a directional indicator.
Common errors: Expecting the numbers to match perfectly. They never will. If you pause a campaign because GA4 shows zero sales, but your backend Shopify store is thriving, you have fallen victim to a tracking failure, not a campaign failure.
Illustrative example: Picture an in-house marketing lead for a boutique fitness franchise running local campaigns. They began by exporting the weekly Meta purchase data to a spreadsheet. Next, they pulled the corresponding transaction data from their Google Analytics 4 custom report. The immediate stumbling block was a massive 40% discrepancy, where Meta claimed 100 membership sales but GA4 only showed 60. To fix this, they implemented dynamic UTM parameters meticulously on every ad and switched the GA4 attribution model to data-driven, while checking the backend POS system for the ultimate truth. The final result was a reliable tripartite report where the remaining 10% variance was acceptable, allowing the team to confidently scale their budget without fearing phantom conversions.
Step 5: Conducting Root Cause Analysis on dropping metrics
What this is: A basic report tells you that performance is dropping. A diagnostic report tells you why. Root cause analysis is a structured framework that links specific metric combinations to their underlying operational failures.
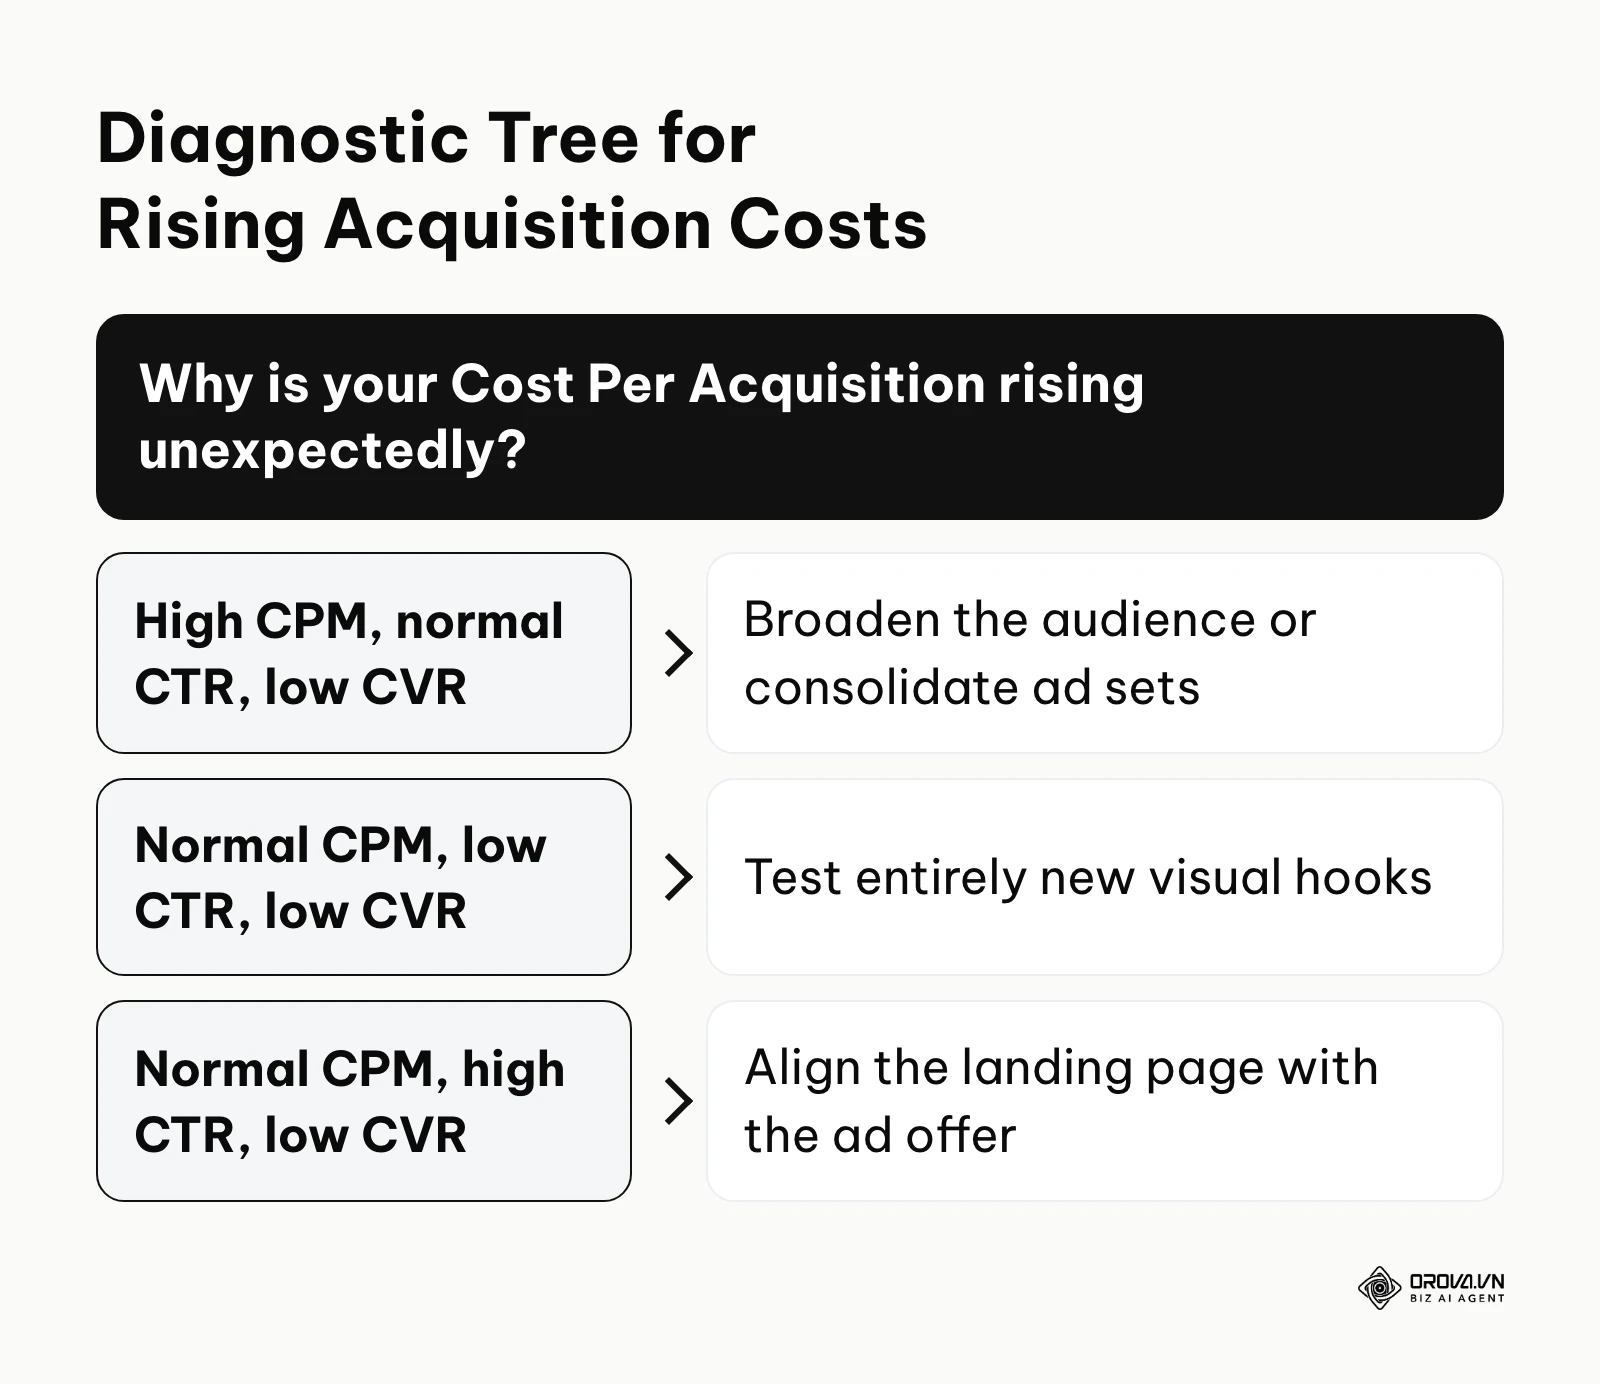
How to execute: When your CPA rises, you must cross-reference three metrics: CPM, CTR, and Conversion Rate (CVR). Apply this diagnostic tree:
- Scenario A: High CPM, Normal CTR, Low CVR. This indicates audience saturation or extreme market competition. Your creative is fine, but you are buying expensive ad space. Fix this by broadening your audience or consolidating ad sets.
- Scenario B: Normal CPM, Low CTR, Low CVR. This indicates creative failure. Your ad is not stopping the scroll. Fix this by testing entirely new visual hooks or provocative headlines.
- Scenario C: Normal CPM, High CTR, Low CVR. This is the clickbait scenario. Your ad gets attention, but the landing page fails to convert. Fix this by aligning the ad copy exactly with the landing page offer, or improving page load speeds.
Success sign: Your team stops making random changes. Every optimization action is directly tied to a specific metric symptom, significantly reducing wasted testing budgets.
Common errors: Treating symptoms in isolation. For example, trying to fix a low Conversion Rate by changing the ad image, when the root cause is actually a broken checkout button on the website.
Step 6: Executing the Action Plan based on data
What this is: A report is useless if it does not dictate your next move. The action plan is a pre-defined set of rules (an If/Then checklist) that you follow rigorously based on the insights uncovered in your root cause analysis.
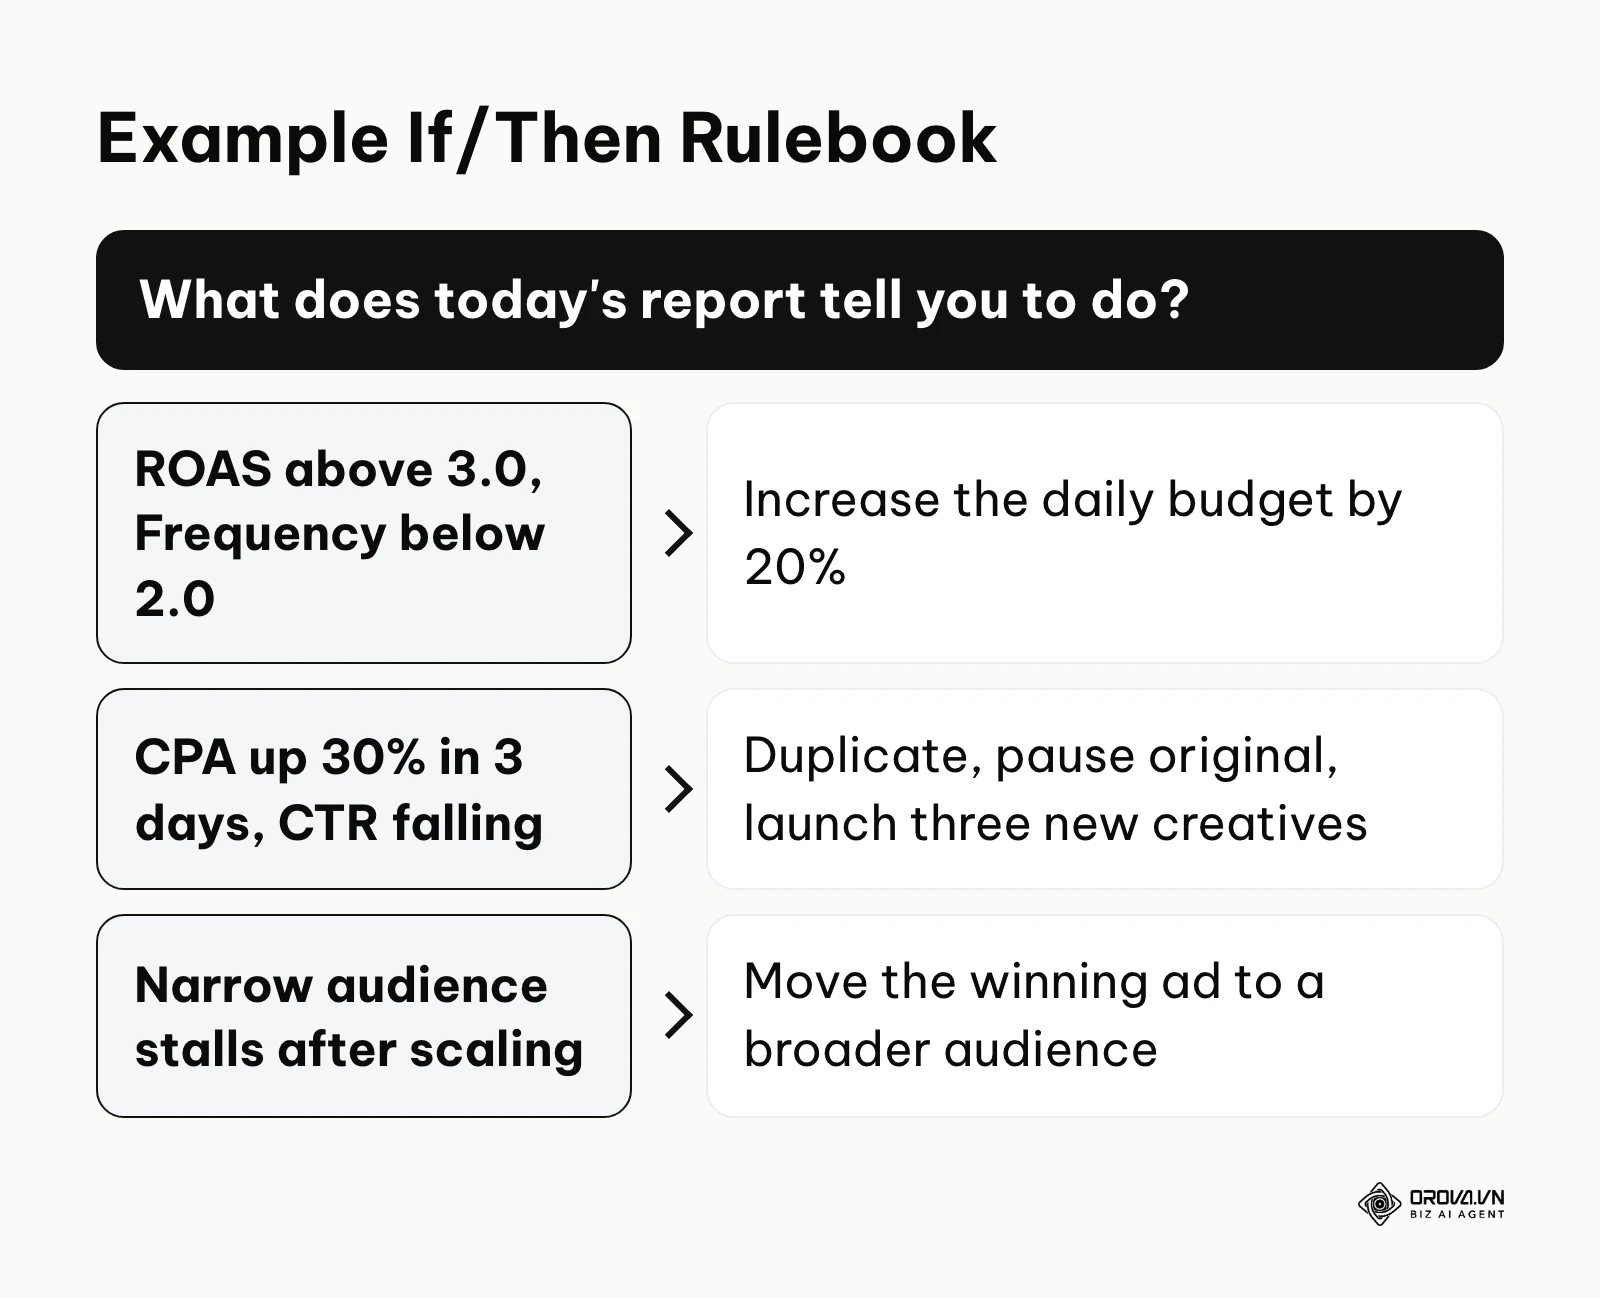
How to execute: Build an operational rulebook. The thresholds below are examples only; replace them with numbers drawn from your own margins and history. For instance: IF the ROAS is above 3.0 and Frequency is below 2.0, THEN increase the daily budget by 20%. IF the CPA has spiked by 30% over three days and the CTR is dropping, THEN duplicate the ad set, pause the original, and launch three new creatives. Managing your ads budget requires strict adherence to these rules to remove emotion from the scaling process.
Success sign: You can hand your reporting dashboard to a junior media buyer, and they will know exactly what buttons to push inside the account without asking for permission.
Common errors: Making massive budget cuts immediately after a bad day. The algorithm needs time to stabilize after any significant change. Over-tinkering based on hourly reporting is the fastest way to break a profitable campaign.
Illustrative example: Think of an agency account manager handling a lead generation campaign for a real estate firm. They initially set up an internal rule to increase the budget by 20% manually if the Cost Per Lead (CPL) stayed below the client's target. Then, they monitored the delivery over three consecutive days. The stumbling block occurred when the budget increased, but the Meta algorithm couldn't find new audiences in the narrow targeting pool, causing the CPM to double and stalling the campaign entirely. The fix involved changing the action plan: instead of vertically scaling the budget on the exact same ad set, they duplicated the winning ad into a new, broader audience pool. The outcome was a steady flow of leads at the target CPL, visible as a consistent row of green metrics on their daily health tracker.
OROVA ADS applies AI Agent to automate and optimize ad performance on Google, Meta and TikTok. Scale your budget safely, monitor 24/7 and expand your business quickly.
Experience the solution at orova.vn/ads
Deep dive: Meta tracking versus third-party attribution
The greatest source of confusion in any facebook ads report is the discrepancy between what Meta claims and what your Google Analytics or backend CRM reports. This is not a glitch; it is a fundamental difference in how systems attribute success.
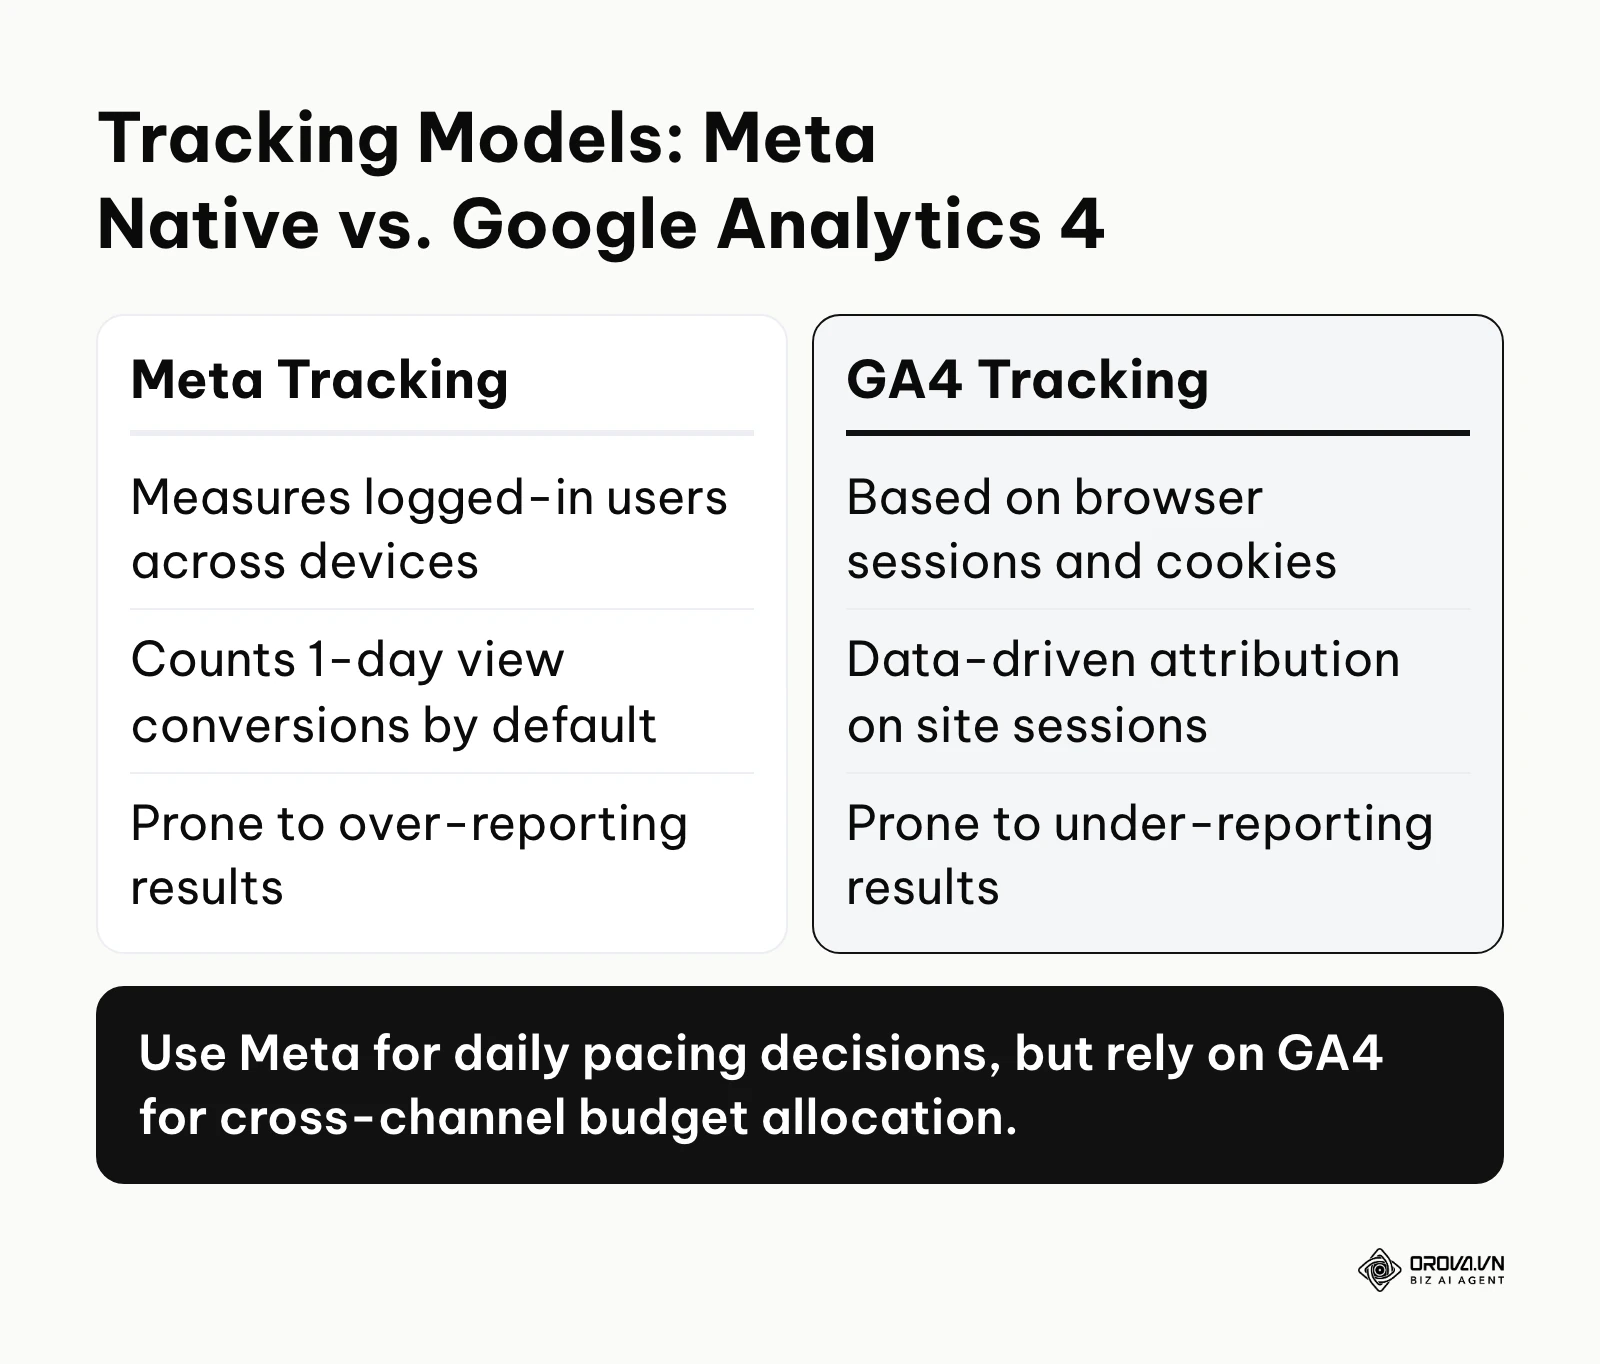
You should expect some natural variance between a native ad platform and third-party analytics, because each uses a different attribution model; the goal is to understand and track the gap, not eliminate it. Meta measures logged-in users across devices. If a user clicks an ad on their phone on Monday, but buys on their laptop on Thursday via a direct search, Meta can still count that purchase as a conversion from the ad because it recognizes the same account.
Conversely, GA4 relies on cookies and session data. In the same scenario, GA4 will likely attribute the sale to "Direct Traffic" or "Organic Search," completely ignoring the initial Meta ad touchpoint because the session broke across devices.
| Attribution Method | Best suited for | Major Weaknesses |
|---|---|---|
| Meta Native Tracking | Daily intra-platform optimization and bidding | Prone to over-reporting; ignores other channel impacts |
| Google Analytics 4 | Cross-channel budget allocation and journey mapping | Prone to under-reporting; loses data across devices |
| Backend CRM (Shopify/Hubspot) | The ultimate financial truth and profit calculation | Lacks granular ad-level data; cannot optimize in real-time |
To navigate this, you must adopt a blended approach. Use Meta's data to determine which specific ad creative is winning against other creatives within Meta. Use your backend CRM data to determine your overall blended ROAS across the entire business. Never try to make the two numbers match perfectly; use them for different operational purposes.
Measuring results: The traffic light diagnostic framework
Staring at a spreadsheet full of numbers causes decision fatigue. To accelerate your optimization, you should format your facebook ads report using a traffic light framework. This visual system applies conditional formatting to your core metrics, instantly highlighting what needs attention.
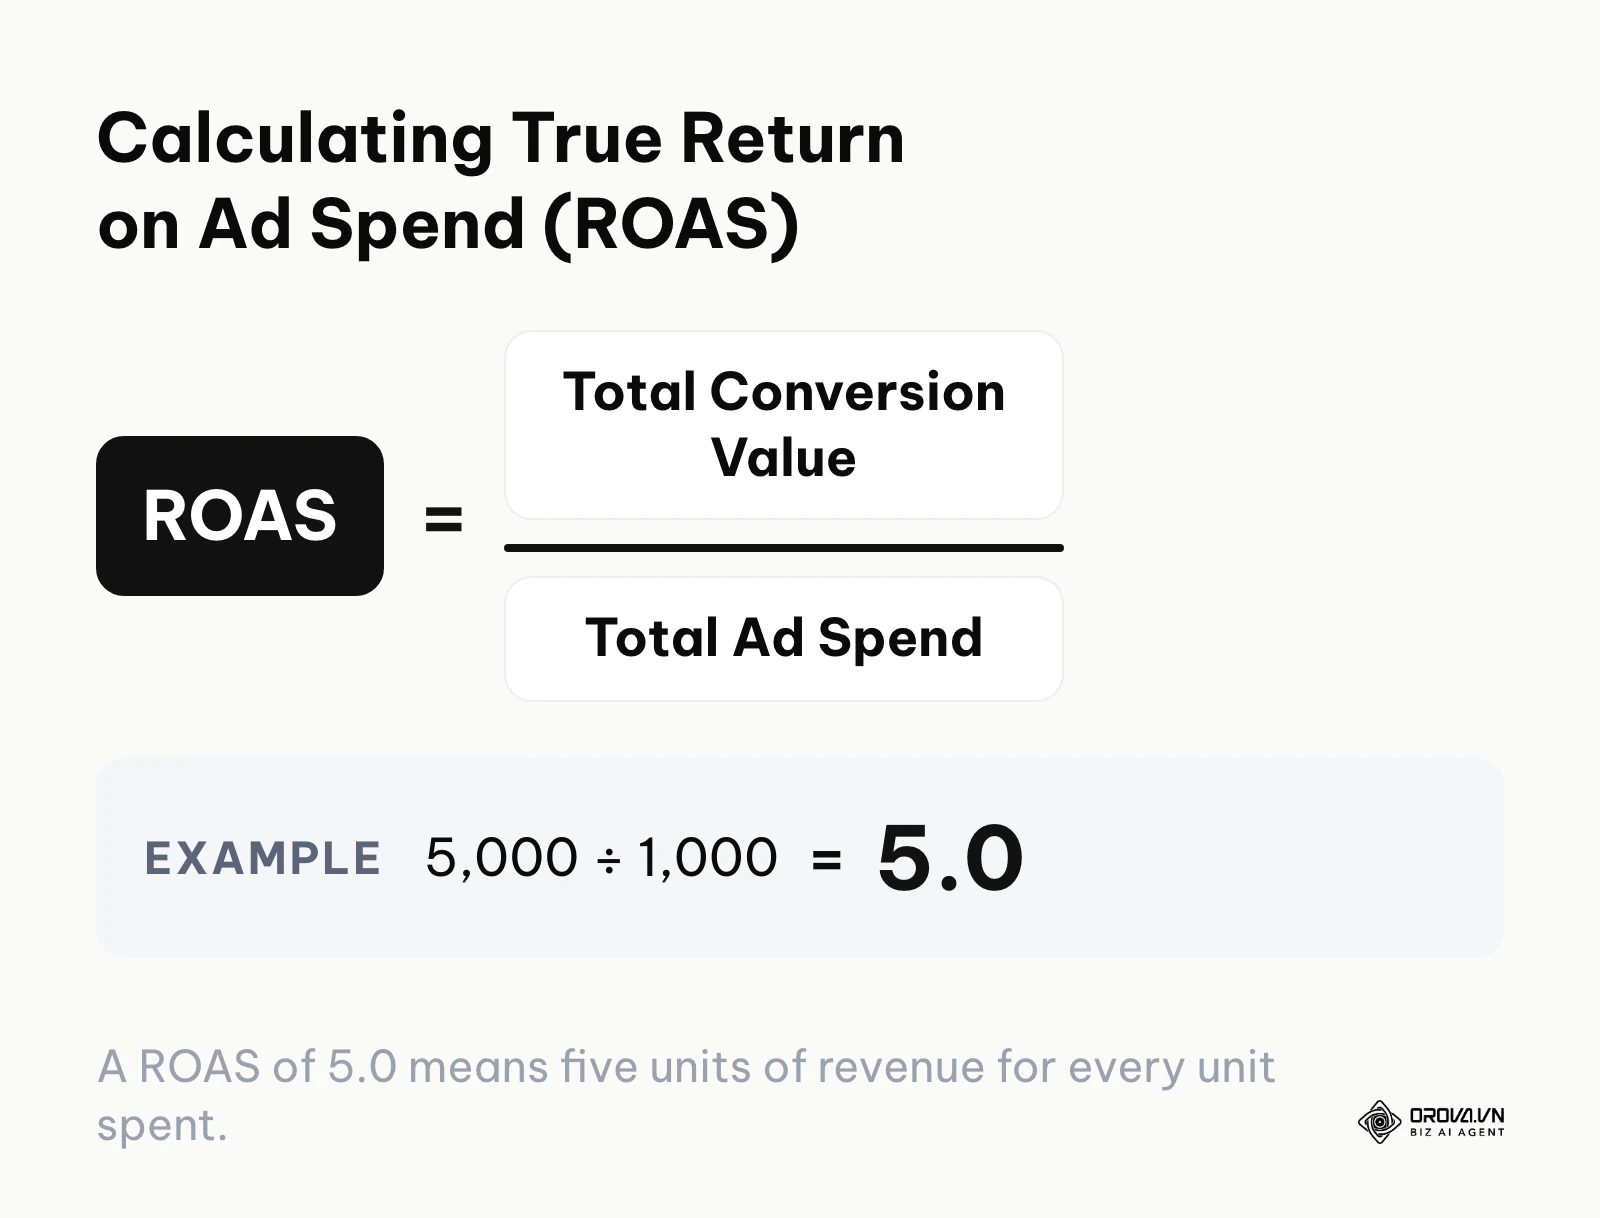
Start with the one number every row is judged against. ROAS is total conversion value divided by total ad spend: 5,000 in tracked purchase value on 1,000 of spend gives a ROAS of 5.0, meaning five units of revenue for every unit spent, in whatever currency your account uses. Before you color anything, work out your break-even ROAS from your gross margin, because a 2.0 ROAS can be profitable for one business and a loss for another.
You must establish baselines for your specific industry, but the framework functions uniformly. Export your data to a spreadsheet and set up the following color-coded thresholds:
| Metric | Meaning & Action | Warning Threshold |
|---|---|---|
| Green (Healthy) | The campaign is hitting KPIs. Action: Scale budget gradually. | ROAS above target, CPA below target, CTR at or above your own 30-day baseline |
| Yellow (Warning) | Performance is degrading. Action: Investigate root causes, prepare new creatives. | ROAS down 15% versus its 7-day average, Frequency above your fatigue level |
| Red (Critical) | The campaign is losing money. Action: Pause or sharply cut budget after checking tracking. | ROAS below break-even, CPA more than 50% above target |
By standardizing this view, anyone on your team can open the report at 9:00 AM and know exactly which campaigns require intervention within thirty seconds. It shifts the focus from merely reporting data to executing rapid optimizations based on clear visual triggers.
Want to scale your budget but afraid of breaking performance? 📉
Integrate OROVA ADS now - an AI Agent that automatically monitors and optimizes Google, Meta, TikTok ads 24/7. Now, expanding and replicating your Performance Ads team is just one click away.
🚀 Try it now at: orova.vn/ads
Common mistakes in Facebook ads reporting
Even experienced media buyers fall into reporting traps that cost thousands of dollars in wasted spend. Recognizing these mistakes is the first step to building a reliable workflow.
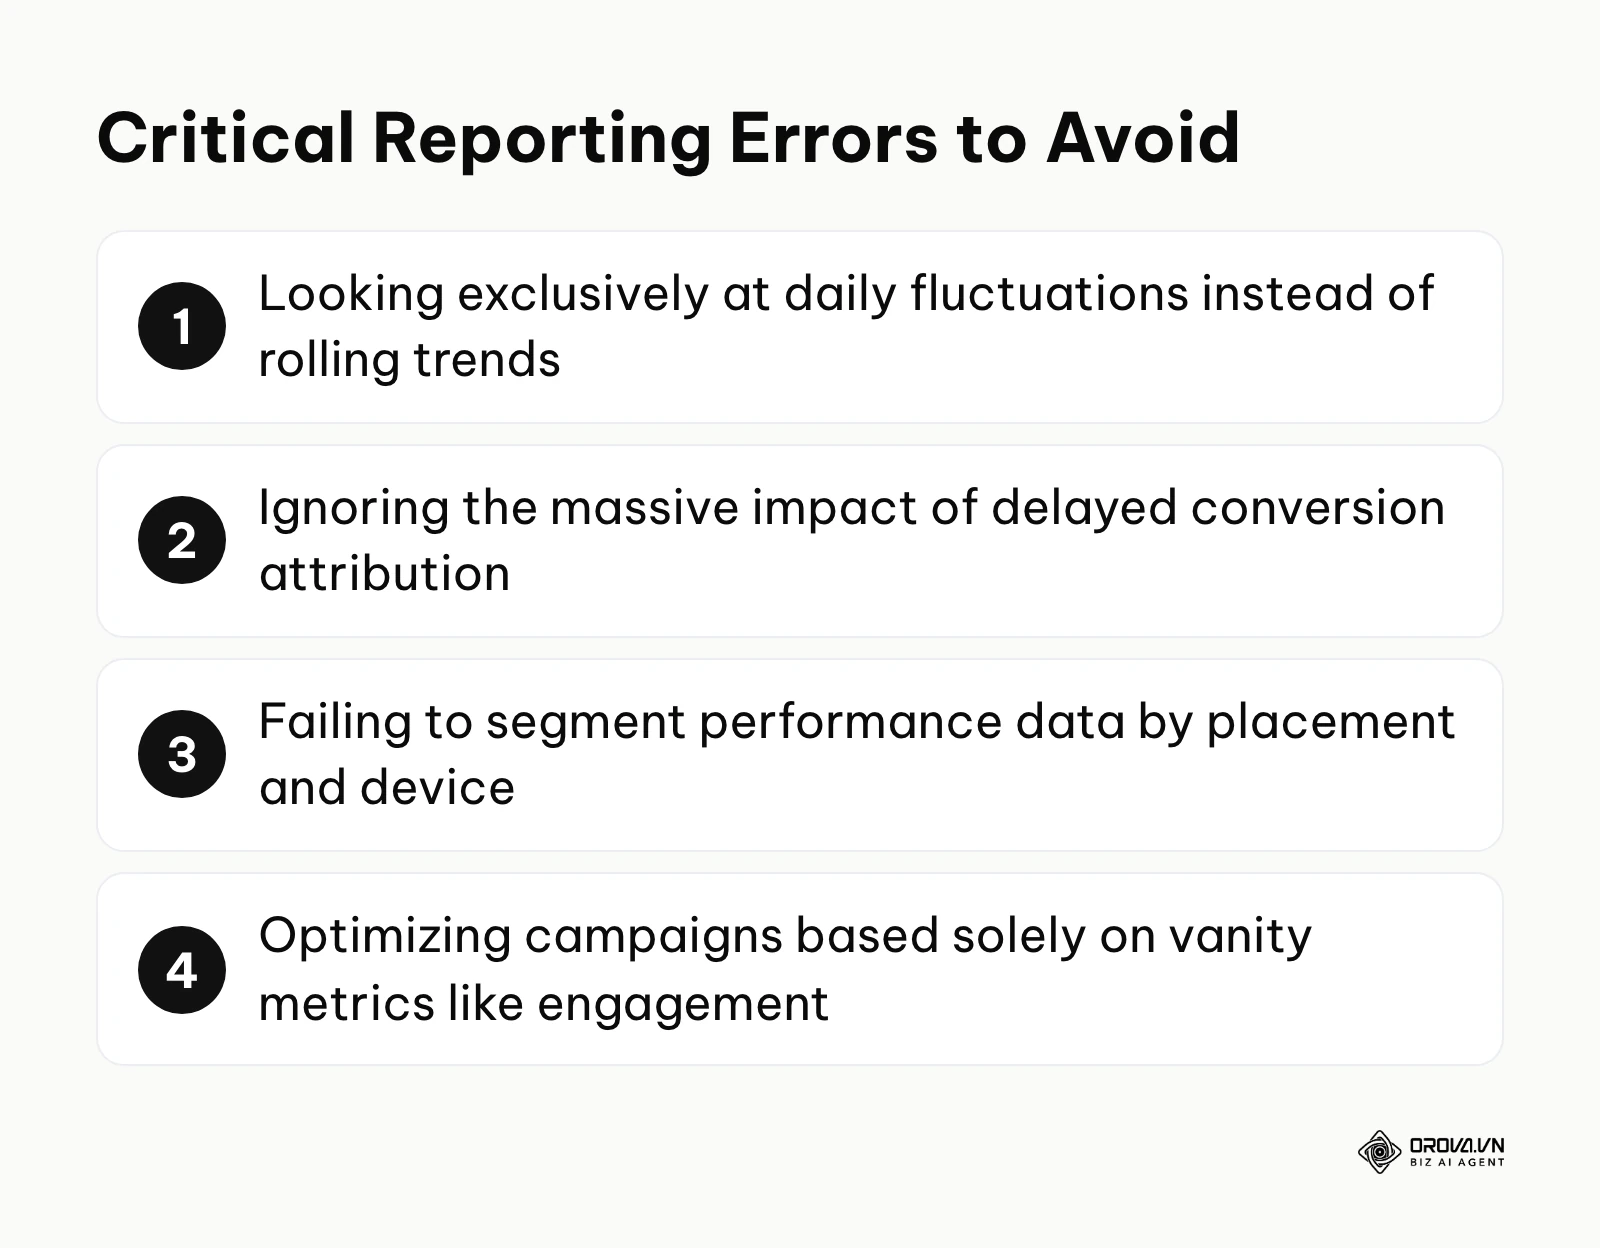
- Ignoring delayed attribution: Meta's default attribution setting is 7-day click and 1-day view. If you launch a campaign on Monday and judge the results on Tuesday morning, you are looking at incomplete data. Many users take days to convert. Pausing an ad before the attribution window closes guarantees you will kill profitable campaigns. Wait at least 72 hours before making decisive judgments.
- Failing to segment by placement: Looking at a blended CPA is dangerous. Your Instagram Stories placement might deliver purchases at a CPA well below target, while the Audience Network placement costs five times as much per purchase. If you only look at the blended average in your main facebook ads report, you miss the opportunity to turn off the bleeding network. Always break down reports by Platform and Placement.
- Misunderstanding cost caps: When advertisers panic over rising CPAs, they often apply aggressive bid caps without understanding the mechanics. If you set a cap too low, the report won't show a bad CPA—it will show zero spend because the algorithm stops delivering entirely. Using a facebook ads cost cap correctly requires analyzing your historical conversion rates first.
- Optimizing for vanity engagement: High likes, comments, and shares look great in a client report, but they do not pay the bills. The algorithm will happily spend your entire budget finding people who click "like" but never buy. Never optimize a conversion campaign based on engagement metrics.
- Over-reacting to microscopic data: Checking your Ads Manager five times a day leads to emotional decision-making. Daily fluctuations are normal. A campaign that looks terrible at 2:00 PM might normalize by 9:00 PM. Always base major budget decisions on rolling 3-day or 7-day averages.
A quick self-check before you change anything
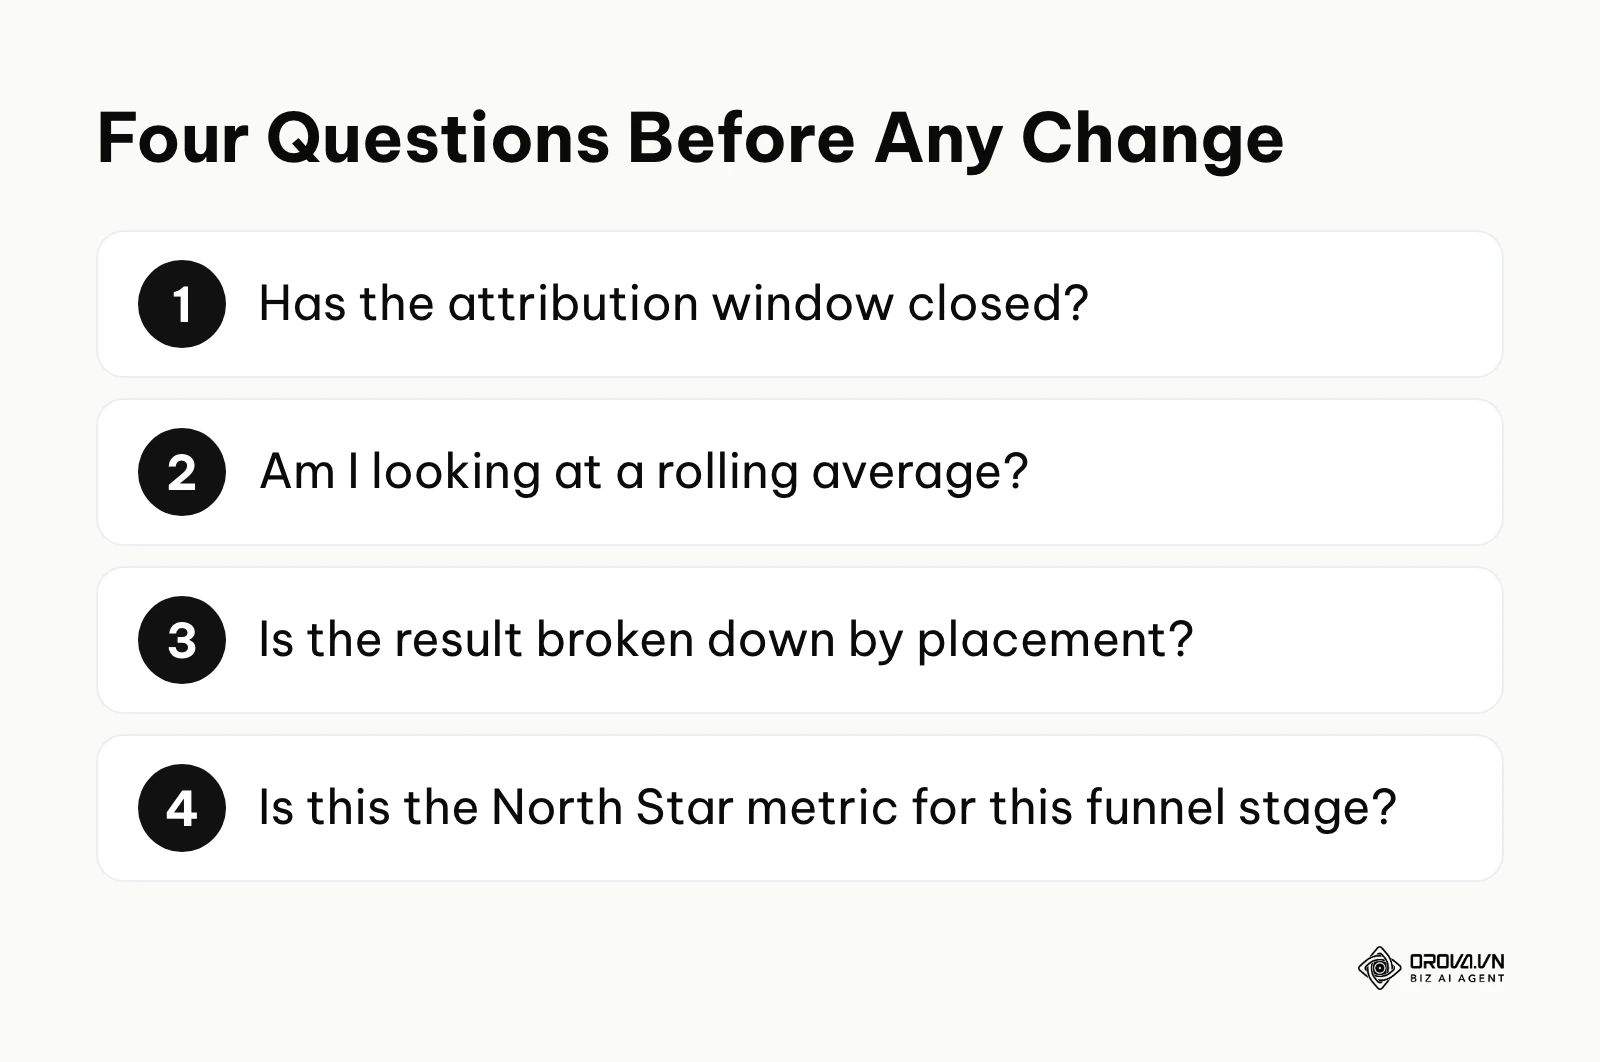
Most of these mistakes share one root: judging a campaign from a single snapshot instead of a trend with context. A quick self-check helps. Before any change, ask whether the attribution window has closed, whether you are looking at a rolling average, whether the result is broken down by placement, and whether the metric you are reacting to is the North Star for that funnel stage. If any answer is no, wait or dig deeper before touching the budget.
Future trends in Facebook ads reporting: My perspective
AI-driven predictive forecasting will replace historical reporting
I expect a gradual shift away from looking backward. Today, most reports tell you what happened yesterday. I think that over the next few years, the standard facebook ads report will lean increasingly toward prediction. AI models will analyze your current pacing, historical seasonality, and real-time market auction dynamics to forecast what your CPA will be next week. Instead of reacting to a cost spike, marketers will receive warnings to adjust budgets before the spike occurs. You should begin familiarizing yourself with predictive analytics tools now, ensuring your data warehousing is clean enough to feed these upcoming AI models.
Privacy regulations will force a return to macro-measurement
The slow death of the third-party cookie has been happening for years, but the tightening of global privacy laws is accelerating. I expect granular, user-level tracking to keep getting harder. Instead of relying only on exact click paths, I believe more advertisers will lean on Media Mix Modeling (MMM) and incrementality testing as core reporting methods. We will stop asking "Which ad drove this specific sale?" and start asking "If I increase Meta spend by 10%, how much does overall revenue lift?" To prepare, you must stop relying entirely on platform-reported ROAS and start building robust financial models that track overall marketing efficiency ratio (MER).
Creative data will become the ultimate optimization lever
Currently, most reporting focuses heavily on audience targeting and bidding strategies. However, as AI takes over the technical targeting (like Meta's Advantage+ campaigns), the only variable left to control is the creative. I think reporting dashboards will increasingly analyze video hooks, color palettes, and emotional sentiment. We will see reports that tell us exactly which two seconds of a video caused the highest drop-off rate, segmented by demographic. To stay ahead, you need to transition your reporting focus away from audience adjustments and start meticulously categorizing and tagging every creative asset you deploy.
Frequently asked questions about Facebook ads reporting
How often should I check my Meta Ads reports?
You should monitor pacing and critical errors daily, but you should only make major budget or creative decisions based on 3-day or 7-day rolling averages. Checking hourly will lead to emotional over-optimization and disrupt the platform's machine learning phase.
Why does my Meta report show more sales than my backend system?
Meta utilizes a 7-day click and 1-day view attribution model, meaning it claims credit if a user simply saw your ad and bought later through another channel. Your backend system simply records the orders that actually happened, without crediting ad views. This fundamental difference causes the reporting discrepancy.
What is the best way to handle Advantage+ campaign reporting?
Advantage+ campaigns reduce granular audience control, making traditional reporting difficult. You must evaluate these campaigns on a macro level, looking strictly at blended CPA and overall account ROAS. Where Ads Manager offers a breakdown between new and existing customers, use it to check that the algorithm is not mostly spending on people who already buy from you.
How is AI changing the way we generate these reports?
AI is shifting reporting from manual data entry to automated insight generation. Instead of exporting CSVs and building pivot tables, AI tools now connect directly via API, clean the data, identify statistical anomalies, and generate plain-language summaries explaining exactly why a metric dropped and what specific action to take next.
Is the Conversions API mandatory for accurate reporting?
It is not technically required, but it is strongly recommended. As browser-based pixel tracking loses signal due to privacy updates and ad blockers, the Conversions API lets you send server-side events back to Meta. Without it, your reports are more likely to under-count conversions and misattribute results.
Where should you start?
Improving your reporting workflow does not require a massive overnight overhaul. The best approach is to identify your current operational bottleneck and execute one highly specific action to fix it.
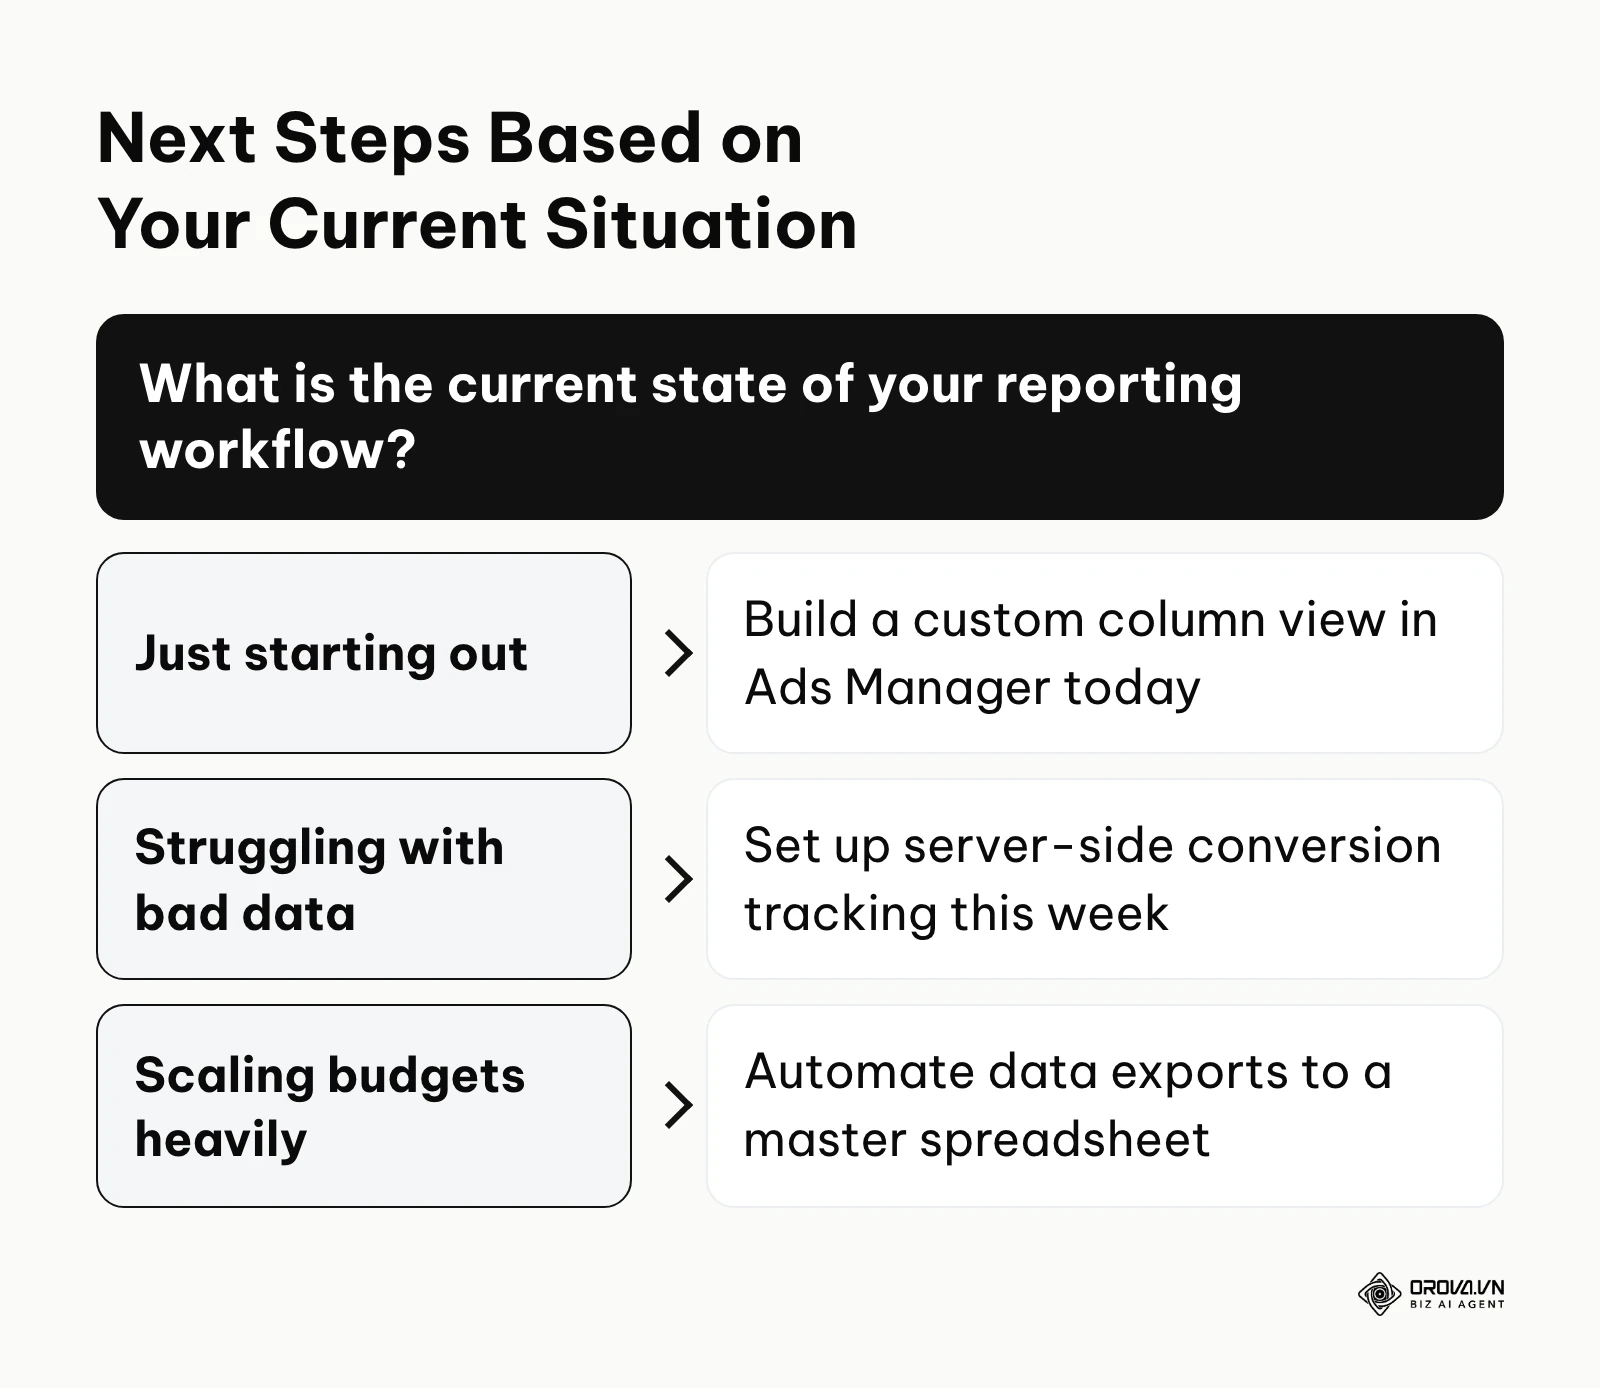
If you are a founder running your first campaigns and feeling overwhelmed by the default data, your immediate step is to build a custom diagnostic view. Spend fifteen minutes today customizing your Ads Manager columns to show only Outbound CTR, CPC, CPA, and ROAS. Save this as your default preset. This single action will instantly clear the noise and help you focus on the metrics that actually impact your cash flow.
If you are an agency marketer frustrated by constant discrepancies between what Meta reports and what the client sees in their CRM, your first step is to implement rigorous UTM standardization. Dedicate one afternoon to building a dynamic UTM template for your tracking URLs. This ensures that every click passed to Google Analytics is perfectly categorized by campaign, ad set, and ad name, laying the groundwork for accurate multi-channel reconciliation.
If you are scaling heavy budgets and finding that manual reporting is eating up hours of your week, your immediate move is to automate your data extraction. Connect Meta's API to a master spreadsheet using a basic connector tool. Set it to refresh daily at midnight. If you want to go further and push a finished summary to stakeholders automatically, our automated sales report guide walks through that setup. By removing the manual export process, you free up your mental bandwidth to actually analyze the facebook ads report and execute the strategic actions that drive growth.
About the author

Builder of Orova
Nguyễn Đỗ Trọng Ân has 8 years of experience in marketing, including 6 years managing market development across Asia. He builds Orova, a Biz AI Agent that never sleeps: it plans, runs and optimizes work for businesses.
Run your business with AI Agents
Orova is the always-on Biz AI Agent — it plans, runs, and optimizes the work for you.
Save time, unlock productivity.