
Search engine rank monitoring in 2026: beyond vanity metrics to real ROI

Imagine pouring thousands of dollars into content creation, securing the number one spot on Google, and waking up to find your organic traffic has plummeted by forty percent. You check your traditional dashboard, and it clearly states you are still at position one. Search engine rank monitoring exists to catch exactly this gap: it is the ongoing process of tracking where your pages appear in search results, how much of the screen they actually win, and what that visibility is worth in clicks and revenue. This terrifying scenario is the new reality of modern search. The familiar approach of simply checking where a single keyword sits on a list of ten blue links is no longer sufficient. Search engine result pages now feature AI overviews, zero-click answers, interactive widgets, and highly personalized results that completely obscure your true visibility. If you continue to rely on outdated tracking methods, you are navigating the digital landscape blindfolded. This comprehensive guide provides a deep dive into search engine rank monitoring for the AI era. It will help you build automated alert systems, shift your analytical focus from vanity metrics to actual share of voice, and create actionable defense mechanisms against algorithm volatility. Ultimately, this framework ensures your SEO (search engine optimization) work translates into tangible business value rather than just impressive charts.
Search engine rank monitoring essentials
Search engine rank monitoring is the continuous, systematic process of tracking where your website's pages appear in search engine results for specific queries. It involves analyzing visibility trends over time and measuring the direct impact of those positions on your overall traffic, user engagement, and revenue generation. It serves as the critical bridge between your marketing execution and your financial measurement.
Any business that relies heavily on organic acquisition needs a robust version of this process. It is absolutely essential for in-house marketing teams managing large content hubs, agencies responsible for reporting definitive ROI to clients, and technical specialists who need to debug complex architecture issues rapidly. However, you should not obsess over this intense daily monitoring process if your website is brand new and lacks a sufficient volume of indexed pages. Furthermore, if you operate in a hyper-niche offline market where direct traffic, word-of-mouth, and industry referrals completely dominate your customer acquisition channels, complex tracking is unnecessary. In those specific early-stage scenarios, ensuring foundational technical health and focusing on consistent content production must take precedence over daily statistical tracking.
Preparation and foundational setup
Before diving into complex tracking methodologies and dashboard setups, you need to establish a solid data foundation. Attempting to track numerical positions without clean data or a clearly defined SEO strategy will inevitably lead to statistical noise and constant false alarms. You must meticulously define what metrics actually matter to your business's bottom line, rather than trying to track every random keyword your site accidentally ranks for due to broad matching. Preparation is the key to preventing analysis paralysis later in the process.
| Required Asset | Where to obtain it | Estimated setup time |
|---|---|---|
| Google Search Console (GSC) account | search.google.com/search-console | 15 minutes (requires DNS or HTML tag verification) |
| Core topic cluster map | Internal strategy documents or spreadsheet | 2 to 4 hours depending on website scale |
| Looker Studio account | Google Looker Studio platform | 5 minutes (requires a standard Google account) |
| Web analytics platform | Google Analytics 4, Matomo, or Plausible | 30 minutes for basic tag implementation |
| Baseline performance data | Exported directly from GSC (last 3 to 6 months) | 10 minutes for data extraction |
Your topic cluster map is arguably the most critical asset in this preparatory phase. Instead of managing a massive, flat list of thousands of keywords, you need a hierarchical structure that groups terms logically by user intent and business relevance. This deliberate preparation ensures that when you eventually build your automated monitoring system, the resulting data reflects your actual market segments and product categories accurately. Without this map, you will have data, but you will not have direction.
6 steps to build an automated rank tracking system
Moving beyond manual, ad-hoc checks requires a highly systematic approach. Relying on an intern to search terms every Friday is a recipe for disaster. This section details a rigorous six-step methodology to establish a resilient, automated tracking framework. This framework is designed to provide actionable strategic insights rather than just overwhelming you with raw data points.
Step 1: Defining Topic Clusters and Share of Voice
Tracking single keywords in isolation is a fundamentally flawed strategy because modern search engines process natural language and understand complex entity relationships. A single comprehensive page can rank for thousands of long-tail variations simultaneously. If you only track the primary head term, you miss the broader picture entirely. You must group your keywords into logical topic clusters and measure the "Share of Voice" for the entire cluster as a single unit. Share of Voice calculates your website's total visibility percentage across all tracked keywords in a specific category, weighted heavily by their respective search volumes.
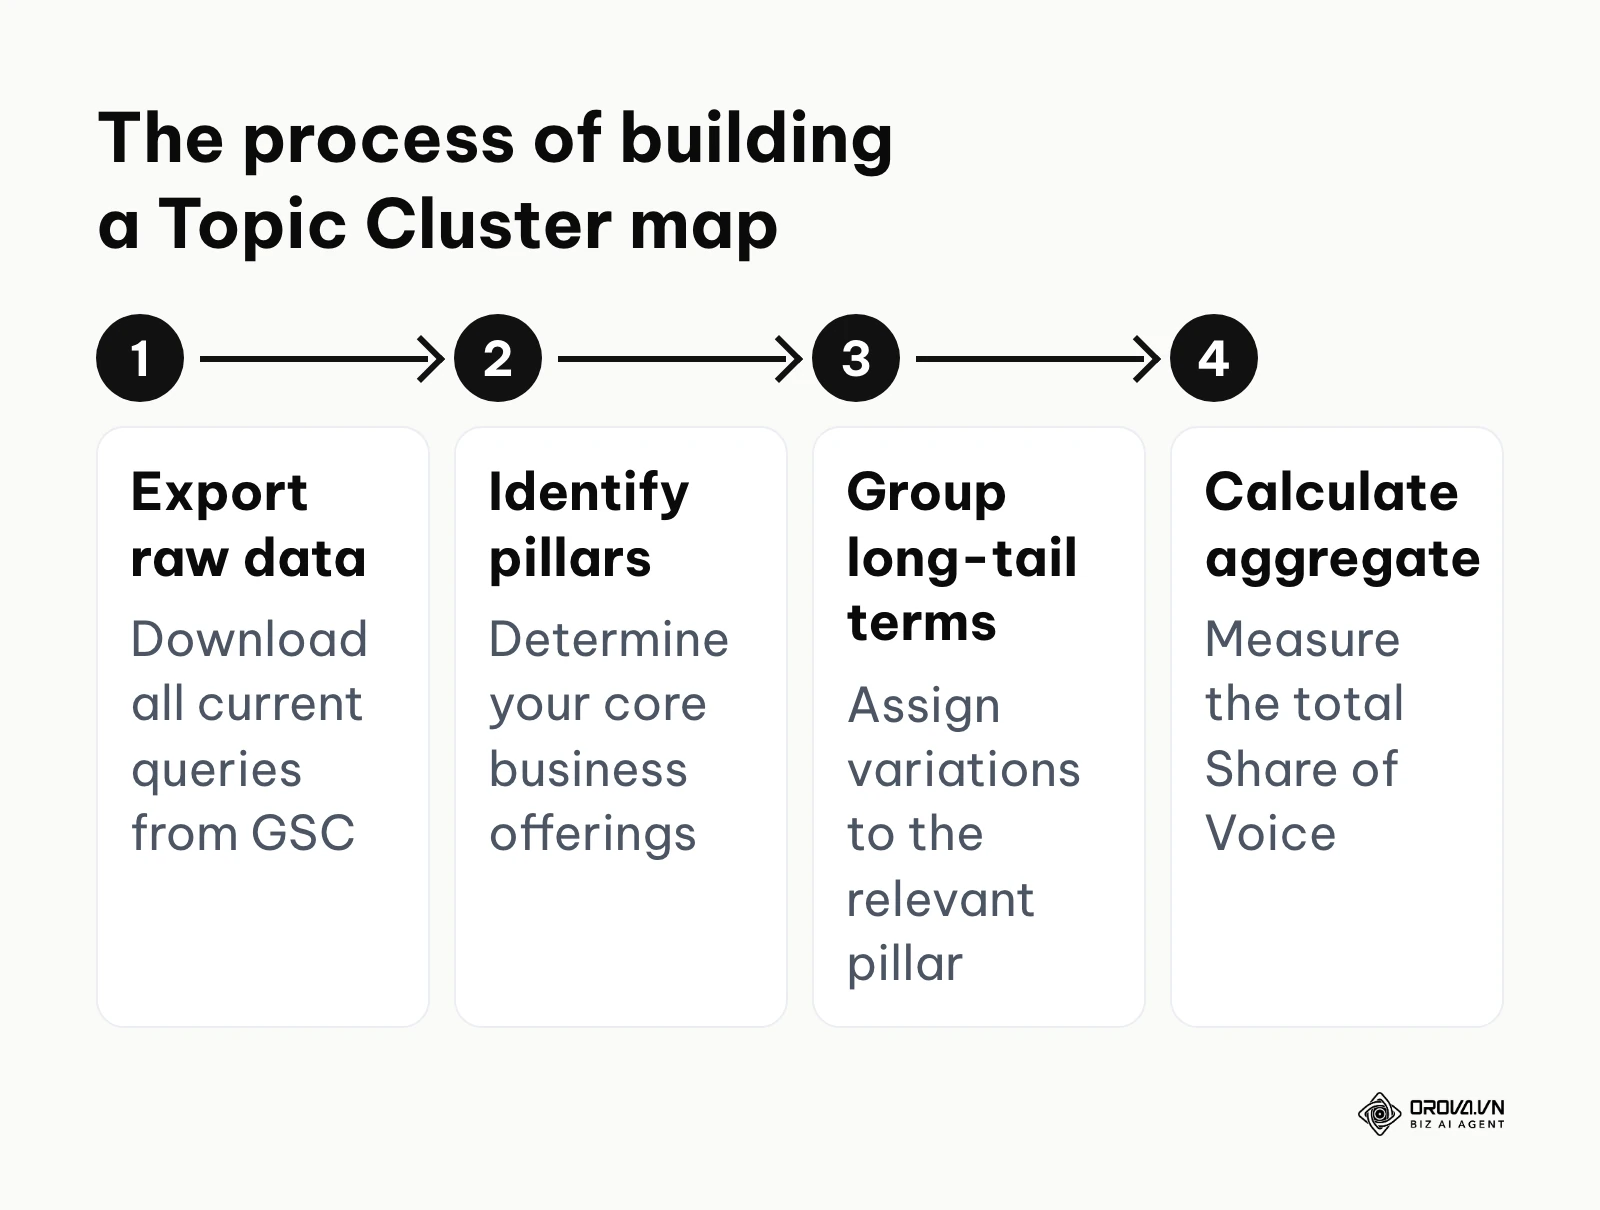
To execute this properly, export your current ranking data from your primary analytics tools. Categorize these disparate terms based on the core pillar pages they support. For example, if you sell marketing software, group all terms strictly related to "email automation," "drip campaigns," and "newsletter software" into a unified "Email Marketing" cluster. When you monitor this cluster's aggregate performance, you will often find that a temporary drop in one obscure long-tail keyword is offset by a sudden rise in another. This aggregate view gives you a true, stable representation of your actual market presence.
Illustrative example:
- Context: A mid-sized B2B software company was panicking because their primary head term, "inventory management software," kept fluctuating wildly between position three and position six. This caused extreme stress during weekly executive reporting sessions.
- Steps taken: The team exported 5,000 active ranking keywords from GSC. They meticulously categorized them into three distinct clusters: "enterprise inventory," "barcode scanning," and "warehouse routing." They then calculated the aggregate Share of Voice for each cluster using a custom weighted formula based on monthly search volume.
- Obstacle and fix: The team initially struggled immensely to manually categorize thousands of terms, wasting hours. They fixed this bottleneck by using simple spreadsheet functions to automatically tag keywords containing specific modifiers, speeding up the process drastically.
- Result: The team realized that while the highly visible head term fluctuated, their overall Share of Voice in the highly lucrative "barcode scanning" cluster had actually grown by fifteen percent over the quarter. This growth led to a steady increase in highly qualified trial sign-ups, completely eliminating the weekly executive panic regarding the single vanity keyword.
Step 2: Setting up Google Sheets for cluster tagging
To automate your cluster tracking effectively without immediately investing in expensive enterprise-grade software, you can utilize a custom Google Sheets template combined directly with Google Search Console data exports. You need a reliable system that automatically tags new queries as they appear in your search reports, removing the need for constant manual intervention.
Start by creating a new Google Sheet. In the first tab, name it "Raw Data" and set it up to receive raw exports from GSC containing the standard columns (Query, Clicks, Impressions, CTR, Position). In the second tab, name it "Tagging Rules." Create two specific columns here: "Keyword Modifier" and "Cluster Name." List common informational modifiers (e.g., "how to," "guide," "tutorial," "what is") and assign them firmly to an "Informational" cluster. List your transactional modifiers (e.g., "buy," "pricing," "software," "platform") and assign them to a "Commercial" cluster. This taxonomy is vital. A starter version of the "Tagging Rules" tab looks like this (put the most specific modifiers at the top, because the first match wins):
| Keyword Modifier | Cluster Name |
|---|---|
| inventory software | Product: Inventory |
| barcode | Product: Barcode Scanning |
| pricing | Commercial |
| buy | Commercial |
| how to | Informational |
| what is | Informational |
In your "Raw Data" tab, create a new column called "Assigned Cluster." You must use an array formula combined with a VLOOKUP or regular expressions (REGEXMATCH) to dynamically check the "Query" column against your "Tagging Rules" tab. A proper formula setup ensures that every single piece of ranking data imported is instantly and accurately categorized without human touch. You can then easily use pivot tables on this data to summarize average position and total impression share by cluster, rather than being distracted by the noise of individual keyword movements. A tagged row in the "Raw Data" tab then reads like this:
| Query | Clicks | Impressions | CTR | Position | Assigned Cluster |
|---|---|---|---|---|---|
| how to track keyword rankings | 40 | 2,100 | 1.9% | 8.4 | Informational |
| barcode scanner app for warehouse | 25 | 900 | 2.8% | 5.1 | Product: Barcode Scanning |
| inventory software pricing | 12 | 300 | 4.0% | 6.7 | Product: Inventory |
Step 3: Filtering personalized search noise
One of the most insidious challenges in search engine rank monitoring is dealing with personalized search results. If you search for your own target keywords repeatedly on your work computer, the results you see can be shaped by your search history, location and device, and your own site may look stronger than it does for an average user. This algorithmic behavior creates a dangerous illusion of success that does not reflect reality.
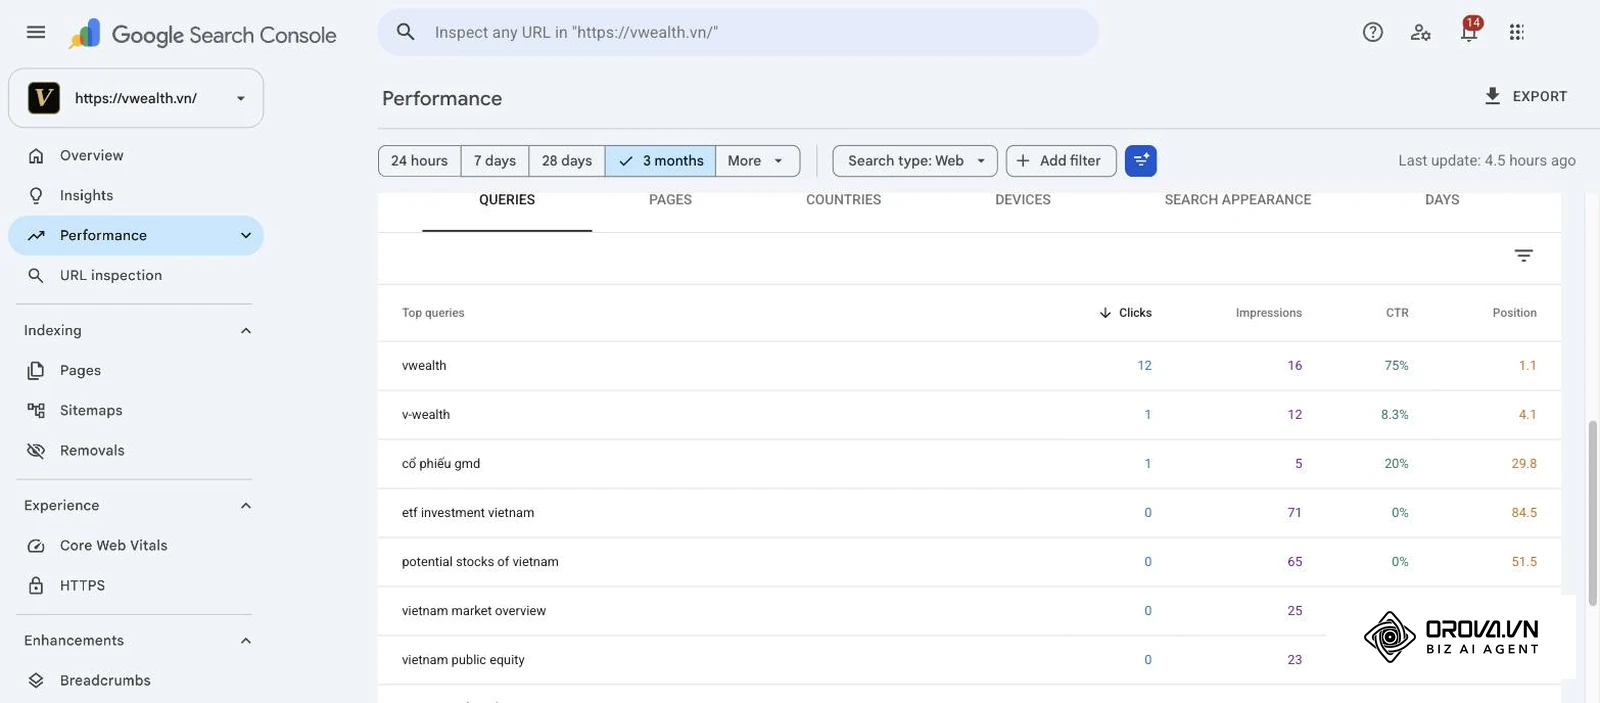
To find your true, objective ranking position, you must systematically eliminate this personalization noise. Never rely on manual searches in a standard browser window to verify a ranking. Even utilizing Incognito mode or Private Browsing is not entirely immune, as broad IP addresses, geographic location data, and subtle device fingerprinting can still heavily influence the final results you see.
Instead of manual checking, rely primarily on the "Average Position" metric found within Google Search Console. This metric aggregates data across thousands of anonymous users and effectively neutralizes individual personalization biases. However, you must remember that GSC's average position is exactly that—a mathematical average. If your crucial landing page ranks at position one for users in New York but drops to position twenty for users in London, your dashboard might display an average of around position ten. To filter this geographic noise effectively, always apply the "Country" dimension filter in GSC when conducting serious rank analysis. If you require absolute point-in-time checks for a presentation, use specialized third-party rank checking services that let you specify the exact location and device type for the search query, bypassing local browser-level personalization entirely.
Step 4: Configuring Looker Studio and GSC alerts
Checking multiple dashboards daily is highly inefficient and leads to data fatigue. You need an automated system that pushes critical information directly to you, but only when significant, actionable changes occur. By connecting Google Search Console to Looker Studio, you can create a customized, automated alert report. While Google Search Console for SEO provides the raw foundational data, Looker Studio provides the essential logical layer. (Some Google help pages now say Looker Studio is being renamed Data Studio; the connector and the steps below are the same.)
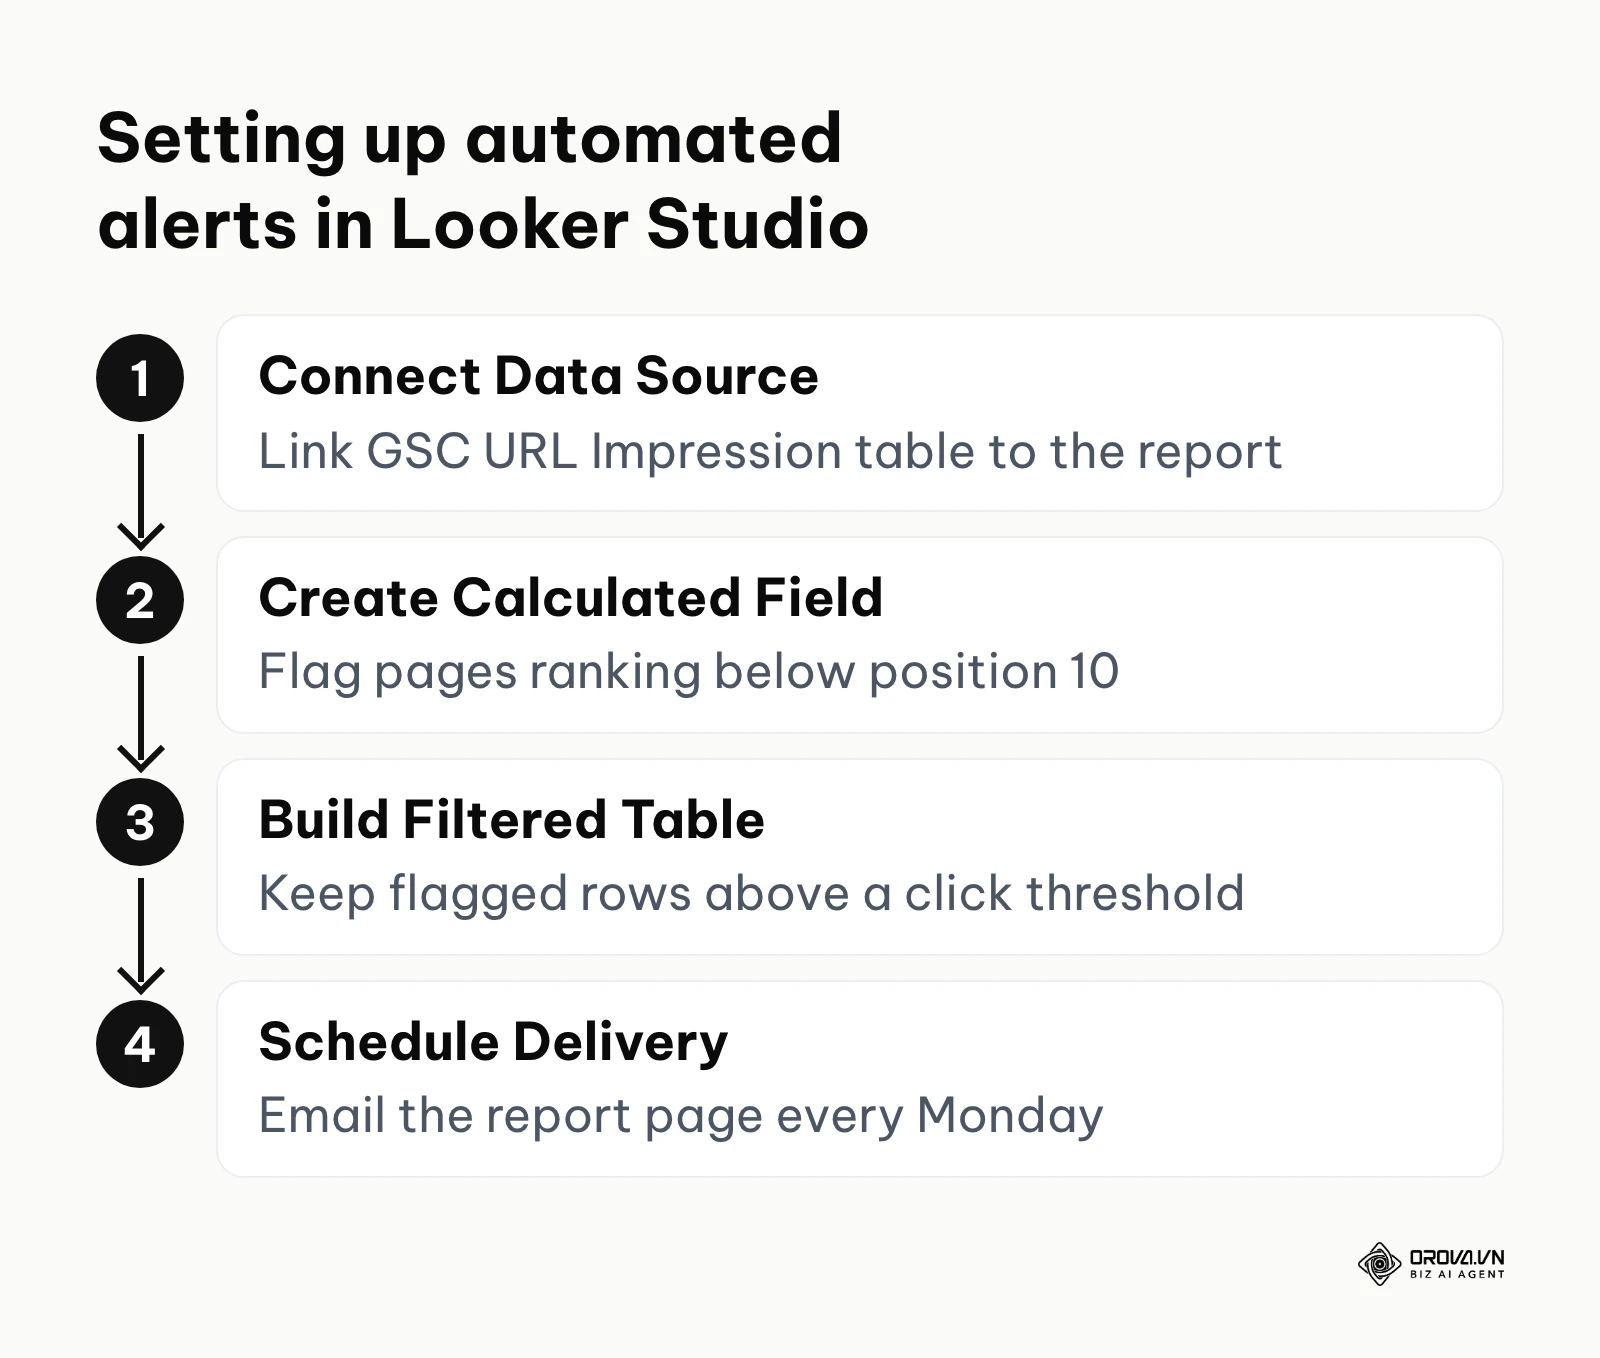
Start by opening the Looker Studio interface and creating a new blank report from scratch. Add a new data source and select the official Google Search Console connector. Crucially, choose the "URL Impression" table rather than the "Site Impression" table, which gives you granular page-level data necessary for deep analysis. Create a standard time series chart displaying "Average Position" and "Clicks" over time to visualize the baseline.
To set up the actual alert system, you must create a new calculated field within your data source schema. Name this field "Position Flag." Use a precise formula logic like: CASE WHEN Average Position > 10 THEN "Review Needed" ELSE "OK" END. Create a simple table chart that shows only rows where this new flag equals "Review Needed" and where "Clicks" for the selected period exceed a baseline threshold you choose (e.g., 100 clicks). Turn on the comparison date range (previous period) so the table also shows how much clicks and position changed. Finally, use the "Schedule delivery" option in Looker Studio to email this report page to your inbox every Monday morning. You now have a free weekly alert that lists only high-traffic pages that have slipped outside the top ten, saving hours of manual review. Once the alert is running, fold the flagged pages into your monthly SEO report so trends and actions are recorded in one place.
Step 5: Measuring Pixel Visibility against AI Overviews
The recent introduction of AI-generated summaries placed directly at the top of search results has fundamentally disrupted traditional rank tracking logic. Being statistically "position one" below a massive AI Overview block and four sponsored advertisement slots means your organic result might be entirely below the fold on a standard mobile device. This is the harsh zero-click search reality. You must transition your mindset from tracking integer positions to tracking actual "Pixel Visibility."
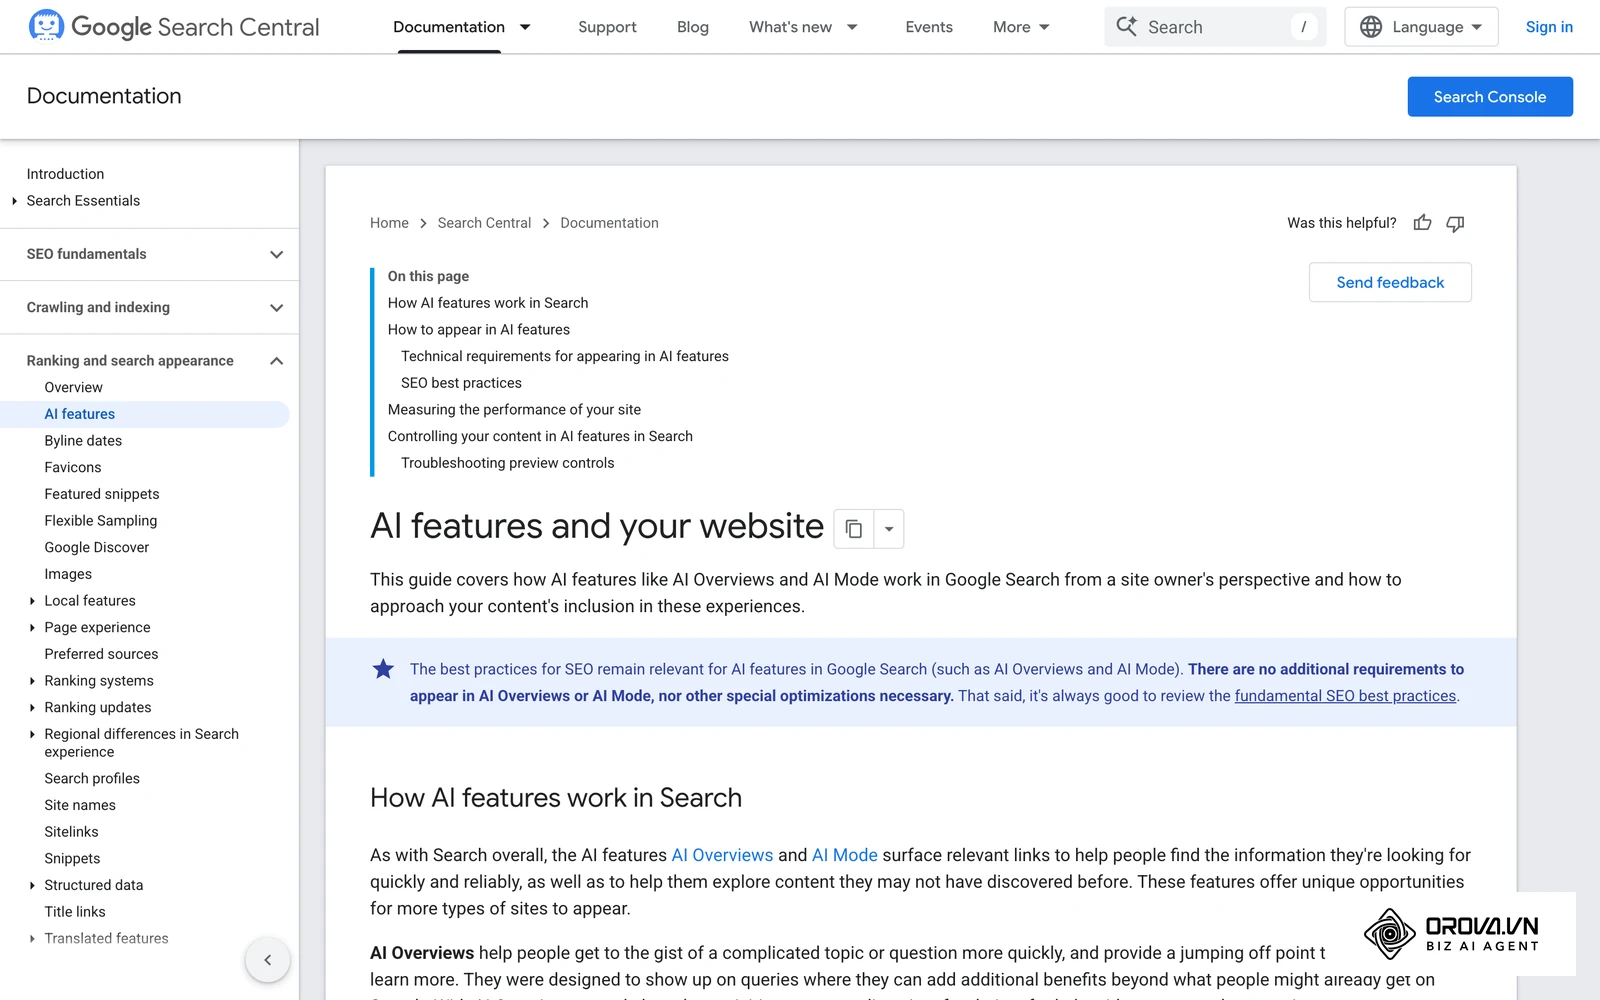
Pixel Visibility conceptually measures how much physical screen real estate your snippet occupies and exactly how far down the digital page it appears. While standard GSC reporting does not explicitly report pixel depth in its interface, you can accurately infer your visibility by closely monitoring the historical correlation between your Average Position and your Click-Through Rate (CTR).
If a primary keyword maintains a stable position one for three consecutive months, but its CTR drops dramatically from thirty percent to five percent, it is highly likely that an AI Overview, a complex Featured Snippet, or a new aggressive ad block has physically pushed your organic result down the screen. You must meticulously annotate these specific CTR drops in your tracking sheets. When you identify a severe loss in Pixel Visibility despite technically stable rankings, the required action is not traditional link building or keyword stuffing. The correct action is modifying your underlying content format to aggressively target the new SERP features. This might involve reformatting lengthy paragraphs into highly structured lists or clean tables to reclaim the Featured Snippet space directly above the fold.
Illustrative example:
- Context: A boutique financial advisory firm noticed a severe, unexplained drop in traffic to their most critical "retirement planning calculator" page. Their expensive rank tracker showed a rock-solid, stable position two for all their main keywords.
- Steps taken: The team analyzed the query data deep within GSC and confirmed the mathematical average position remained exactly at 2.1. They then manually inspected the live SERP using an unbiased geographic location simulator to see what users actually saw.
- Obstacle and fix: They discovered a massive new interactive Google widget and a lengthy AI-generated summary now occupied the entire first screen on mobile devices. Position two was functionally invisible without scrolling. They fixed this by summarizing their complex financial methodology into a short, highly structured bulleted list and a compact comparison table at the very top of the article, giving the page a better chance of being cited in the AI summary or earning a featured snippet.
- Result: While their integer ranking remained firmly at position two, the restructured page began appearing as a cited source and a featured snippet for several key queries. CTR climbed back over the following weeks and most of the lost lead generation traffic returned.
Step 6: Tracking ROI beyond vanity metrics
Rankings are ultimately vanity metrics; generated revenue is a sanity metric. If you achieve position one for a broad keyword with ten thousand searches a month, but that traffic yields exactly zero conversions, the entire rank monitoring process has failed to provide actual business value. You must deliberately connect your granular rank data directly to your financial outcomes. Many teams never make this connection, which leaves marketing budgets tied to positions instead of outcomes.
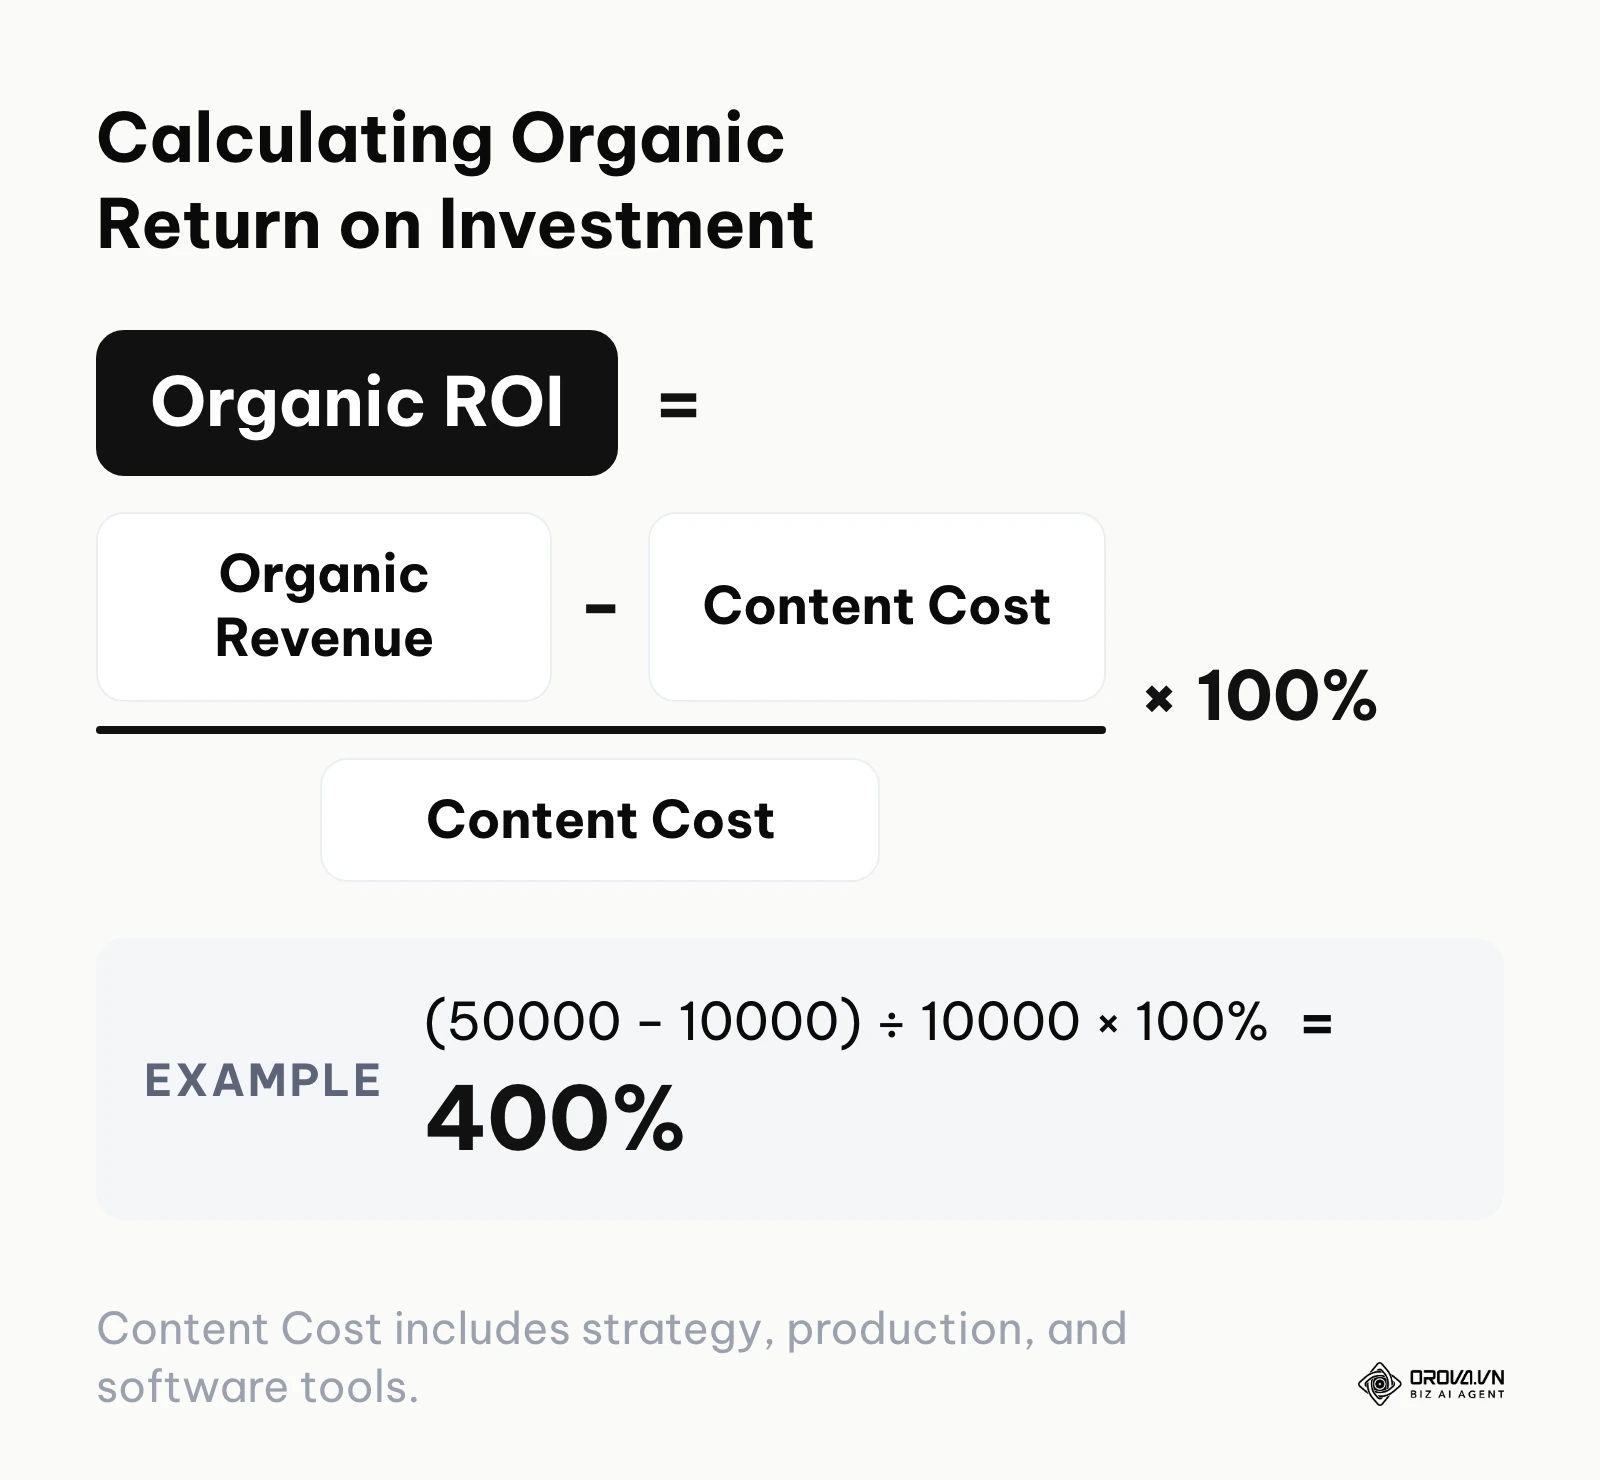
To accomplish this vital connection, you need to deeply integrate your tracking tools with your CRM or core e-commerce platform. You must assign a specific, agreed-upon monetary value to every single conversion event within your analytics platform. This applies whether the event is a direct product sale, a qualified lead form submission, or a targeted whitepaper download indicating high intent.
The standard formula is Organic ROI = (Organic Revenue − Content Cost) ÷ Content Cost × 100%, where Content Cost includes strategy, production, and software tools. For example, if organic landing pages generated 50,000 in attributed revenue in a quarter and content cost 10,000 in the same quarter (same currency), ROI = (50,000 − 10,000) ÷ 10,000 × 100% = 400%.
To find where that return comes from, segment your organic traffic strictly by landing page performance. Identify clearly which pages rank consistently in the top three positions and rigorously analyze the conversion rate of the traffic they specifically generate. If a high-ranking page exhibits a consistently high bounce rate alongside a dismal conversion rate, you have a severe intent mismatch. The search engine algorithm thinks your page answers the query based on text, but the human user disagrees upon arrival. Your tracking system must highlight these specific discrepancies automatically so you can rewrite the content to align strictly with commercial intent, rather than just blindly celebrating the high rank in a vacuum.
Discover Orova.vn – a Biz AI Agent platform with OROVA SEO, a complete solution for every website. The system supports search engine optimization from A to Z with features including keyword research, writing new SEO-ready articles, optimizing existing content, rank tracking, plus competitor analysis and in-depth technical analysis. Sign up today to experience OROVA SEO completely free (offer valid through July 7, 2027).
Deep analysis: Handling sudden ranking drops
A sudden, unexpected drop in rankings is easily the most stressful event in search engine rank monitoring. Executive panic often leads to hasty, highly destructive changes to the website. You need a cold, systematic diagnostic process to accurately identify the root cause before ever touching your website's code or content.
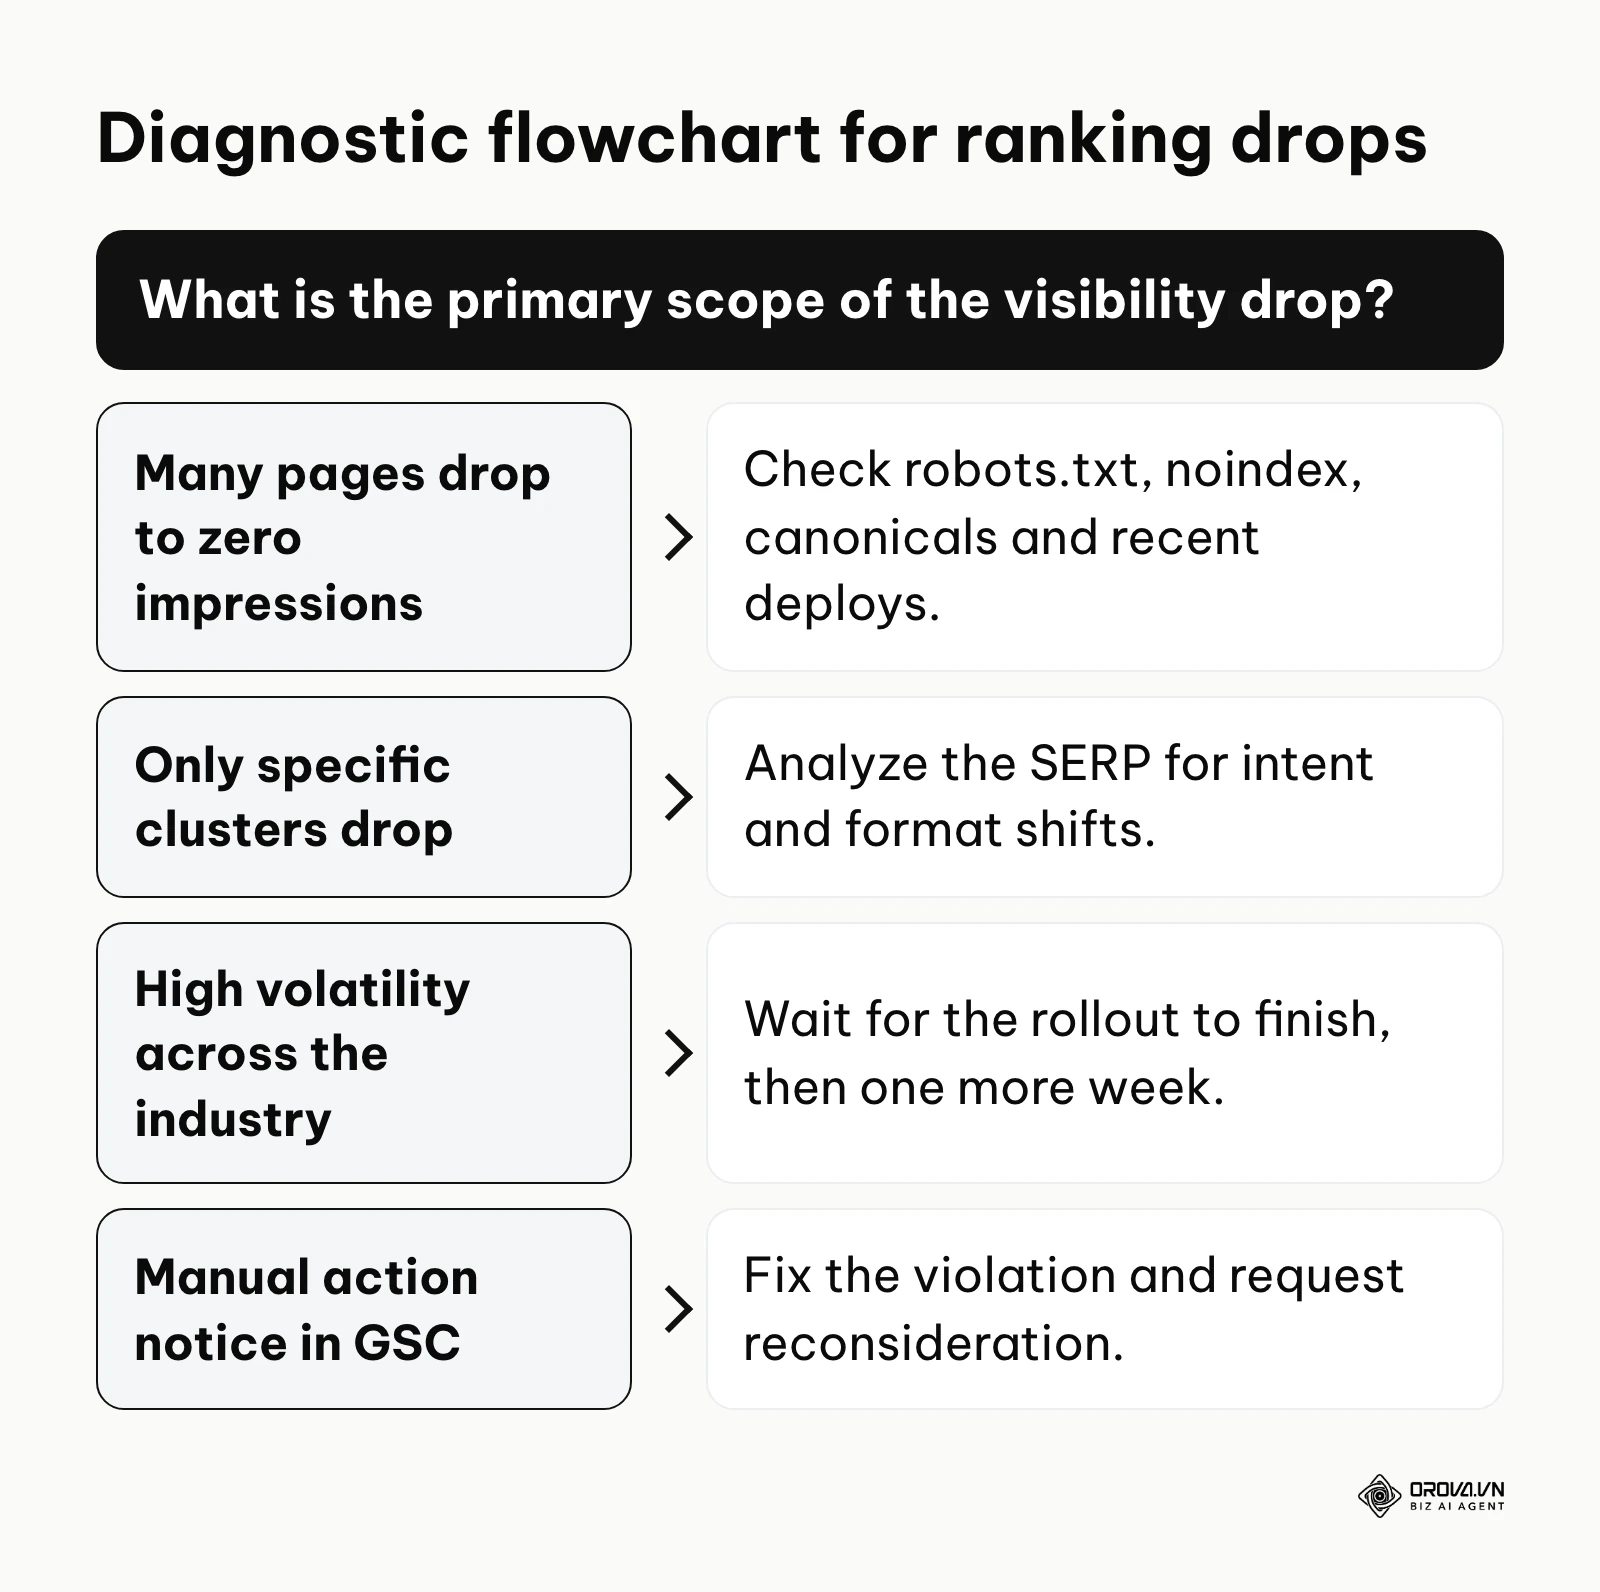
When you receive a critical alert that a major revenue-driving page has dropped significantly, you must methodically determine if the issue is a simple technical error, a broad content quality problem, a manual penalty, or a massive algorithmic shift beyond your control.
| Root Cause Category | Diagnostic Indicators | Initial Response Strategy |
|---|---|---|
| Technical Architecture | Sudden drop to exactly zero impressions across multiple pages simultaneously; GSC coverage errors spike; recent robots.txt or canonical changes detected. | Check server logs immediately; revert recent code deployments; run a technical crawl and a Search Console audit to find accidental noindex tags, canonical errors or blocking directives. |
| Broad Algorithm Update | Rankings fluctuate wildly across the entire domain; industry weather tools report high SERP volatility; major competitors also see massive, unexplained shifts. | Do nothing immediately. Wait until Google confirms the rollout is complete, then allow at least one more full week before analysing results or making structural content changes. |
| Content Intent Shift | Only specific, localized clusters drop in rank; competitors who gained rank have a completely different content format (e.g., highly visual video guides instead of text walls). | Analyze the new top-ranking pages carefully. Restructure your existing content comprehensively to match the new format that Google clearly prefers for that specific intent. |
| Manual Action (Penalty) | A specific, ominous notification appears in the "Security & Manual Actions" section of your Google Search Console property. | Identify the violating tactic (e.g., unnatural spam links); meticulously document all removal efforts; submit a comprehensive, polite reconsideration request to Google. |
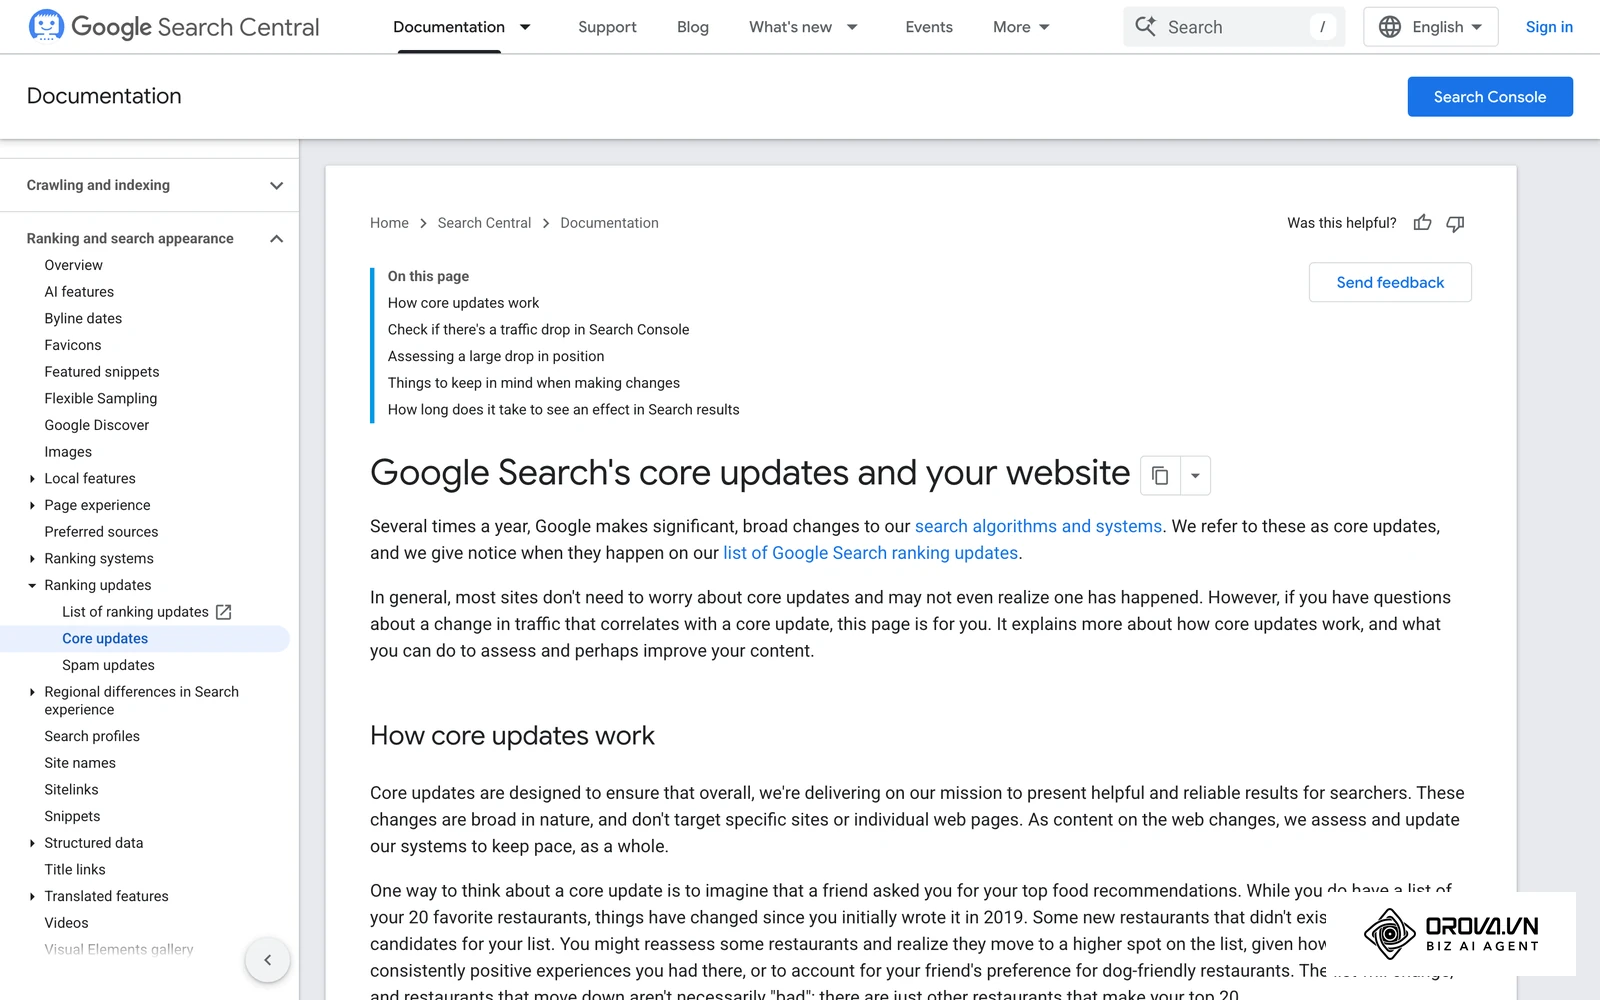
The most common and devastating mistake made during an algorithm update is attempting to frantically "fix" pages while the search engine is still actively recalibrating its massive index. This is conceptually like trying to paint a house during a category five hurricane. Google's own guidance on core updates recommends waiting until an update has finished rolling out, and then at least one more full week, before analysing what changed. Your rank monitoring system should simply log the changes quietly during this turbulent period.
Once the SERP volatility finally subsides, utilize your cleanly clustered data to identify macro patterns. Did purely informational pages drop while commercial product pages remained stable? Did short-form news content suffer while comprehensive, long-form guides thrived? This critical pattern recognition is entirely impossible if you failed to complete the fundamental preparation steps outlined earlier in this guide.
Illustrative example:
- Context: An e-commerce director woke up to see a terrifying forty percent drop in organic traffic overnight across their entire product catalog. The legacy rank tracker showed massive, uniform declines across thousands of essential keywords.
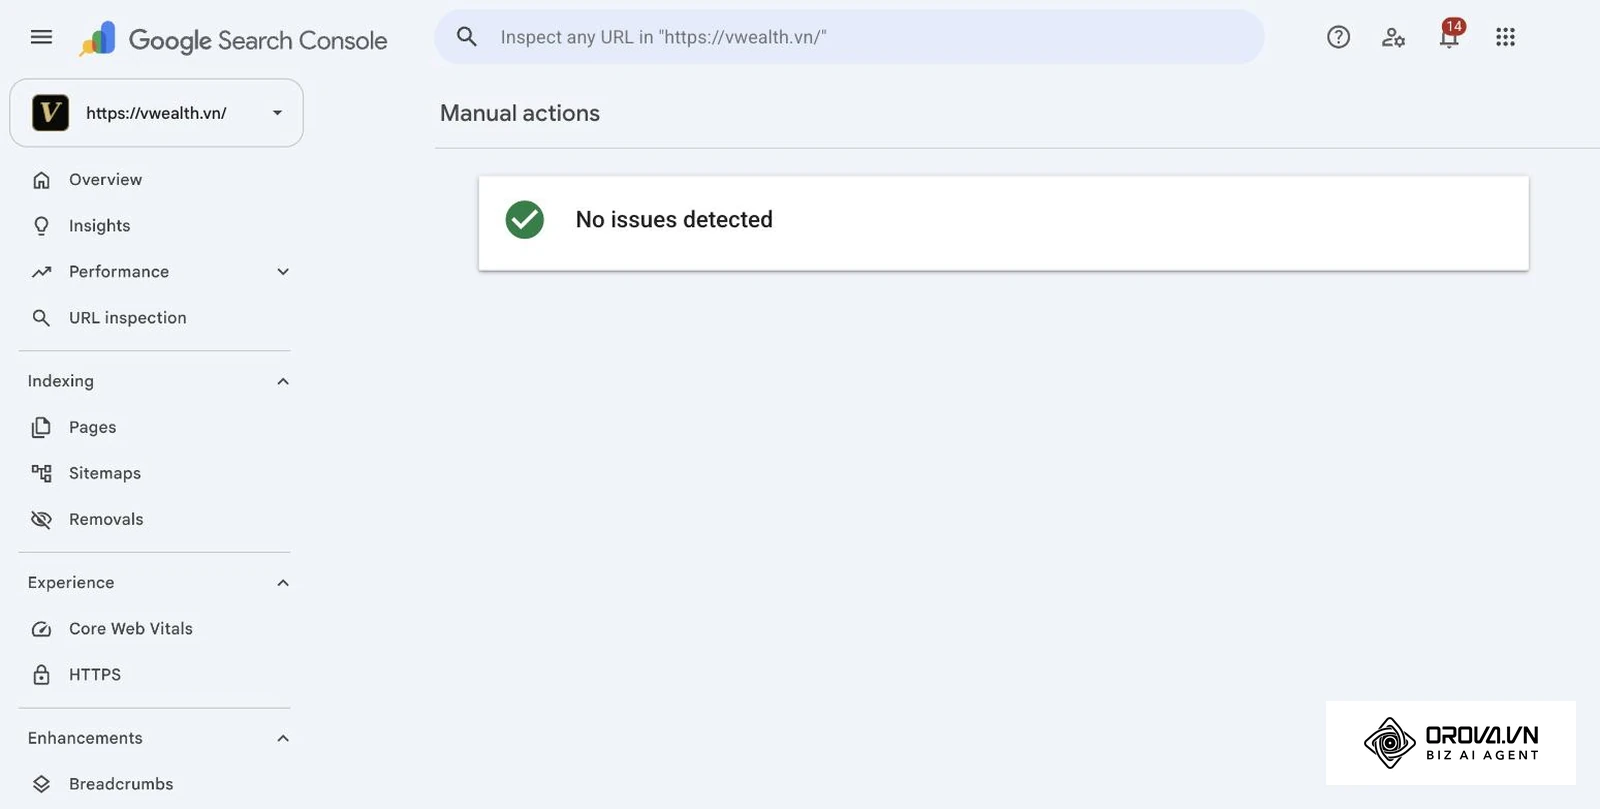
- Steps taken: They immediately checked GSC for manual actions (none were found). They checked industry weather tools and noted absolutely no major algorithm updates were reported by the community. They then isolated the traffic drop strictly to specific new URL structures.
- Obstacle and fix: The marketing team almost rewrote their product descriptions entirely, wrongly assuming a massive quality issue. However, by running a strict technical review and a Google Search Console SEO audit, they discovered a junior developer had accidentally pushed a global "noindex" tag to the main header template during a late-night server maintenance window. They immediately removed the rogue tag and submitted the primary sitemap for rapid recrawling.
- Result: Rankings and organic traffic gradually returned to their previous baseline as the pages were recrawled, completely avoiding the catastrophic disaster of rewriting hundreds of perfectly good, high-converting product pages based on faulty assumptions.
Measuring ranking success in the AI era
Defining success in search engine rank monitoring is no longer as simple as holding position one for a vanity term. Success is now defined by actual visibility, deep user engagement, and measurable conversion within a highly complex, fragmented digital ecosystem. You must fundamentally adapt your reporting metrics to accurately reflect this new reality.
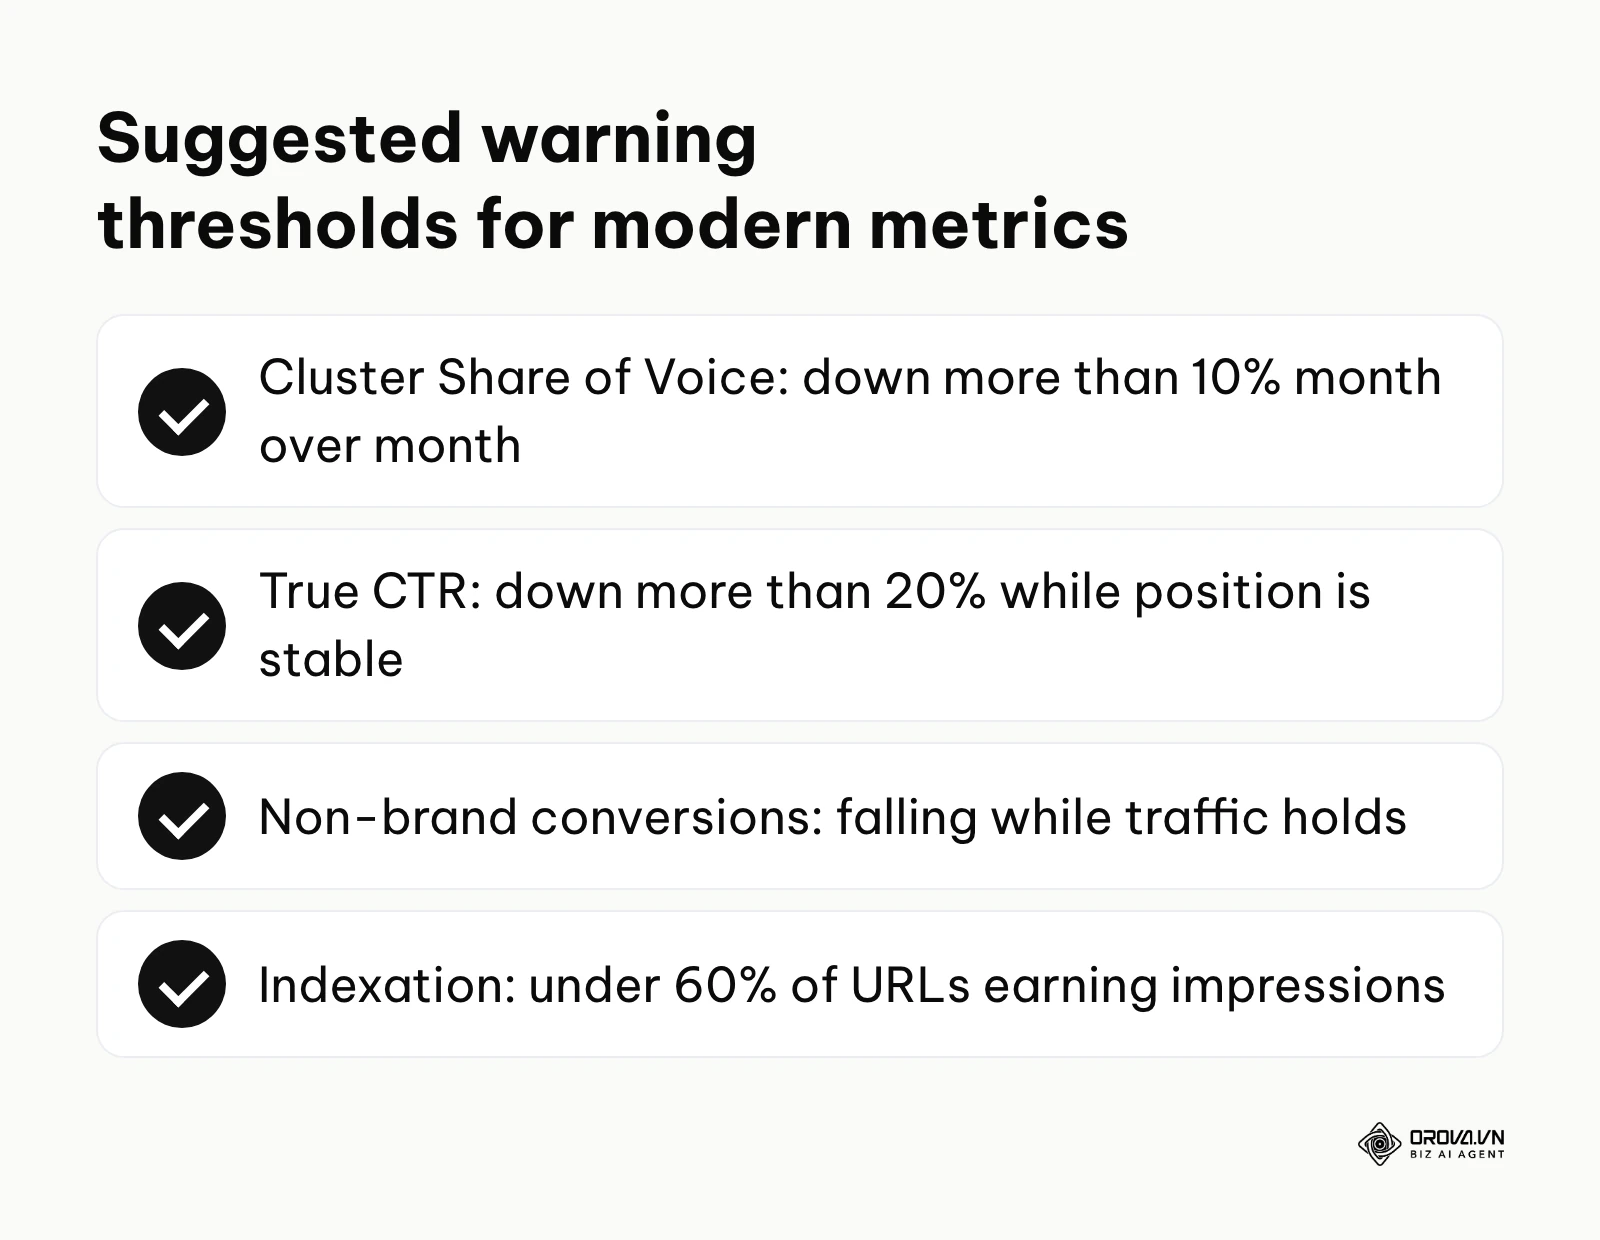
Traditional tracking metrics like raw global search volume and isolated integer positions are becoming increasingly detached from actual human behavior. A targeted keyword with massive search volume might have an extremely low click-through rate if an intelligent AI Overview perfectly answers the user's complex question directly on the page, without ever requiring them to visit a third-party website.
| Modern Metric | Meaning and Significance | Suggested Warning Threshold (adjust to your site) |
|---|---|---|
| Cluster Share of Voice | The percentage of total potential visibility your brand owns across a specific, defined topic group. | A sustained month-over-month drop of more than ten percent requires an immediate, deep investigation into competitor movements. |
| True Click-Through Rate | The ratio of actual clicks to impressions, specifically analyzed against the average position to detect SERP feature intrusion. | CTR dropping by more than twenty percent while the average position remains stable clearly indicates severely lost pixel visibility. |
| Non-Brand Organic Conversions | The number of business leads or sales generated directly by organic traffic from queries that do not contain your company name. | A downward trend in these conversions despite stable or rising overall traffic indicates a severe intent mismatch or a poor mobile user experience. |
| Indexation Efficiency | The percentage of your published, live URLs that actually receive regular, consistent impressions in search results. | As a rule of thumb, if less than sixty percent of your pages generate impressions, you may be suffering from content bloat and wasting critical crawl budget. |
You must track these modern metrics collectively to get a true picture. If your overall Share of Voice is rising nicely, but your True Click-Through Rate is falling rapidly, it means your content is technically ranking, but the search engine interface itself is capturing all the value. You need to pivot your strategy quickly to capture zero-click value, perhaps by ensuring your brand name is highly prominent in the snippet so you gain valuable brand awareness even if you do completely lose the click. Monitoring tells you where you stand; if you need a plan for actually improving positions, the 30-day website ranking roadmap covers that side.
With OROVA.VN and the OROVA SEO module, you put an end to the exhausting days of manual work for good. Instead of struggling for hours to write articles and compile reports, the entire process is now optimized and completed in just 5 minutes.
Common mistakes in search engine rank monitoring
Even highly experienced digital teams fall into dangerous traps when setting up their monitoring systems. Recognizing these common pitfalls early is absolutely crucial for maintaining accurate, actionable data and making sound strategic decisions rather than reactive mistakes.
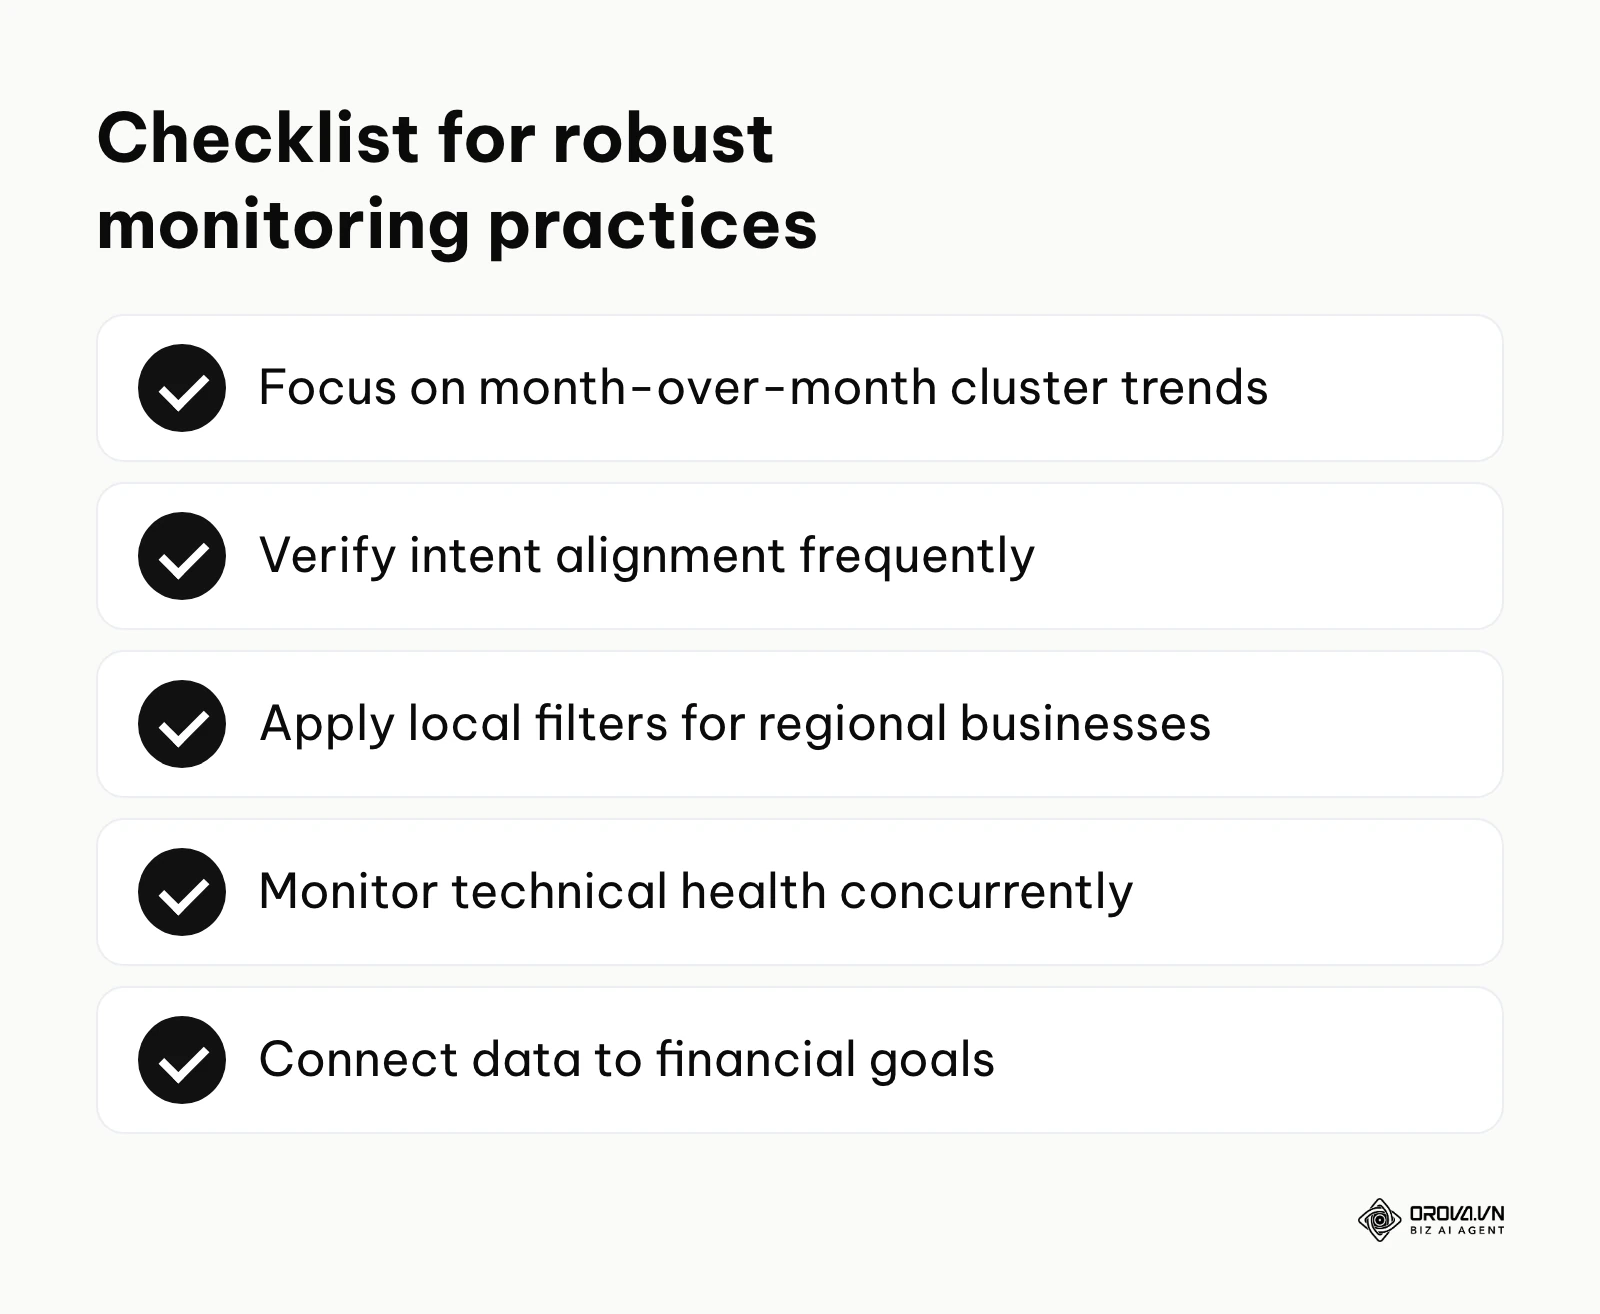
- Chasing daily fluctuations.
Search results are inherently volatile by design. Tracking minor daily changes and panicking over a drop from position two to position four leads to severe burnout and reactive, poor decision-making. You should analyze trends rigorously over weeks and months, not days. Fix this toxic habit by setting your primary reporting dashboards to compare month-over-month or quarter-over-quarter data by default, hiding the daily noise.
- Ignoring search intent shifts.
Google constantly refines its understanding of what human users actually want. If a keyword subtly shifts from an informational intent (users wanting a long guide) to a commercial intent (users wanting a product page), your long-form blog post will drop in rank, no matter how beautifully written it is. Fix this by manually reviewing the live SERP for dropping keywords and analyzing the types of pages now ranking. If the core intent has changed, you must create a totally new page to match it or significantly overhaul the existing one, requiring a deep review of your on-page SEO fundamentals.
- Tracking global volume for local businesses.
If you operate a regional service business in Chicago, looking at national or global search volume and rankings is highly misleading and pointless. You might rank poorly nationally but completely dominate your local area. Fix this error by ensuring your tracking tools are strictly configured to the exact city or region where your paying target customers actually reside.
- Failing to monitor technical health concurrently.
Rankings do not exist in a vacuum safely away from your servers. If your server response time degrades slowly over months or your mobile layout breaks after an update, your rankings will eventually suffer severely. Monitoring positions without simultaneously monitoring the underlying technical foundation is a severe oversight. Fix this by integrating core web vitals and crawl error alerts directly into your primary ranking dashboard.
- Relying solely on vanity keywords.
Executive management often fixates heavily on one or two highly competitive, industry "head terms." Focusing all monitoring efforts on these vanity metrics ignores the thousands of long-tail keywords that actually drive the vast majority of actual revenue. Fix this by deliberately structuring your reports to highlight cluster performance first and tying organic traffic directly to conversion goals, forcing the conversation away from single terms.
Future trends in search engine rank monitoring: author's perspective
The landscape of search is evolving faster now than at any point in the last decade. Based on current technological trajectories and shifting user behaviors, here is how I see the discipline changing over the next few years.
The shift from URL tracking to entity and brand tracking
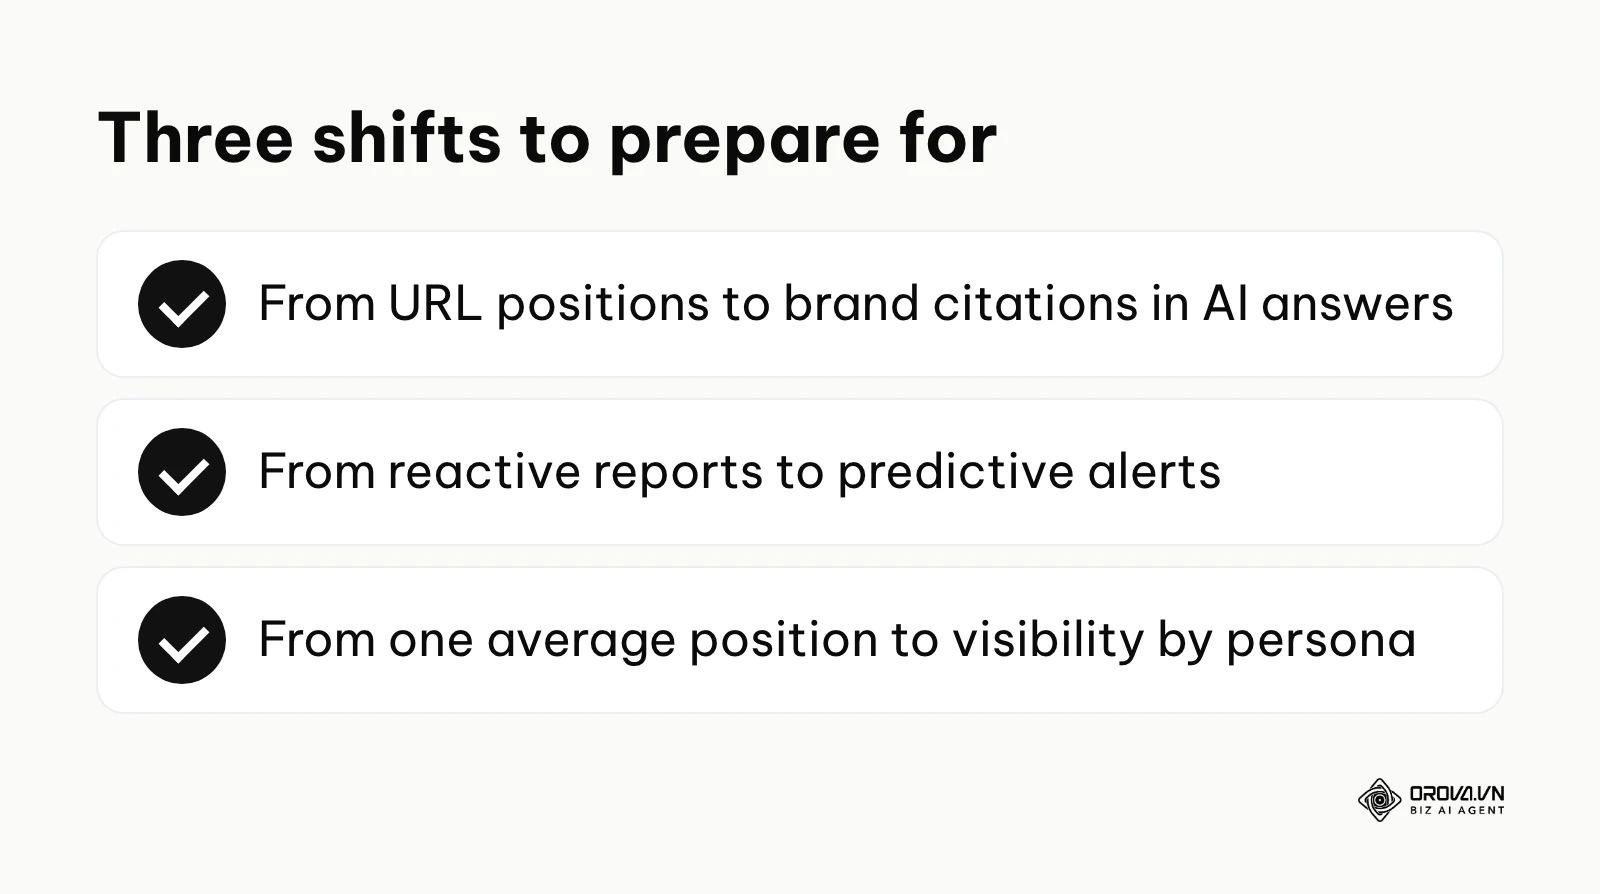
We are already seeing search engines synthesize complex information from multiple sources to create comprehensive answers directly in the SERP. I believe that, over time, tracking specific URLs will matter less than tracking how often your core brand or your proprietary data is cited by AI engines as a trusted source of truth. As AI Overviews become the primary interface for users, the goal will shift from driving raw clicks to a specific landing page to ensuring your brand is the recognized authority fueling the AI's internal response. You should start preparing for this paradigm shift now by investing heavily in digital PR and ensuring your content is highly structured and easily parseable by machine learning models.
Predictive monitoring utilizing advanced AI modeling
Currently, rank monitoring is largely a reactive discipline; we analyze what happened yesterday and try to guess why. I think AI is likely to push it toward a more predictive discipline. By analyzing large datasets of historical volatility and competitor content updates, monitoring tools may start flagging pages at risk of dropping before the drop shows up, and suggesting pre-emptive content updates to your team. You should prepare for this by moving your data out of isolated, proprietary silos and into centralized data warehouses where machine learning models can analyze correlations across your entire digital presence seamlessly.
The rise of hyper-personalized performance metrics
As search becomes almost entirely individualized based on vast user history, precise device context, and granular location data, the concept of a singular "national average position" may become less useful. I am leaning toward a future where monitoring tools will simulate thousands of distinct user personas to provide a probabilistic distribution of your visibility, rather than a single integer. You will not report that you are "position three," but rather give a probability of appearing above the fold for users in a specific phase, such as consideration. To prepare, you need to deeply understand your specific buyer personas and their unique search journeys, focusing on highly targeted content rather than broad, generic articles. Note that rapid, unforeseen shifts in global privacy regulations could severely alter how this personalization data is accessed, potentially proving this specific prediction wrong.
Frequently asked questions about search engine rank monitoring
How often should I practically check my keyword rankings?
You should review high-level cluster performance and any triggered automated alerts weekly, but deep, comprehensive analysis should only be done monthly. Checking daily leads to reactionary decisions based on completely normal algorithmic fluctuations. Set up robust automated systems to notify you of catastrophic drops immediately, freeing your time for strategic work rather than endless data entry.
Why does my tracking tool show a different rank than what I see on Google?
This frustrating discrepancy is almost always due to personalization, geographic location, or device differences. When you search manually, Google uses your browsing history, IP address, and logged-in Google account to heavily tailor the results. Your tracking tool, however, queries the search engine from a neutral, clean state (often from a completely different data center), providing a more objective, unpersonalized baseline.
How will AI Overviews fundamentally affect my ranking reports?
AI Overviews introduce the concept of "zero-click searches," where the user gets the complex answer directly on the result page without navigating away. This means you could maintain a high numerical rank (e.g., position one directly below the AI), but see a massive, unexplained drop in organic traffic and Click-Through Rate. Your reports must evolve to include CTR trends and pixel visibility metrics, rather than just integer positions, to accurately reflect this new reality.
Is the average position metric in Google Search Console actually accurate?
Yes, but it requires highly careful interpretation. It is the strict mathematical average of the topmost result from your site for a given query over a specific time period. If you rank position one for fifty searches in New York and position twenty for fifty searches in London, your dashboard average is precisely 10.5. It is accurate data, but without applying essential filters for device and country, it can dangerously hide extreme variations in your actual localized visibility.
What is the core difference between rank tracking and SEO monitoring?
Rank tracking is a highly specific subset of the broader SEO monitoring process. Rank tracking focuses strictly on the numerical position of keywords on a page. SEO monitoring encompasses a much more holistic, comprehensive view of your organic health, including technical crawlability issues, backlink profile changes, organic conversion rates, and overall macro traffic trends.
Where to start?
The sheer volume of data available in modern tools can be paralyzing. Do not attempt to build a complex, fully automated dashboard on day one. Your ideal starting point depends entirely on your current state of operational readiness.
If you are completely overwhelmed by a massive, disorganized list of keywords and do not know what matters: Your first step is to spend one afternoon building a core topic cluster map. Open a blank spreadsheet, clearly identify the three most important products or services your business offers, and group your existing top-performing keywords under those three specific pillars. Ignore the rest of the noise for now. This single action instantly focuses your monitoring efforts exclusively on revenue-driving topics.
If you are tired of checking GSC manually every day but lack advanced technical coding skills: Your first step is to configure a single Looker Studio alert. Use the free Google Search Console connector to create a basic table showing your top ten highest-traffic pages. Turn on the previous-period comparison so you can see how each page moved, and add a conditional formatting rule that colours a row red when Average Position is worse than a threshold you choose (for example, above 10). Schedule this single, focused page to email you every Monday morning.
If you have basic tracking in place but struggle to prove the actual financial value of your efforts to management: Your first step is to bridge the gap between organic traffic and conversions in your web analytics platform. Spend a few hours configuring goals or events in Google Analytics 4 for your most critical actions (e.g., demo requests or purchases). Then, create a custom report that specifically filters for organic traffic and displays the conversion rate broken down by the exact landing page. This shifts your reporting from "we rank well" to "these rankings generated ten leads this week," which is the ultimate goal of effective search engine rank monitoring.
About the author

Builder of Orova
Nguyễn Đỗ Trọng Ân has 8 years of experience in marketing, including 6 years managing market development across Asia. He builds Orova, a Biz AI Agent that never sleeps: it plans, runs and optimizes work for businesses.
Run your business with AI Agents
Orova is the always-on Biz AI Agent — it plans, runs, and optimizes the work for you.
Save time, unlock productivity.