
What are view through conversions? Finding true ad value

You log into your advertising dashboard on Monday morning and see an incredible report. Your latest display campaigns have supposedly generated hundreds of sales over the weekend, many of them reported as view through conversions. You feel a rush of validation for your media strategy. However, when you cross-reference those numbers with your actual customer relationship management (CRM) software and bank deposits, you find that the total company revenue is only a fraction of what the ad platforms claim they drove.
This frustrating scenario is the reality for countless digital marketers, and the culprit is almost always a misunderstanding of how ad networks measure success. When platforms take credit for users who merely scrolled past an image without engaging, it artificially inflates performance metrics. If you misinterpret this data, you risk double-counting sales, allocating budget to the wrong channels, and ultimately hurting your bottom line. This guide will clarify exactly what view through conversions are, how to deduplicate the overlapping numbers, and how to uncover the true incremental value of your top-of-funnel ad spend.
What are view through conversions?
View through conversions are a specific attribution metric that records when a user sees your display or video ad, does not click on it, but later completes a desired action on your website within a predefined timeframe called a lookback window.
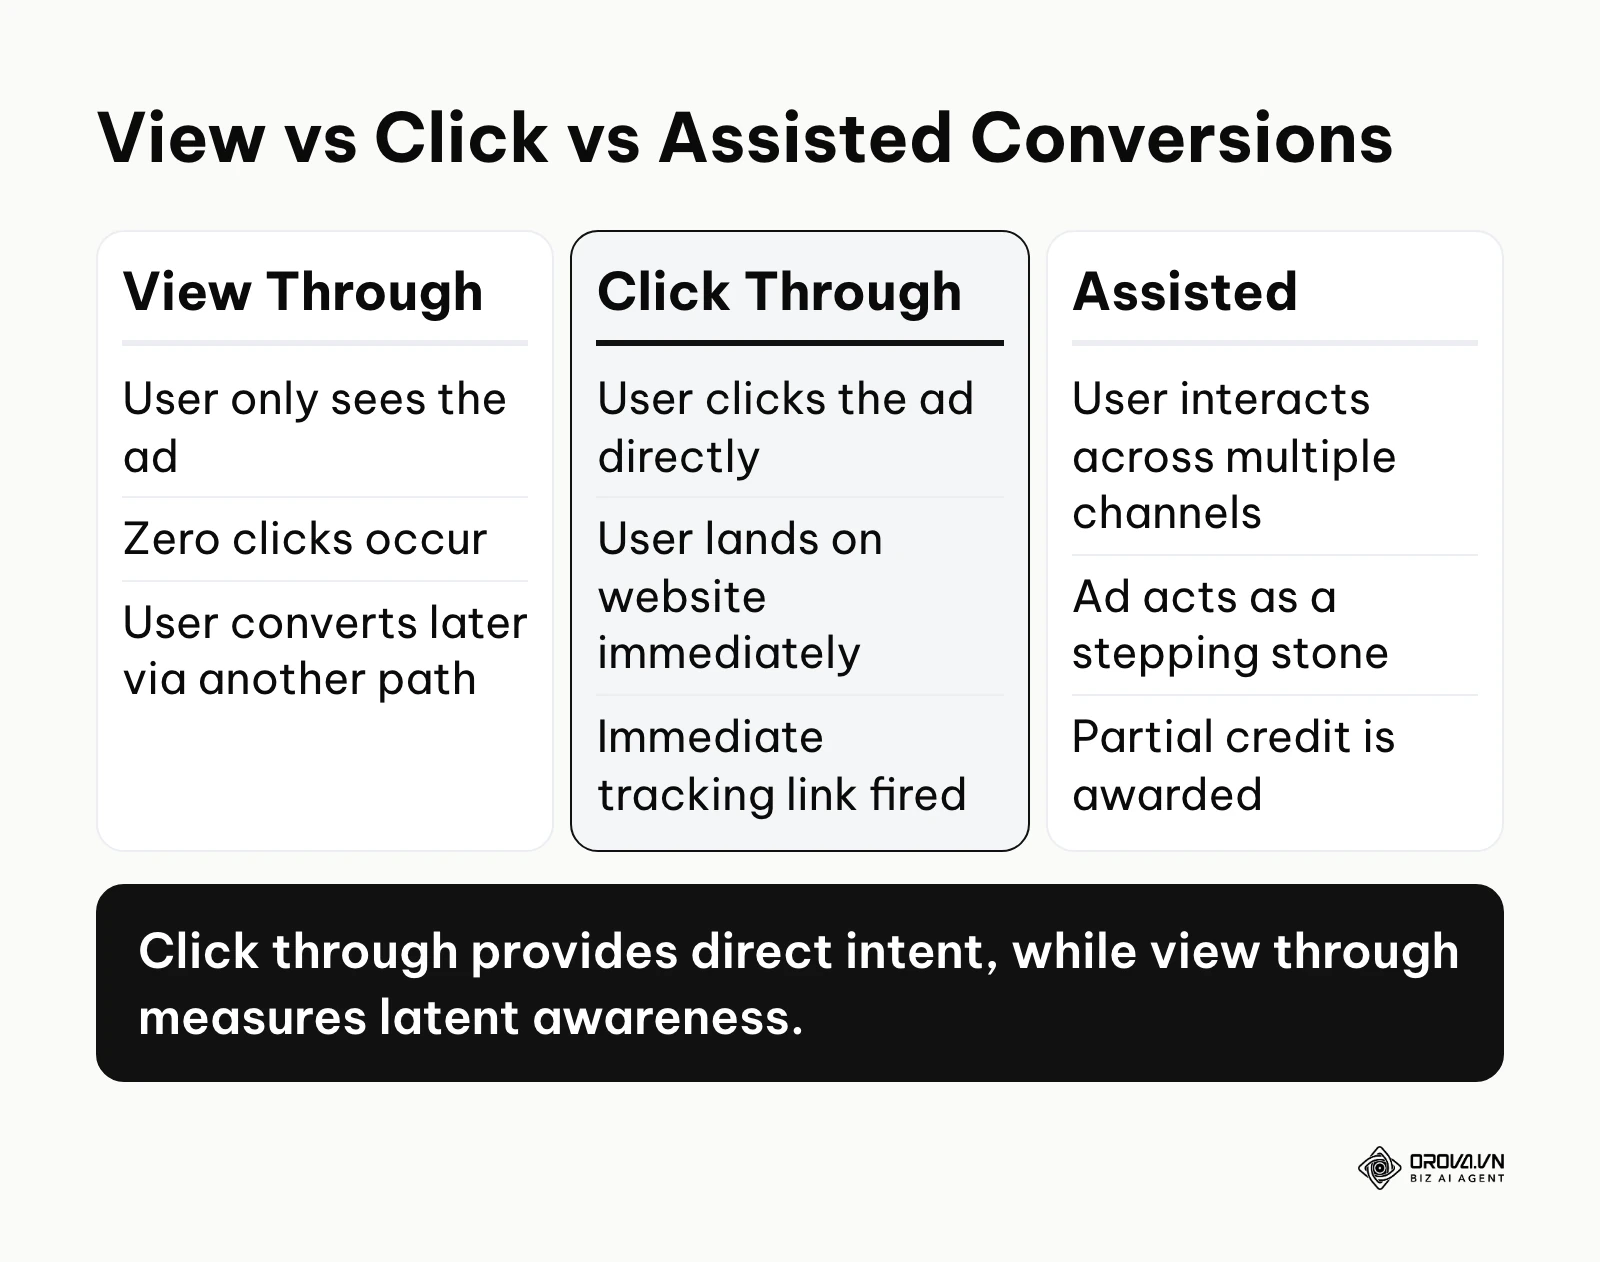
The concept originated in the late 1990s and early 2000s. As the novelty of the internet wore off, standard banner ad click-through rates fell far below their early highs. Advertisers threatened to pull their budgets because campaigns appeared completely ineffective based solely on clicks. In response, ad networks introduced impression-based tracking to prove that even if users did not click, merely seeing the brand logo influenced their future purchasing behavior.
To fully grasp this concept, you must distinguish it from other common measurement models used in digital marketing.
| Concept | How it differs | Example |
|---|---|---|
| View through conversion | The user only sees the advertisement but never clicks on it before eventually buying through another path. | Seeing a social media video ad, scrolling past it, and then buying via a Google Search the next day. |
| Click through conversion | The user actively clicks the advertisement and immediately enters the website session. | Clicking a Google Search ad and completing the checkout process within five minutes. |
| Assisted conversion | The user interacts with multiple different channels over time, and the ad gets partial credit as a stepping stone. | Clicking a display ad, leaving the site, and returning a week later via an email newsletter to purchase. |
For a real-world example, imagine you are reading a sports blog on your smartphone. A vibrant banner advertisement for a new pair of running shoes appears between the paragraphs. You notice the shoes, recognize the brand name, but you do not click the banner because you want to finish reading the article. Three days later, your old running shoes finally tear. You remember the brand from the banner, open your browser, type their name directly into the search bar, and make a purchase. The display ad network will claim this sale as a view through conversion, arguing that their banner planted the seed of awareness.
The role and meaning of view through conversions
View through conversions exist to solve a fundamental problem in marketing measurement: the invisibility of brand awareness. Not every advertisement is designed to elicit an immediate, impulsive click. Video advertisements, billboards, and high-impact display banners are primarily built to generate memory recall. If we only measured success by direct clicks, we would systematically undervalue these top-of-funnel channels and eventually defund them entirely.
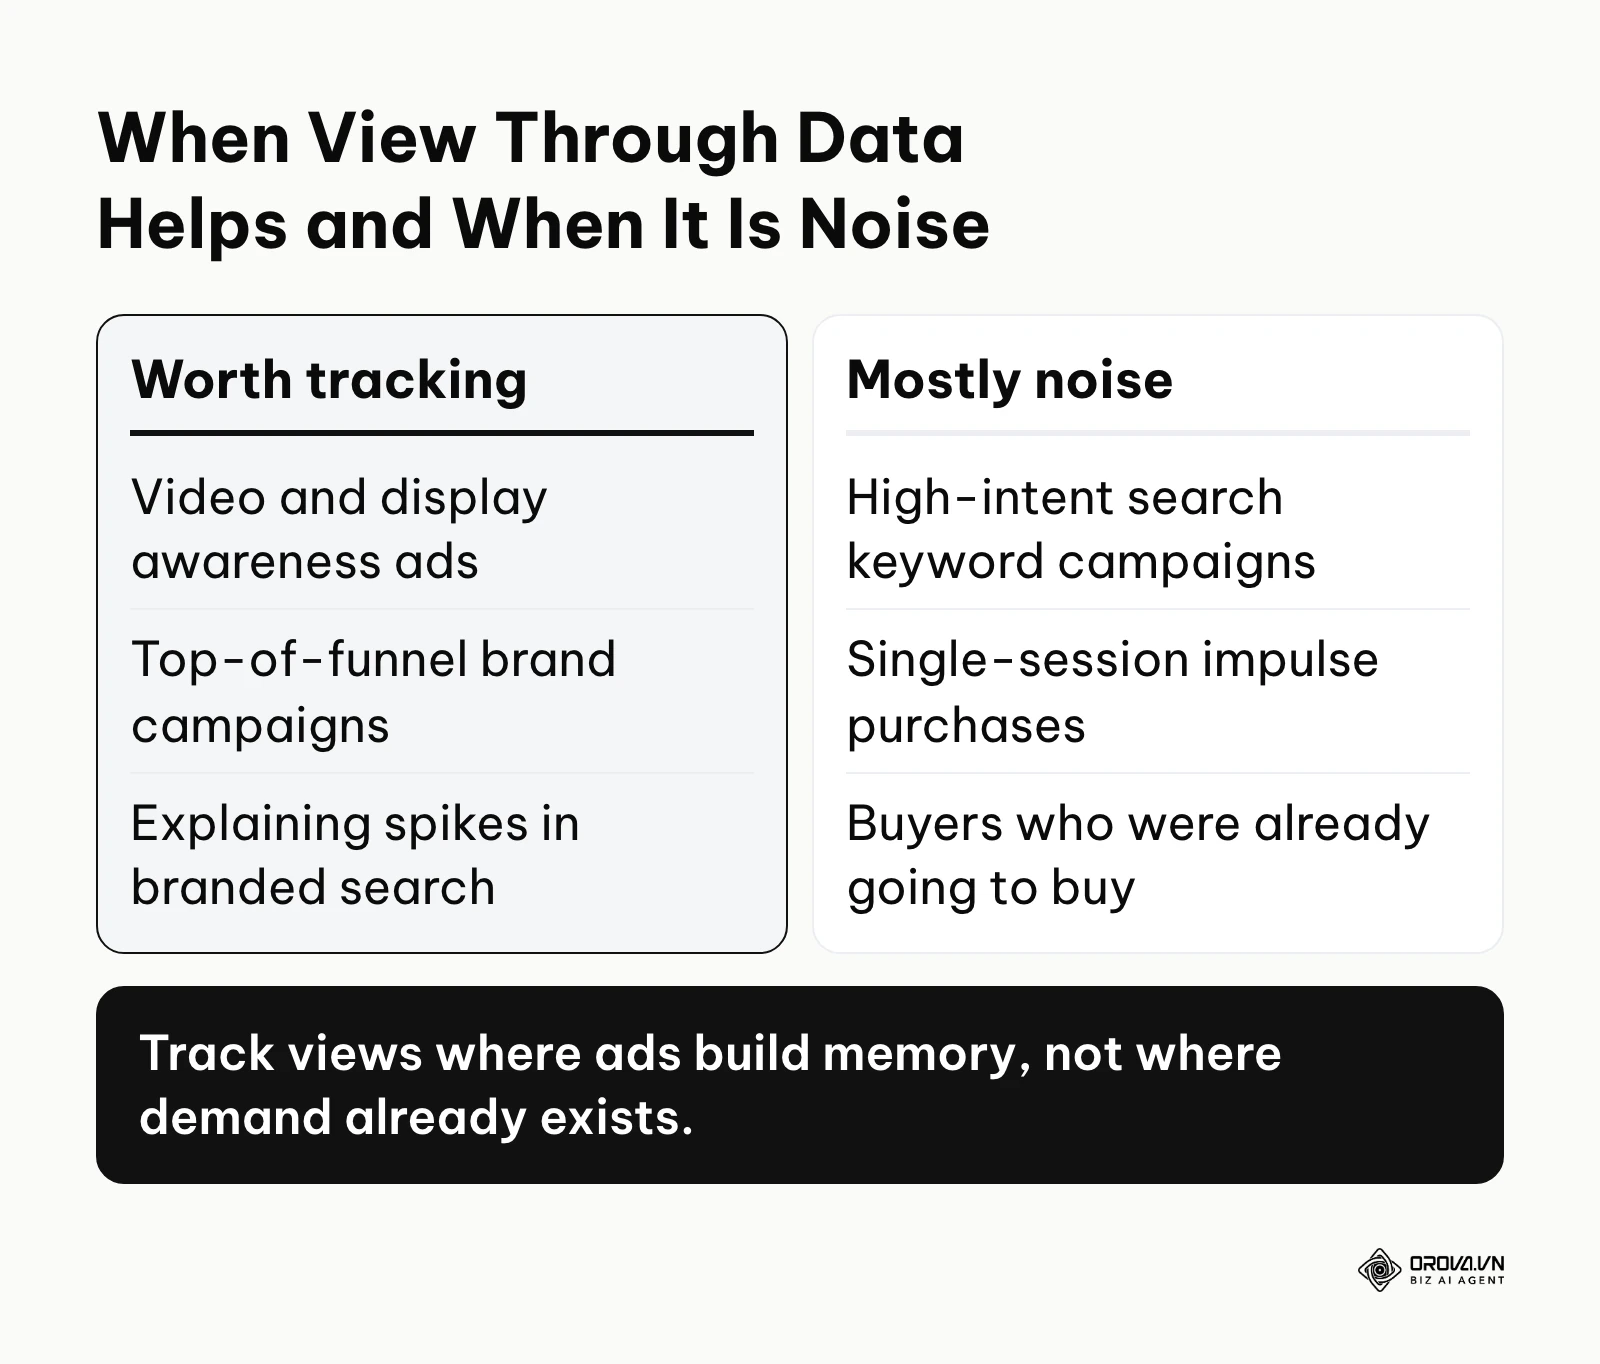
In the broader picture of the customer journey, view-through metrics sit squarely at the very beginning of the funnel. They represent the initial touchpoint. Click-through metrics usually sit at the bottom of the funnel, representing the final capture of demand. The impression creates the desire, and the search engine captures the resulting action. Therefore, view-through data provides the missing link that explains why your direct website traffic or branded search volume suddenly spikes during a major media push.
If you ignore these metrics completely, you lose critical visibility into how your brand is perceived in the wild. Marketers who only optimize for immediate clicks often find themselves stuck in a cycle of diminishing returns. They exhaust their existing audience and fail to fill the top of the funnel with new prospects, eventually causing their entire performance marketing ecosystem to stagnate.
However, recognizing the role of this metric also requires extreme caution, especially for ad retargeting campaigns that show ads to people who have already visited your site. The core challenge is differentiating true incrementality from mere coincidence. Did the user buy the product because they saw the ad, or did the ad platform simply serve a banner to someone who was already planning to buy anyway? This philosophical debate is the crux of modern attribution analysis.
When view through conversions are not needed: There are specific instances where tracking view through conversions offers zero value and introduces unnecessary noise. If your campaigns strictly target high-intent bottom-of-funnel keywords on search engines, view-through tracking is irrelevant because users are already actively seeking your exact product. Similarly, for highly transactional, low-ticket dropshipping impulse purchases where the entire customer journey happens within a single rapid session, analyzing a lengthy thirty-day view-through window is a complete waste of analytical resources. In these specific cases, you should rely entirely on immediate click-through attribution and direct return on ad spend.
The business and operational value of view through conversions
Understanding how to leverage this data provides distinct advantages that ripple across an entire organization. We can divide these advantages into two distinct layers: the strategic value for the business leadership and the tactical benefits for the daily practitioners executing the campaigns.
For business leadership, tracking these metrics accurately protects the company from catastrophic budget misallocations. It provides the necessary evidence to justify continued investment in brand awareness. Without this data, finance departments often view top-of-funnel advertising as an unmeasurable expense rather than a revenue driver. Furthermore, it helps leadership map out the true length of the customer journey, allowing them to accurately forecast cash flow and understand exactly how long it takes a prospect to turn into paying revenue.
For the daily practitioner, such as a media buyer or data analyst, this data is the ultimate tool for creative optimization. It allows them to evaluate the effectiveness of visual assets based on memory retention rather than just immediate clickability. It also empowers practitioners to defend their media plans during performance reviews by demonstrating how their display campaigns are secretly feeding the success of the search campaigns.
Validating top-of-funnel budget (Business Value)
When finance demands a strict return on ad spend, brand campaigns are usually the first to be cut. By accurately measuring the latent impact of impressions, businesses can prove that these campaigns are actually driving future sales, thereby securing the budget needed for long-term growth.
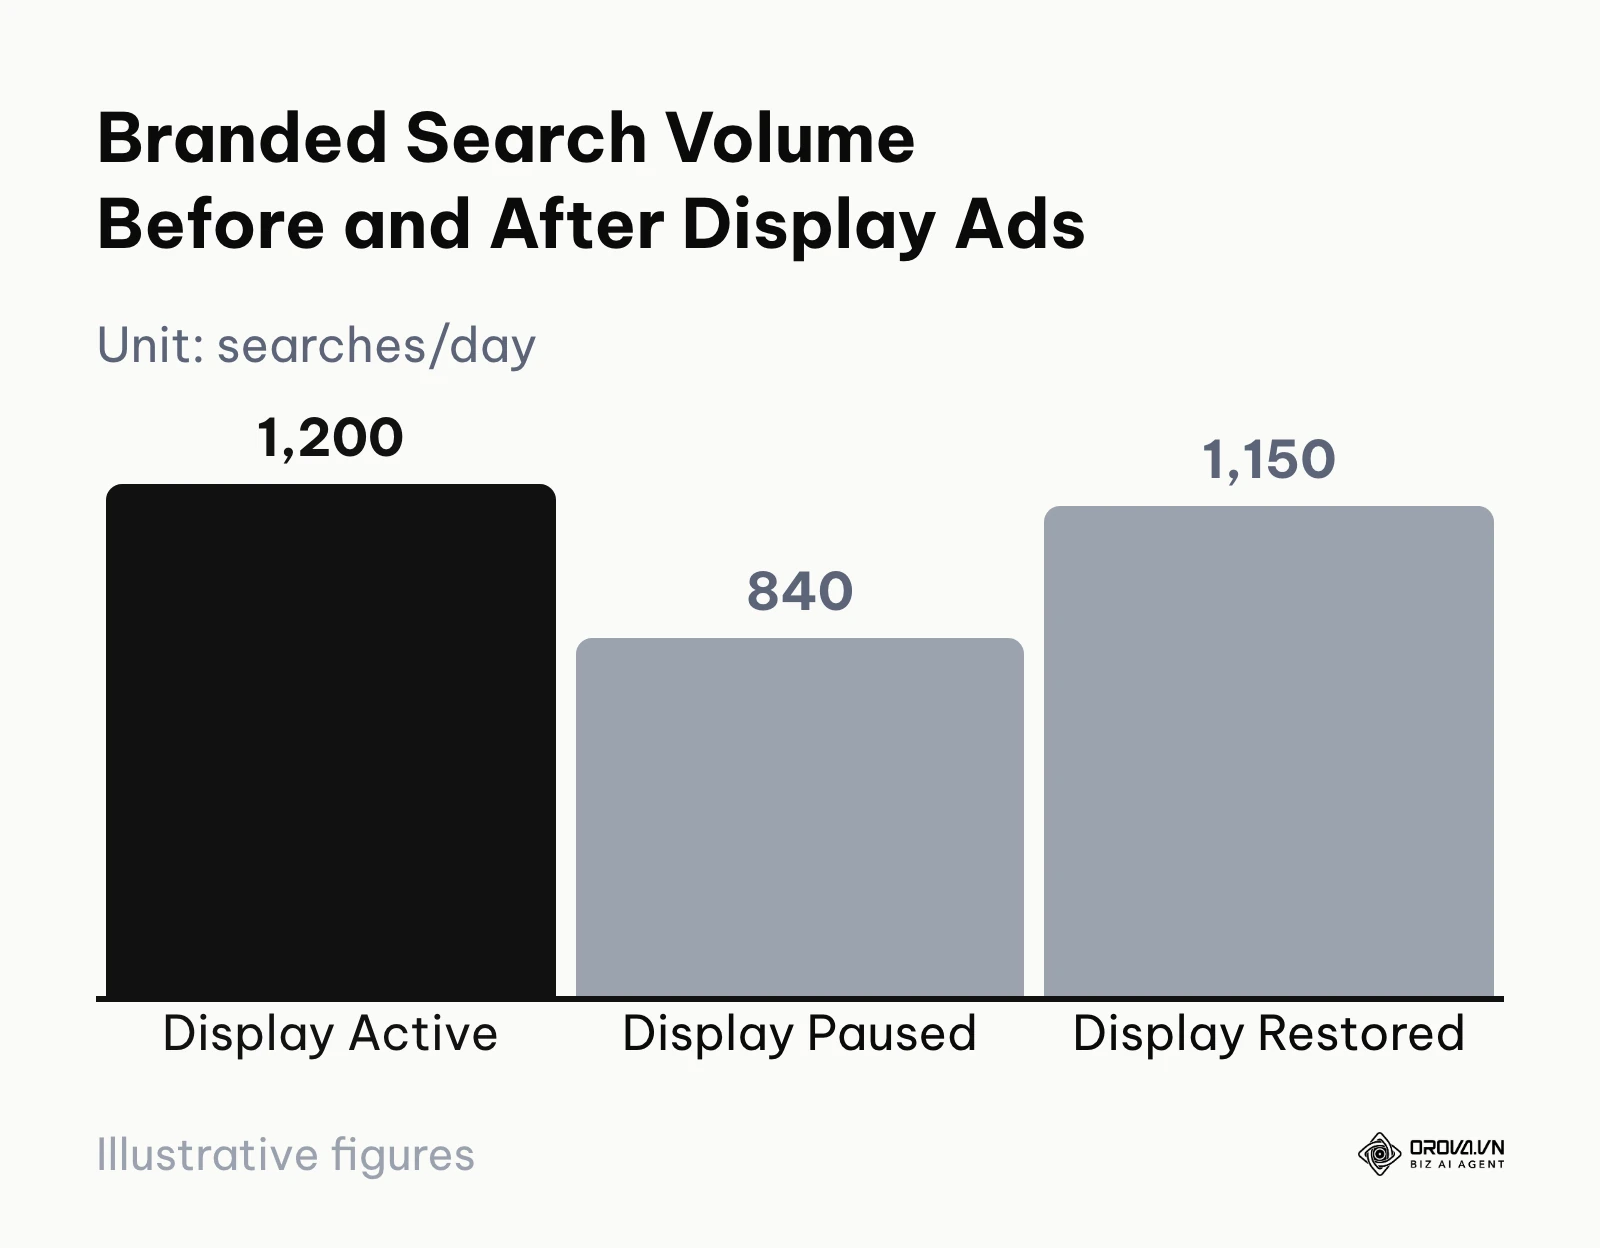
Illustrative example: A mid-sized business software company debated cutting their five-figure monthly display budget due to an abysmal 0.05% click-through rate. The performance team paused the display campaigns entirely for one month. Within two weeks, they noticed their bottom-of-funnel search volume dropped by nearly thirty percent, and direct website traffic plummeted. They realized the display ads were driving massive subconscious awareness. By reinstating the budget and implementing a balanced view-through window, they saw branded search volume recover to its baseline, proving the latent value of the impressions to the finance team.
Mapping the true customer journey (Business Value)
Businesses often mistakenly believe their sales cycle is instantaneous if they only look at last-click data. Understanding the delay between the first impression and the final purchase allows companies to refine their email nurturing sequences and inventory forecasting.
Defending media buying strategies (Practitioner Benefit)
Practitioners are frequently blamed when a specific platform appears to underperform. By showcasing how impressions from one platform assist conversions on another, media buyers can defend a holistic, multi-channel strategy rather than being forced to put all the budget into a single search network.
Optimizing visual creatives for memory retention (Practitioner Benefit)
If an ad is designed for brand recall, optimizing it for a high click-through rate might ruin the message. Practitioners can use view-based data to test which colors, logos, or taglines create the strongest lasting memory that eventually leads to a delayed sale.
| Benefit | Primary Metric Used | Time to See Results |
|---|---|---|
| Justifying brand budget | Assisted conversion value | 1 to 3 months |
| Mapping customer journeys | Time lag report (days to convert) | 2 to 4 weeks |
| Defending media strategy | Cross-channel deduplication percentage | 1 to 2 weeks |
| Creative optimization | View through conversion rate | 3 to 7 days |
OROVA ADS applies AI Agent to automate and optimize ad performance on Google, Meta and TikTok. Scale your budget safely, monitor 24/7 and expand your business quickly.
Experience the solution at orova.vn/ads
How view through conversions work and how to track them
To master this metric, you must understand the underlying technical anatomy of how an ad platform actually connects a passive view on a mobile app to a credit card transaction on a desktop computer three weeks later. This is a complex chain of data collection, probabilistic matching, and algorithmic attribution.
The impression tracking and ID matching process
The process begins the millisecond an advertisement renders on a user's screen. Under the widely used Media Rating Council (MRC) and IAB viewability guidelines, a display ad counts as viewable when at least fifty percent of its pixels are on screen for one continuous second, and a video ad when at least fifty percent is on screen for two continuous seconds. Note that each ad platform decides for itself which impressions are eligible for view-through credit.
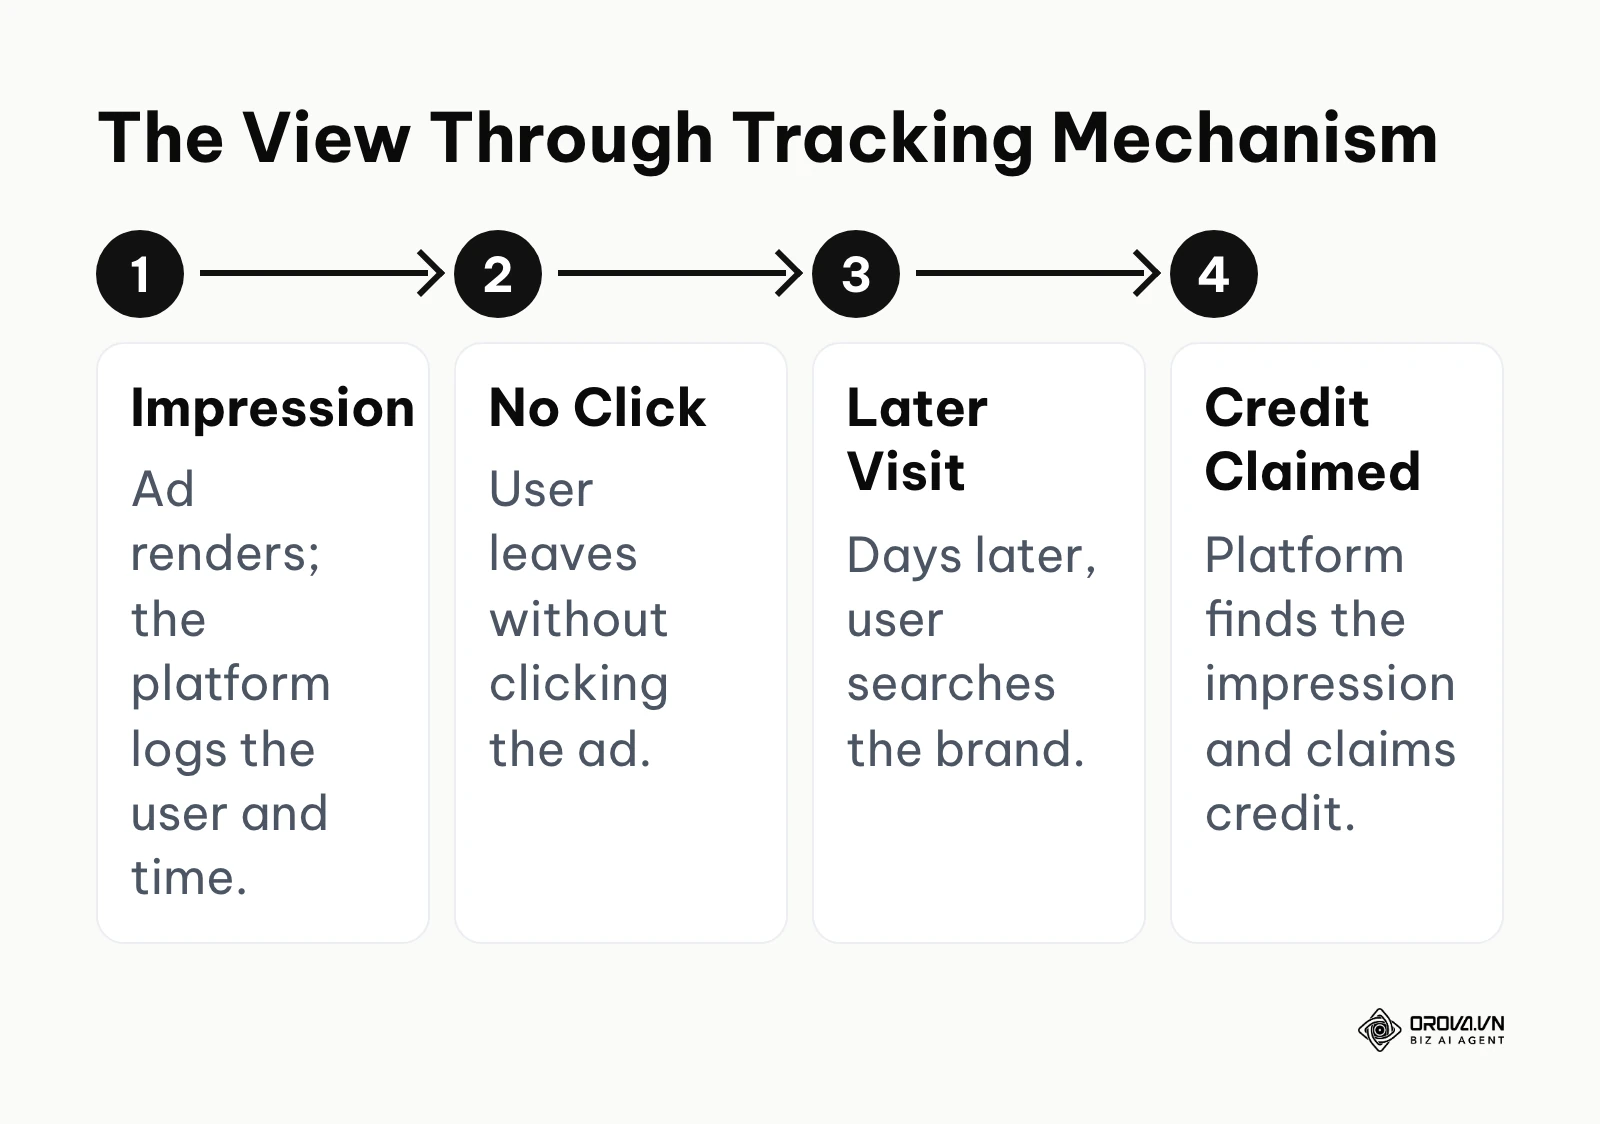
When this occurs, the ad server fires a tracking pixel or utilizes a software development kit (SDK) to log the event. The inputs for this process include the user's IP address, device type, operating system version, browser user agent, and time of day. If the user is actively logged into a platform (like being logged into an email account on their browser), the system uses deterministic matching, which is highly accurate because it relies on a known user ID. If the user is anonymous, the system relies on probabilistic matching, analyzing the inputs to create a statistical guess of the user's identity.
The output is a timestamped log file stored securely on the ad network's servers. The major breaking point in this process occurs due to modern privacy features. Ad blockers, Apple's Intelligent Tracking Prevention (ITP) in Safari, and iOS tracking transparency prompts routinely block the transmission of these inputs, causing significant data loss and forcing platforms to rely on broader statistical modeling.
Setting the lookback window
Once the impression is logged, it sits dormant until a conversion event occurs. When a user eventually lands on your website and completes a purchase, your website's tracking pixel sends a signal back to the ad network.
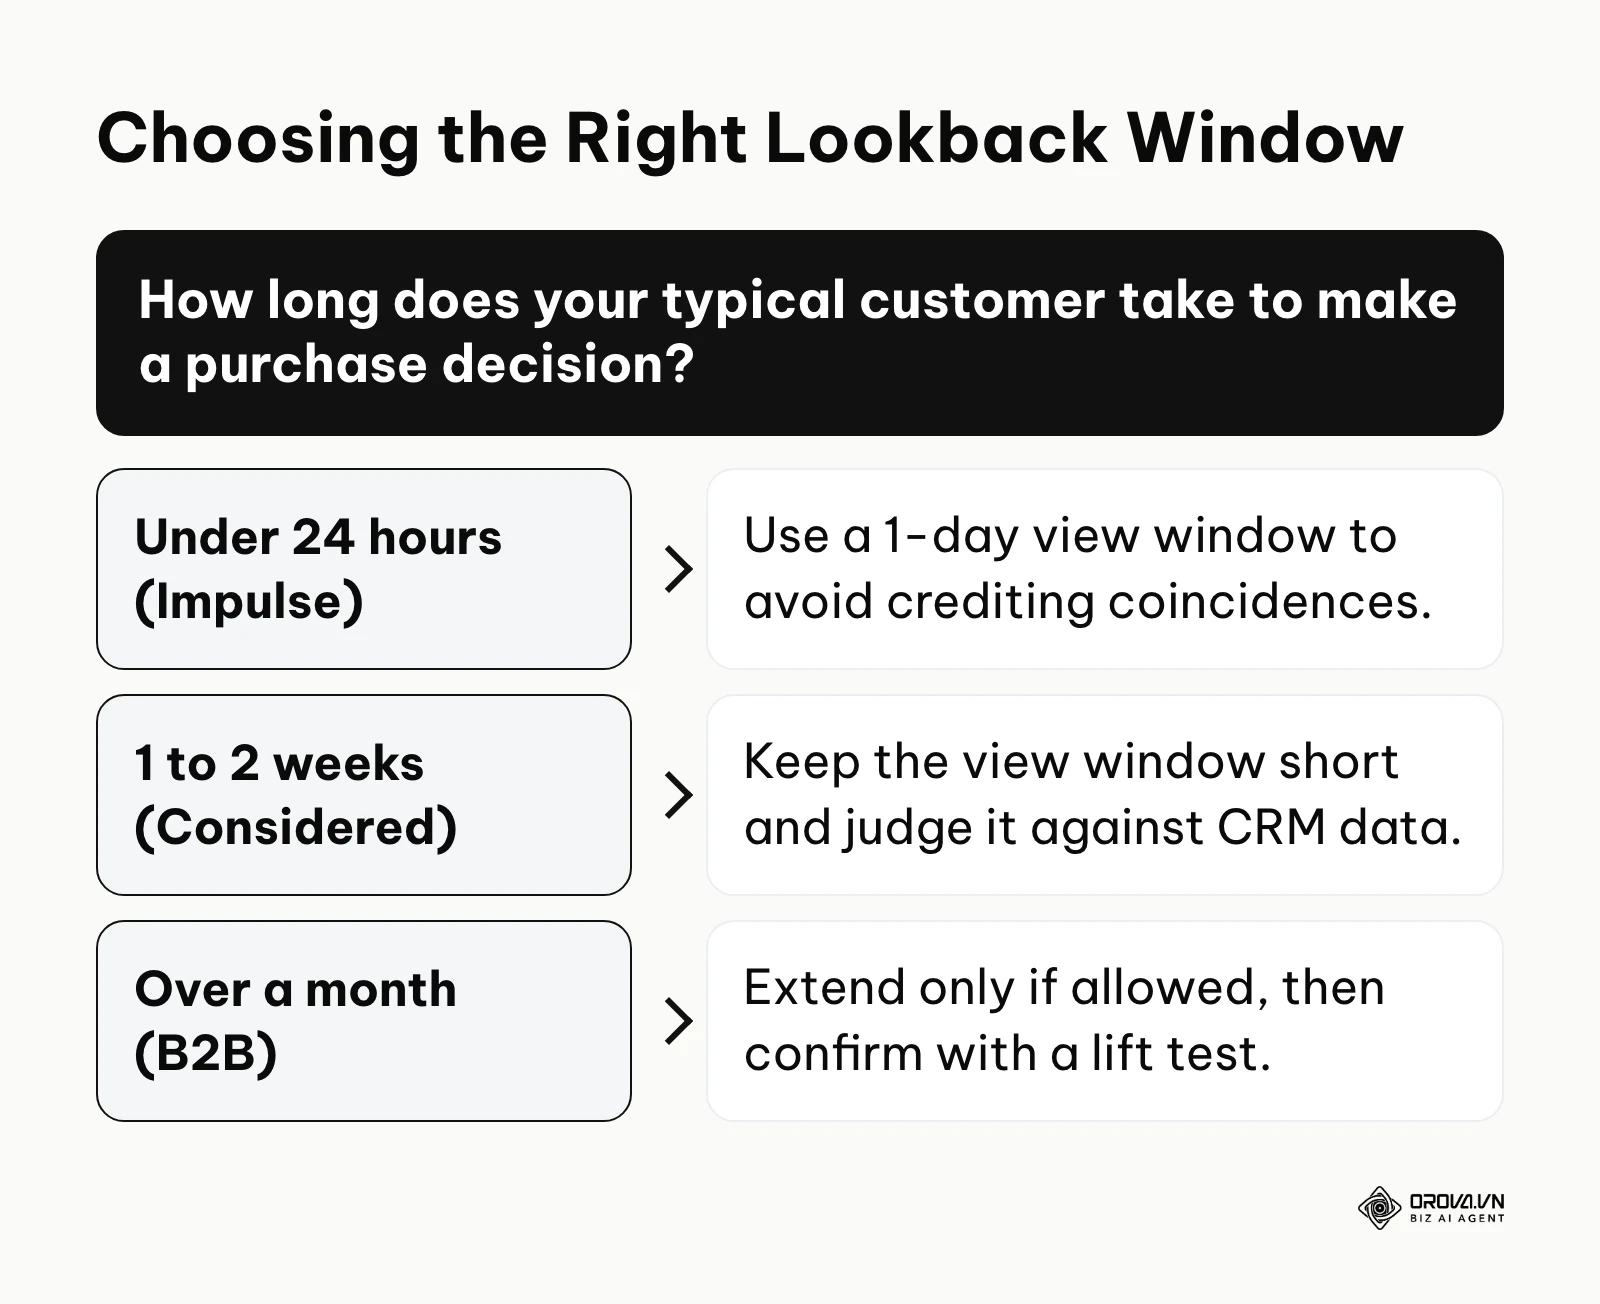
The platform then executes a historical search through its logs to see if that specific user was exposed to any ads recently. The parameter that dictates how far back in time the platform is allowed to look is called the lookback window (or attribution window). Meta's Business Help Center documentation on attribution settings explains that this window helps advertisers align platform reporting with their actual business sales cycles.
The inputs here are the conversion timestamp and the advertiser-defined window limit. The output is either an attributed conversion value added to your dashboard, or nothing if the impression occurred outside the window. Defaults differ by platform: Meta's standard setting is 7-day click and 1-day view, and the Google Ads view-through conversion window defaults to 1 day but can be extended up to 30 days per conversion action. Always check the exact current options in each platform's help center. The biggest failure point here is over-crediting. Any view window that is longer than your real purchase cycle lets a platform claim credit for sales that would have happened anyway, making the network look more profitable than it is.
Deduplicating cross-channel data to avoid double counting
This is the most critical operational gap in modern digital marketing. Because platforms operate in silos, they do not talk to each other. If a user sees a Meta ad on Monday, sees a TikTok ad on Tuesday, and buys on Wednesday, both Meta and TikTok will claim 100% credit for the exact same sale in their respective dashboards. If you sum up the totals from your ad accounts, you will mathematically always exceed your actual revenue.
To solve this, you must implement a rigorous deduplication framework.
- Establish a single source of truth: You must select an independent analytics platform (like Google Analytics 4) to act as the final judge. Never rely on the self-reported numbers from the ad networks themselves, as they have a vested financial interest in grading their own homework.
- Standardize UTM parameters: Ensure that every single campaign, ad set, and ad uses a perfectly uniform URL tracking structure. This allows your independent analytics platform to correctly categorize incoming traffic.
- Separate view and click reporting: In your dashboards, always create separate custom columns for click-based conversions and view-based conversions. Never merge them into a single "Total Conversions" metric, as it obscures user intent.
- Implement hierarchical priority rules: Set up your reporting software so that the last direct click always takes priority over any previous views. If a user viewed a Meta ad but ultimately clicked a Google Search ad to buy, Google should get the primary credit.
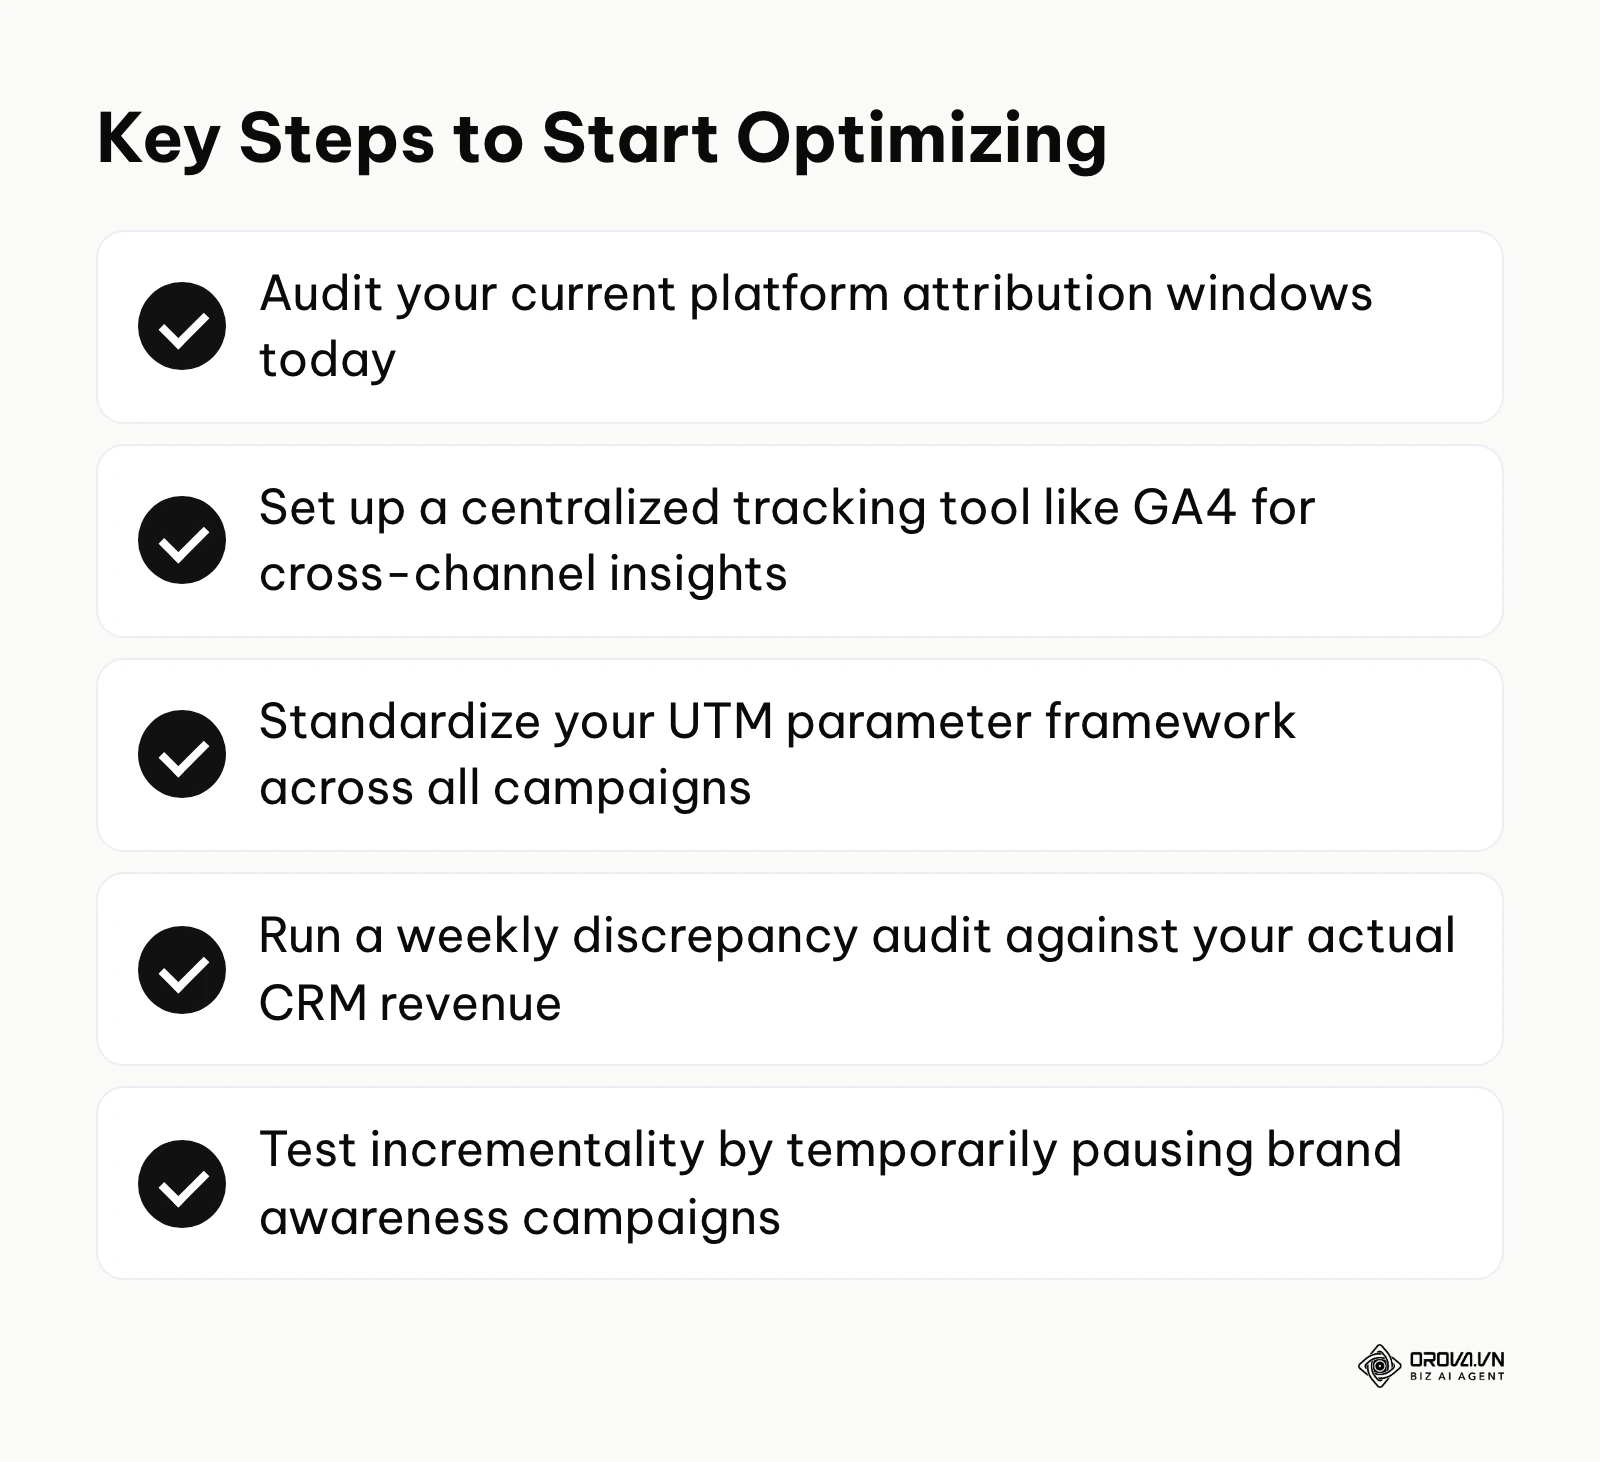
- Run weekly discrepancy audits: Schedule a recurring weekly task to export data from all platforms and match it against your real business revenue to monitor the exact inflation percentage.
Auditing platform data against your CRM
To truly understand how inflated your platform data is, you need to perform a discrepancy audit comparing the platform claims against your actual Customer Relationship Management (CRM) or e-commerce backend (like Shopify or Magento).
Below is a standard discrepancy audit spreadsheet template you can recreate in Excel or Google Sheets. By doing this weekly, you establish a baseline "inflation rate" for your ad accounts.
| Date | Campaign Name | Platform VTC | Platform CTC | Total Platform Claims | Actual CRM Orders | Discrepancy Inflation |
|---|---|---|---|---|---|---|
| 2026-10-01 | Q4_Brand_Awareness | 145 | 35 | 180 | 110 | +63.6% |
| 2026-10-08 | Retargeting_Promo | 85 | 120 | 205 | 165 | +24.2% |
| 2026-10-15 | Cold_Prospecting | 210 | 40 | 250 | 130 | +92.3% |
Illustrative example: A direct-to-consumer apparel brand ran heavy prospecting campaigns simultaneously on Meta and Google Display. At the end of the month, Meta reported 500 view-through conversions, and Google reported 400. However, the Shopify CRM only showed 600 total new customer orders. The data analyst exported the conversion timestamp logs from both ad platforms and mapped them against the CRM orders. They discovered that over 300 users had been served both a Meta ad and a Google ad during the week, leading both platforms to claim full credit for the same transactions. By implementing a priority rule in their centralized reporting that favored the last click, the discrepancy dropped from an inflated fifty percent down to a manageable twelve percent, giving the leadership a realistic view of performance.
Measuring true incrementality
How do you know if the ad actually caused the sale, or if the user was going to buy your product anyway? This is the concept of incrementality.
To measure this, you must run a lift test. The inputs require splitting your target audience into a test group (who sees the ads) and a holdout group (who is artificially prevented from seeing the ads). You then compare the conversion rates of both groups. The output is the incremental lift percentage. If the test group converts at four percent and the holdout group converts at three percent, the ad generated one percentage point of incremental conversions, which is a relative lift of about 33 percent. The primary failure point of this method is sample size; you need significant traffic volume to achieve statistical significance, making it difficult for smaller businesses to execute properly.
Types of view through tracking environments
Different ad formats generate different types of view-based behavior. Understanding these nuances is crucial, especially when scaling campaigns, as outlined in our facebook video ads guide.
| Type of Campaign | Core Characteristic | Best Suited For |
|---|---|---|
| Video Advertisements | High engagement, forced attention (unskippable formats), strong audio-visual memory impact. | Launching new complex products that require explanation before purchase. |
| Static Display Banners | Low engagement, peripheral vision placement, massive scale across millions of websites at low cost. | Staying top-of-mind for long B2B sales cycles or persistent retargeting. |
| Social Media Feeds | Rapid scrolling environment, native integration among organic content, highly visual. | Fashion, consumer goods, and lifestyle products relying on impulse desires. |
What is a good view through conversion rate?
Advertisers constantly ask for industry benchmarks, but there is no reliable public standard for view through conversion rates. The number depends on the platform's view window, which impressions it counts, how much of your audience already knows your brand, and how long your buying cycle is. A rate copied from another account, measured with a different window, tells you almost nothing about yours.
A more useful approach is to build your own baseline. Track your view through conversion rate per campaign alongside the other numbers in your ad performance metrics review, keep the attribution window fixed, and compare each campaign against its own history and against your CRM audit.
| What to compare | Why it matters | What a warning sign looks like |
|---|---|---|
| Same campaign, month over month | Shows whether creative or targeting changes affect delayed conversions | Rate rises while CRM orders stay flat |
| Prospecting vs retargeting | Retargeting audiences already intended to buy, so their view conversions are easier to claim | Retargeting shows far more view conversions than click conversions |
| Platform claims vs holdout test | Separates coincidence from real lift | Holdout group converts almost as often as the exposed group |
How to start optimizing view through conversions
Transitioning from taking platform data at face value to actively optimizing based on verified, deduplicated metrics requires a shift in daily operations. The approach varies significantly depending on your role within the organization.
For e-commerce founders
Founders need clarity on cash flow, not technical vanity metrics. Your focus should be on aligning what the ad platforms report with the actual money hitting your bank account.
- Audit default settings: Log into every ad account today and identify the current attribution windows. If any view window is longer than your real purchase cycle, shorten it (for most impulse purchases, 1 day is enough) to stop gross over-reporting.
- Consolidate your platforms: Stop looking at five different browser tabs. Funnel all your data into a single business dashboard to visualize the total marketing spend versus total CRM revenue.
- Focus on blended Return on Ad Spend (ROAS): Instead of worrying about which platform gets the view credit, divide your total daily revenue by your total daily ad spend across all channels to measure true business health.
- Implement strict post-purchase surveys: Add a simple "How did you hear about us?" dropdown on your checkout page. This qualitative data is often more accurate than any algorithmic view tracking.
For in-house performance marketers
In-house marketers have the technical access needed to build sophisticated reporting. Your goal is to separate the signal from the noise when reviewing your facebook ads report, ensuring you only scale campaigns that generate true lift.
- Set up incrementality holdouts: Work with your ad representatives to run geographical split tests, turning ads off in specific cities to measure the baseline organic sales rate.
- Negotiate reporting standards: Have a frank conversation with leadership about the difference between click and view metrics so they are not surprised when you present deduplicated, lower numbers.
- Build custom deduplication columns: Modify your daily reporting views to clearly show cost-per-click-acquisition versus cost-per-view-acquisition.
- Monitor assisted overlaps: Use Google Analytics path length reports to see exactly how often your display campaigns serve as the first touchpoint before a direct search.
For media buying agencies
Agencies face the difficult task of proving their value to clients without appearing deceptive. Transparency is your greatest asset here; during your initial facebook ad account setup, ensure the client understands how impressions will be measured.
- Educate clients early: Explain the concept of the lookback window during onboarding so clients understand why platform numbers will never perfectly match their Shopify dashboard.
- Separate brand and performance KPIs: Never judge a top-of-funnel display campaign by its direct cost-per-acquisition. Judge it by its cost-per-mille (CPM) and its impact on the overall branded search volume.
- Utilize clean room environments: For enterprise clients, leverage data clean rooms to securely match the client's first-party customer data with the ad platform's log files without violating privacy laws.
- Validate cross-device paths: Use advanced analytics to demonstrate how a user who viewed an ad on a mobile device ultimately completed the purchase on a desktop computer a week later.
| Common Mistake | Consequence | How to Avoid |
|---|---|---|
| Using long view windows without checking | The platform claims credit for organic, recurring customers who just happened to scroll past an ad. | Manually adjust the lookback window to reflect your actual, historical time-to-purchase data. |
| Adding clicks and views together | You obscure user intent and optimize toward cheap impressions rather than high-quality traffic. | Always separate the metrics into distinct columns when presenting reports to stakeholders. |
| Ignoring the CRM discrepancy | You scale ad spend based on an illusion of profitability, eventually causing a cash flow crisis. | Run a strict weekly audit comparing total platform claims against actual cleared bank deposits. |
Illustrative example: A fast-moving consumer goods retailer selling protein bars had extended the view-through window on their display campaigns to 30 days. The dashboard showed an incredibly low cost per acquisition of two dollars. The agency analyzed the time-to-purchase report and found that ninety percent of genuine new buyers complete their purchase within 48 hours. The 30-day window was simply taking credit for existing loyal customers who saw an ad while scrolling but were going to buy their monthly supply anyway. The team reduced the view-through window to just 1 day. Consequently, the reported cost per acquisition doubled, but it finally reflected the true cost of acquiring a net-new customer, allowing the brand to stop wasting spend. The team also tightened its facebook ads targeting to exclude existing buyers.
Want to scale your budget but afraid of breaking performance? 📉
Integrate OROVA ADS now - an AI Agent that automatically monitors and optimizes Google, Meta, TikTok ads 24/7. Now, expanding and replicating your Performance Ads team is just one click away.
🚀 Try it now at: orova.vn/ads
View through conversion trends for the next few years: an author's perspective
As of 2026, the landscape of digital measurement is undergoing a massive structural shift due to privacy legislation, browser restrictions, and the rapid advancement of artificial intelligence. Based on these current signals, I foresee three major trends reshaping how we measure ad impressions over the next few years.
Privacy restrictions will shift measurement to modeled conversions
Safari and Firefox already block third-party tracking cookies by default, and mobile tracking consent prompts have weakened legacy deterministic tracking. I believe that in the next two to three years, pure view-through measurement will become almost entirely synthetic. Instead of tracking an exact user from an ad impression to a website visit, platforms will rely on aggregated data and machine learning to estimate how many conversions likely occurred. To prepare for this, marketers must prioritize building massive first-party data assets, collecting emails and phone numbers directly to feed back into the platforms through server-side connections such as a conversion API. Of course, this prediction could be entirely upended if a new, privacy-compliant universal identification protocol is unexpectedly adopted by all major browsers.
AI will dynamically adjust lookback windows based on user behavior
Right now, marketers manually guess whether a 1-day or 7-day window is appropriate for their campaigns. I anticipate that advertising platforms will soon roll out AI-driven dynamic lookback windows. The AI will analyze individual user behavior patterns and automatically assign a shorter window for impulsive buyers and a longer window for users who exhibit extensive research habits. This will theoretically reduce the over-crediting problem automatically. Marketers should prepare by ensuring their CRM data is meticulously clean, as feeding bad data into these future AI models will result in catastrophic budget optimization.
Media mix modeling will replace rigid attribution models
Multi-touch attribution software is struggling to ingest view-level data because platforms share fewer granular log files as privacy rules and online advertising regulations tighten. I strongly believe we will see a massive resurgence in Media Mix Modeling (MMM)—a statistical technique that looks at aggregate spend and aggregate revenue without needing user-level tracking. In the near future, instead of agonizing over whether a specific view led to a specific sale, teams will use MMM tools to see how increasing top-of-funnel spend broadly lifts total company revenue. You should start archiving your daily spend and revenue data in clean spreadsheets immediately to train these future models.
Frequently asked questions about view through conversions
How do I track view through conversions across different platforms?
You cannot effectively track them across platforms using the native dashboards because they do not share data with each other. To get an accurate picture, you must use an independent third-party analytics tool, implement strict UTM tracking, and utilize server-side API connections to pass conversion data back to a centralized warehouse for deduplication.
View through conversion vs click through conversion: Which is more important?
Neither is inherently more important; they measure completely different stages of intent. Click-through conversions are vital for evaluating immediate bottom-of-funnel demand capture and calculating direct return on investment. View-through metrics are crucial for evaluating top-of-funnel brand awareness and understanding the latent impact of your visual creative strategy.
What is a good view through conversion rate for social media campaigns?
There is no reliable universal benchmark, because the rate depends on the view window, the audience, and the product. Google's documentation on data-driven attribution describes how ad platforms use machine learning to distribute credit across the conversion path, so you should benchmark against your own historical data with a fixed window rather than chasing industry averages.
Will view through tracking still be necessary when AI fully automates ads?
Yes, absolutely. Even if AI completely takes over bidding and targeting, the AI still needs to know what success looks like. If you feed the AI inflated view-through data, the algorithm will aggressively optimize toward serving cheap impressions to people who were going to buy anyway, completely wasting your budget. Human oversight of attribution rules remains critical.
Should I include view-throughs in my main ROI calculation?
You should generally exclude them from your strict, immediate Return on Ad Spend (ROAS) calculations used for daily budget adjustments, as they often inflate performance. However, you should include a modeled portion of them when calculating your long-term Customer Acquisition Cost (CAC) and evaluating the overall health of your media mix.
Where should you start?
Knowing that platform data is inherently flawed can be paralyzing. However, the solution is not to turn off your campaigns, but rather to methodically audit and adjust your tracking infrastructure. Your immediate next steps depend entirely on your current state of operational maturity.
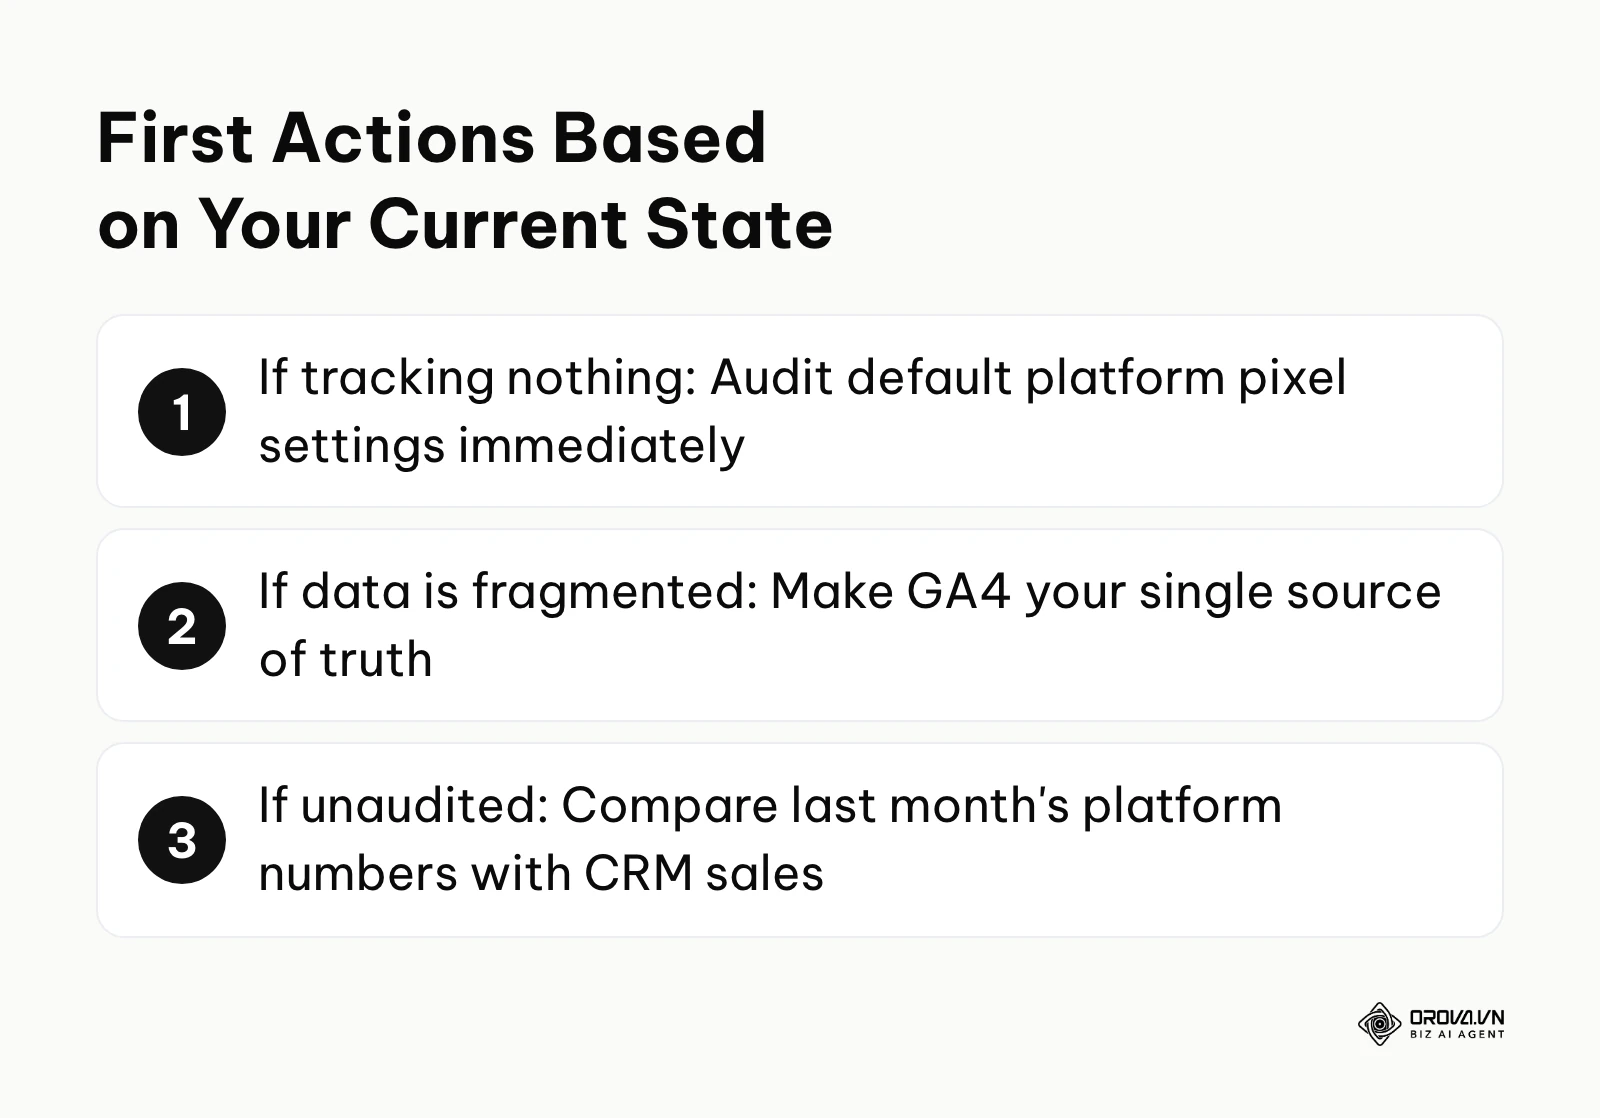
- If you have nothing tracked or audited: Your very first action should be to audit your default platform pixel settings immediately. Log into your Google Ads and Meta business managers. It takes less than half a day to locate the attribution settings tab. Shorten any view window that is longer than your real purchase cycle, often to 1 day. This single action will instantly stop gross over-reporting and give you a much more realistic baseline by tomorrow morning.
- If your data is tracked but fragmented across platforms: Your priority is establishing a single source of truth. Spend your next afternoon setting up Google Analytics 4 (GA4) properly. Ensure every active campaign uses a standardized UTM parameter framework. This creates an independent environment where you can evaluate traffic without the inherent bias of the ad networks grading their own homework.
- If you have tracking but never verify the results: You need to run your first CRM discrepancy check. Export last month's total platform-reported conversions and compare them line-by-line with the actual cleared sales in your CRM. Calculate the exact percentage difference. Once you know your specific inflation rate, you can mathematically discount future platform reports to make accurate budgeting decisions.
By systematically challenging platform data and applying rigorous deduplication frameworks, you can finally uncover the genuine impact of your view through conversions.
About the author

Builder of Orova
Nguyễn Đỗ Trọng Ân has 8 years of experience in marketing, including 6 years managing market development across Asia. He builds Orova, a Biz AI Agent that never sleeps: it plans, runs and optimizes work for businesses.
Run your business with AI Agents
Orova is the always-on Biz AI Agent — it plans, runs, and optimizes the work for you.
Save time, unlock productivity.